
Drug definition WHO
WHO World Health Organization official definition of drug
WHO Definition of Drug
Original WHO Definition (1969)
"A substance that, when taken into a living organism, may modify one aspect of its function."
Refined WHO Multi-Level Definition
- Broadest level (Level 1):
"Any chemical entity or mixture of entities, other than those required for the maintenance of normal health, the administration of which alters the biological function and bodily structure."
-
Second level - Therapeutic use: Drugs used for the treatment or alleviation of disease - known as medications or therapeutic agents.
-
Third level - Classification by target system or function: Drugs differentiated based on the bodily system or function on which they exert their most marked or obvious effects (e.g., diuretics, CNS stimulants, etc.).
-
Public health/concern level: Focus on possible adverse effects on health or social function - particularly psychoactive drugs and similar agents.
WHO on Psychoactive Drugs (Current)
"Psychoactive drugs are substances that, when taken in or administered into one's system, affect mental processes, e.g. perception, consciousness, cognition or mood and emotions."
WHO Drug Abuse Definition (1969)
"Persistent or sporadic excessive drug use inconsistent with or unrelated to acceptable medical practice."
Summary Table
| Context | WHO Definition |
|---|---|
| General (1969, original) | Any substance that modifies one aspect of a living organism's function |
| Refined (broadest) | Any chemical entity (beyond normal health maintenance) that alters biological function or structure |
| Medicinal/Therapeutic | Substances used to treat or alleviate disease (medications) |
| Psychoactive | Substances affecting mental processes (perception, consciousness, cognition, mood) |
| Drug Abuse | Persistent or sporadic excessive use inconsistent with acceptable medical practice |
Therapeutic drug monitoring
therapeutic drug monitoring definition indications principles clinical practice
therapeutic drug monitoring therapeutic window concentration time curve
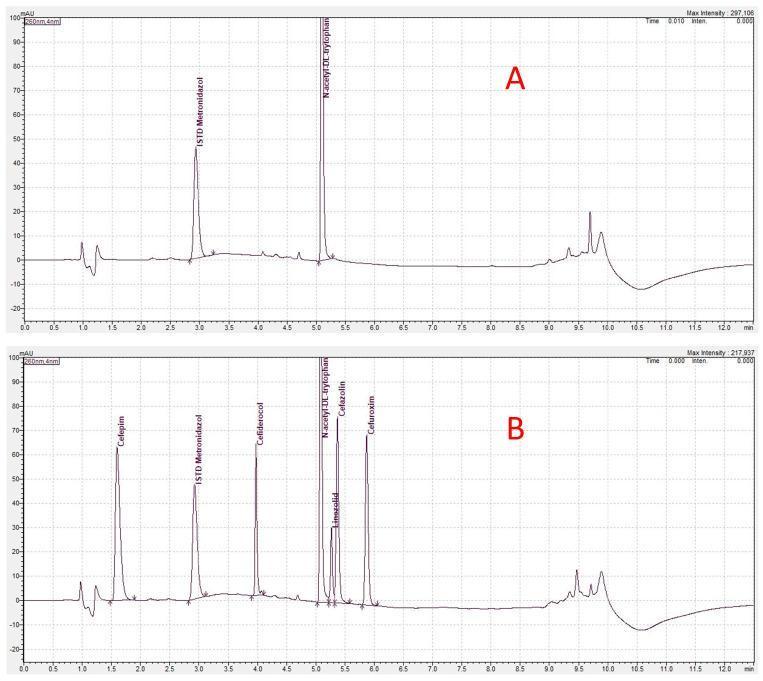
This diagnostic image shows a High-Performance Liquid Chromatography (HPLC) chromatogram comparison used for drug concentration monitoring in a clinical ex vivo study. The x-axis represents retention time (minutes), and the y-axis represents UV-adsorption (260 nm) measured in milli-absorbance units (mAU). Panel A (Control) displays a probe with only internal standards: Metronidazole (retention time ~3.0 min) and N-acetyl-DL-tryptophan (~5.1 min), a stabilizer in human albumin. Panel B (Sample) demonstrates the multi-drug detection capability, showing distinct, sharp peaks for several cephalosporins and linezolid in addition to the standards. Key peaks in Panel B include Cefepime (~1.6 min), Metronidazole (~3.0 min), Cefiderocol (~4.0 min), N-acetyl-DL-tryptophan (~5.1 min), Linezolid (~5.3 min), Cefazolin (~5.5 min), and Cefuroxime (~5.9 min). This visualization is used to illustrate the resolution and stability of therapeutic drug monitoring protocols for critically ill patients, specifically those undergoing Extracorporeal Membrane Oxygenation (ECMO) treatment where drug pharmacokinetics may be altered.
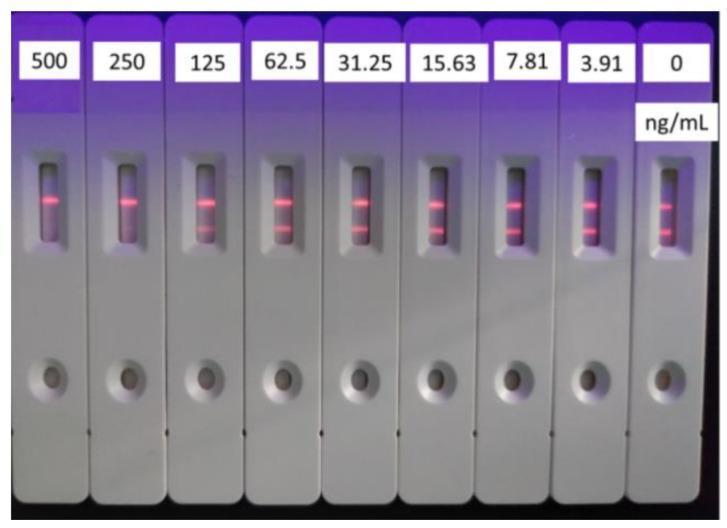
This clinical laboratory photograph displays a series of nine time-resolved fluorescent immunochromatographic assay (TRFICA) test strips, arranged from left to right to demonstrate a standard curve for the antibiotic tylosin. Each vertically oriented cassette features a sample well at the bottom and a viewing window above. Within the viewing window, fluorescent pink lines are visible under ultraviolet light. The concentration of tylosin decreases from left to right (500, 250, 125, 62.5, 31.25, 15.63, 7.81, 3.91, and 0 ng/mL). Each strip shows a top Control line (C-line) for assay validation. The Test line (T-line), positioned just below the C-line, demonstrates a competitive inhibition profile: the fluorescent intensity of the T-line is absent or faint at high tylosin concentrations (500 ng/mL) and increases progressively as the concentration decreases toward 0 ng/mL. This visual progression illustrates the quantitative detection capability of the assay, commonly used for monitoring antibiotic residues in food products like milk to prevent drug resistance and allergic reactions.
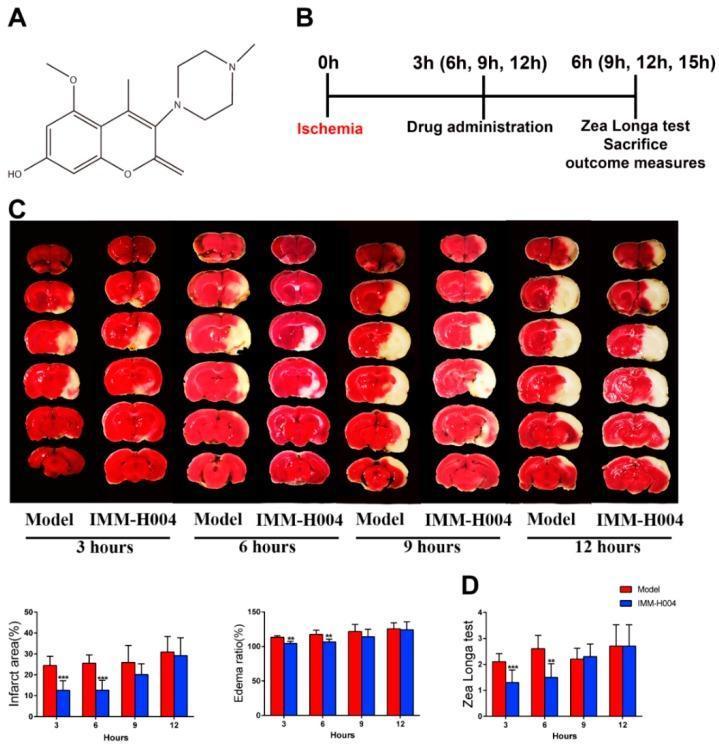
This composite educational infographic illustrates a therapeutic time window experiment for IMM-H004 in a permanent focal cerebral ischemia rat model. Panel A displays the chemical structure of IMM-H004. Panel B outlines the experimental timeline, including ischemia induction, drug administration, and neurobehavioral assessment. Panel C presents representative coronal brain sections stained with 2,3,5-triphenyltetrazolium chloride (TTC). Viable tissue appears deep red, while infarcted tissue appears white. The sections compare a 'Model' group (untreated stroke) and an 'IMM-H004' treated group at 3, 6, 9, and 12 hours post-ischemia. Visually, IMM-H004 treatment shows a marked reduction in the white infarcted area at 3 and 6 hours compared to the model. By 9 and 12 hours, the infarct sizes are comparable between groups. Panel D contains bar graphs quantifying the infarct area percentage, edema ratio, and Zea Longa neurobehavioral test scores, confirming significant neuroprotection within a 0–6 hour therapeutic window. This material is used to demonstrate stroke pathophysiology and pharmacological intervention windows.
Therapeutic Drug Monitoring (TDM)
Definition
"The measurement made in the laboratory of a parameter that, with appropriate interpretation, will directly influence prescribing procedures. Commonly, the measurement is in a biological matrix of a prescribed xenobiotic."
Rationale and Basis
- Dose → plasma/blood drug concentration
- Drug concentration → therapeutic (or toxic) effect
- Henry's Clinical Diagnosis and Management by Laboratory Methods notes that serum levels must be frequently determined because of toxic side effects AND because lack of patient compliance can produce subtherapeutic levels. Non-adherence is a major cause of morbidity and mortality across all age groups.
Pharmacokinetic Foundation
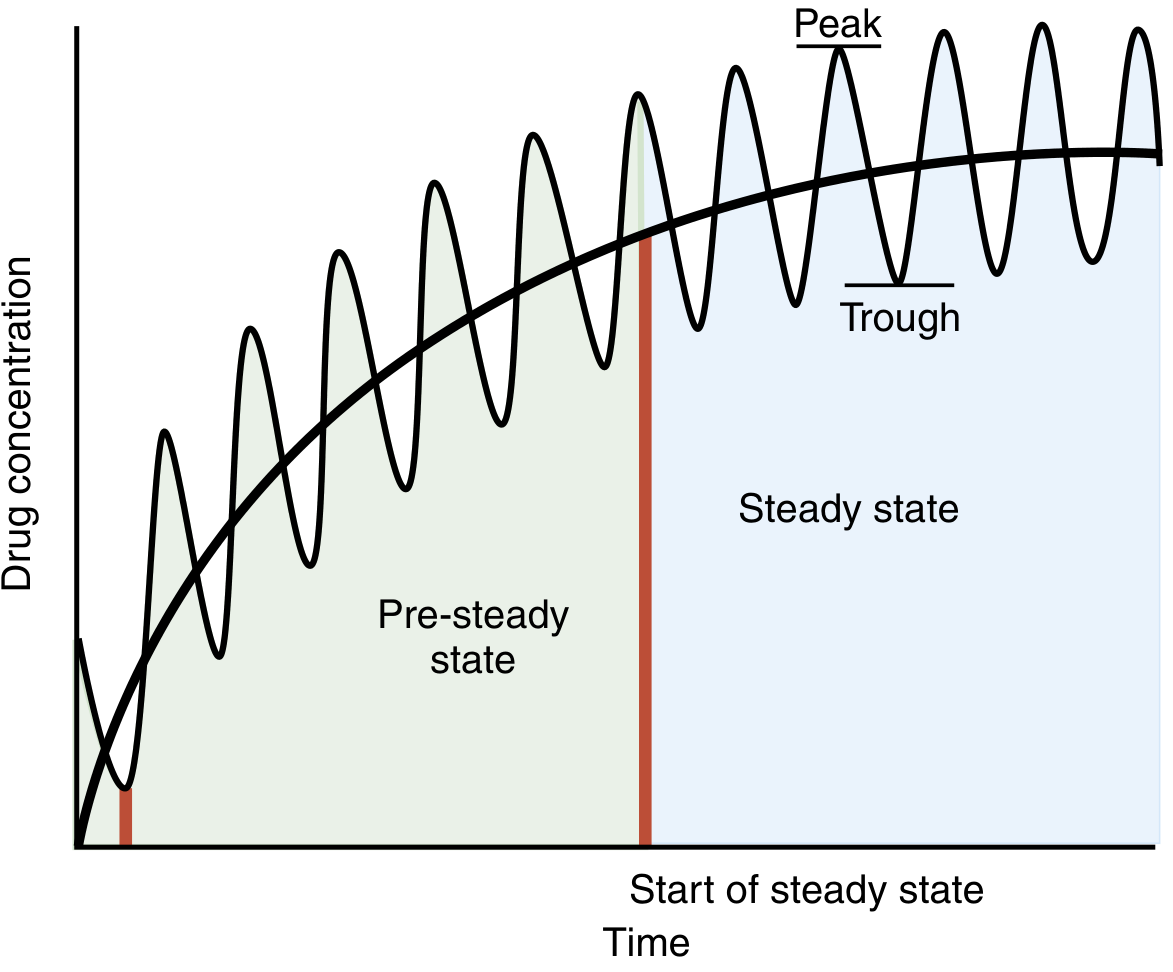
- Pre-steady state: Drug accumulates with each dose; peaks and troughs rise progressively.
- Steady state: Achieved after approximately 4-5 half-lives, when the amount absorbed equals the amount eliminated. Peaks and troughs stabilize at constant values.
- Loading dose: Can be given to immediately achieve steady-state peak concentration, bypassing the pre-steady state phase.
Key Pharmacokinetic Parameters in TDM
| Parameter | Definition | Relevance to TDM |
|---|---|---|
| Half-life (t½) | Time to reduce concentration by 50% | Determines dosing interval and time to steady state |
| Volume of distribution (Vd) | Apparent space drug distributes into | Affects loading dose calculation |
| Clearance (CL) | Rate of drug elimination relative to concentration | Key for maintenance dose adjustment |
| Bioavailability (F) | Fraction reaching systemic circulation | Varies between oral formulations |
| Protein binding | Fraction bound to plasma proteins | Only free (unbound) drug is pharmacologically active |
CL/F (patient) = Dosing rate / C_ss (measured)
Indications for TDM
| Indication | Explanation |
|---|---|
| Narrow therapeutic index | Small difference between effective and toxic dose (e.g., digoxin, lithium, phenytoin) |
| High inter-patient pharmacokinetic variability | Differences in absorption, distribution, metabolism, excretion (ADME) between individuals |
| No easily measurable clinical endpoint | Effect cannot be directly assessed (e.g., immunosuppressants) |
| Suspected toxicity | Confirm concentration-related adverse effects |
| Suspected non-compliance | Verify patient adherence |
| Drug-drug or food-drug interactions | Identify altered metabolism or displacement |
| Special physiological states | Pregnancy, renal/hepatic impairment, extremes of age |
| Change in formulation | Different bioavailability may alter levels |
| Breakthrough therapeutic failure | e.g., seizure recurrence despite antiepileptic therapy |
When to Sample (Timing)
- Trough sampling (just before the next dose): Most commonly used. Reflects minimum steady-state concentration. Best for assessing drug accumulation (e.g., in renal failure) and adjusting maintenance dosing.
- Peak sampling (shortly after dose/infusion): Used when concern is whether efficacious concentrations are being reached, especially for antibiotics like aminoglycosides.
- Sample at steady state: For dose adjustment purposes, samples must be collected at steady state (after ~4-5 half-lives).
"Early postabsorptive concentrations do not reflect clearance. When the goal of measurement is dosage adjustment, the sample should be taken just before the next planned dose."
- Goodman & Gilman's Pharmacological Basis of Therapeutics
Common Drugs Requiring TDM
Antiepileptics
| Drug | Therapeutic Range |
|---|---|
| Carbamazepine | 4-12 mcg/mL |
| Phenytoin | 10-20 mcg/mL |
| Valproate | 50-100 mcg/mL |
| Lamotrigine | 3-13 mcg/mL |
| Levetiracetam | 5-41 mcg/mL |
| Ethosuximide | 40-100 mcg/mL |
| Clonazepam | 0.013-0.038 mcg/mL |
Antibiotics (Aminoglycosides - e.g., Amikacin)
| Dosing Method | Peak Level | Trough Level |
|---|---|---|
| Conventional | 20-30 mg/L | 5-10 mg/L |
| High-dose extended interval (CF) | 80-120 mg/L | <10 mg/L |
Other Key Drugs
| Drug Class | Examples |
|---|---|
| Cardiac glycosides | Digoxin (0.5-2 ng/mL) |
| Mood stabilizers | Lithium (0.6-1.2 mEq/L) |
| Immunosuppressants | Cyclosporine, Tacrolimus, Everolimus |
| Antiarrhythmics | Lidocaine, Amiodarone |
| Bronchodilators | Theophylline (10-20 mcg/mL) |
| Antibiotics | Vancomycin, Aminoglycosides |
| Antifungals | Voriconazole, Itraconazole |
How TDM Is Performed
- Prescribe the drug with an estimated starting dose (based on population pharmacokinetics)
- Administer and allow drug to reach steady state
- Collect blood sample at the appropriate time (trough or peak)
- Assay the sample - most commonly by immunoassay (FPIA, CLIA, EMIT)
- Interpret concentration in clinical context (patient condition, co-medications, organ function)
- Adjust dose using the relationship: New Dose = Old Dose × (Target C_ss / Measured C_ss)
- Repeat after achieving new steady state to confirm target reached
Limitations of TDM
- Protein binding variation (only free drug is active; total levels may mislead in hypoalbuminemia)
- Active metabolites may not be measured (e.g., oxcarbazepine's active metabolite eslicarbazepine)
- Pharmacodynamic variability - patients may respond differently at the same concentration
- Compliance issues independent of pharmacokinetics
- Cost and laboratory requirements
- Therapeutic ranges are population averages - individual ranges may differ