
How to read an ECG as a beginner fast and easy
Reading File
Reading an ECG (electrocardiogram) involves a systematic approach. Here's a quick overview: check rate, rhythm, axis, P waves, PR interval, QRS complex, ST segment, and T waves. The standard mnemonic is "Rate, Rhythm, Axis, Intervals, Morphology."
Searching sources...
Finding Sources
Searching the Web
how to read ECG beginner step by step guide
Reading File
Finding Sources
Finding Sources
Finding Sources
Reading File
Reading File
Loading Image
Loading Image
Reading File
Loading Image
Finding Sources
I now have everything I need to give you a thorough, well-illustrated beginner's guide to ECG reading. Here it is:
How to Read an ECG: A Beginner's Step-by-Step Guide
First, Understand What the ECG Shows
An ECG records the electrical activity of the heart from 12 different "viewpoints" (leads). Every heartbeat produces a characteristic set of waves:
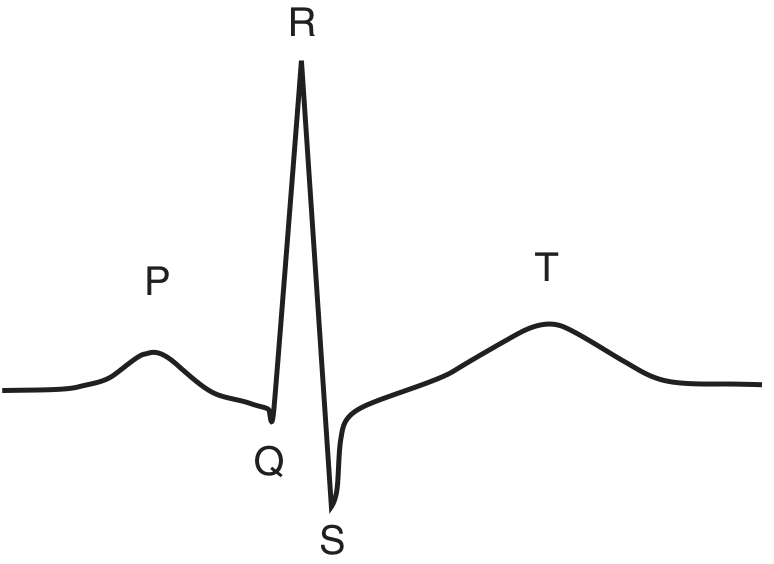
Normal ECG waveform showing P, Q, R, S, and T waves - Tietz Textbook of Laboratory Medicine
What each part means:
| Wave/Interval | What it represents |
|---|---|
| P wave | Atrial depolarization (atria contract) |
| PR interval | Conduction from atria through the AV node to ventricles |
| QRS complex | Ventricular depolarization (ventricles contract) |
| ST segment | Early ventricular repolarization |
| T wave | Ventricular repolarization (ventricles "reset") |
| QT interval | Total ventricular electrical activity |

ECG waveform with key intervals labeled - Costanzo Physiology 7th Edition
The ECG Paper: Know Your Grid
Standard ECG paper runs at 25 mm/sec:
- Small box (1 mm) = 0.04 seconds (40 ms)
- Large box (5 mm) = 0.2 seconds (200 ms)
- On the vertical axis, 10 mm = 1 mV of voltage amplitude
This grid is what lets you measure everything on the ECG.
The Systematic Approach: Use RRIAMPST
A great mnemonic for beginners. Work through every ECG in this order - never skip steps:
Step 1 - Rate
Normal: 60-100 beats per minute (bpm)
Quick method for regular rhythms:
- Find an R wave on a large box line
- Count the large boxes to the next R wave
- Divide 300 by that number
| Large boxes between R waves | Heart rate |
|---|---|
| 1 | 300 bpm |
| 2 | 150 bpm |
| 3 | 100 bpm |
| 4 | 75 bpm |
| 5 | 60 bpm |
| 6 | 50 bpm |
Memory trick: 300 - 150 - 100 - 75 - 60 - 50
For irregular rhythms: count all QRS complexes across the 10-second rhythm strip, then multiply by 6.
- < 60 bpm = Bradycardia
- > 100 bpm = Tachycardia
Step 2 - Rhythm
Ask two questions:
- Is it regular? Mark R wave peaks on a piece of paper and check if spacing is equal throughout.
- Is there a P wave before every QRS, and a QRS after every P?
Normal sinus rhythm = regular, P wave before every QRS, PR interval constant.
- Regularly irregular = pattern repeats (e.g., every 3rd beat is different)
- Irregularly irregular = completely disorganized - think atrial fibrillation (no P waves, chaotic baseline)
Step 3 - Axis
The electrical axis tells you which direction the heart's electrical activity flows. A quick beginner shortcut using leads I and aVF:
| Lead I | aVF | Axis |
|---|---|---|
| Positive (upright QRS) | Positive | Normal |
| Positive | Negative | Left axis deviation |
| Negative | Positive | Right axis deviation |
| Negative | Negative | Extreme axis deviation |
Normal axis = -30° to +90°.
Step 4 - P Waves
Normal P wave:
- Present before every QRS
- Upright (positive) in leads I, II, aVF
- Inverted in aVR
- Duration: < 0.12 sec (< 3 small boxes)
- Amplitude: < 2.5 mm height
Absent P waves with irregular rhythm = atrial fibrillation. Peaked tall P waves = right atrial enlargement ("P pulmonale"). Broad, notched P waves = left atrial enlargement ("P mitrale").
Step 5 - PR Interval
Measured from the start of the P wave to the start of the QRS complex.
Normal: 0.12-0.20 seconds (3-5 small boxes)
- Short PR (< 0.12 sec) = pre-excitation (Wolff-Parkinson-White syndrome) or junctional rhythm
- Prolonged PR (> 0.20 sec) = 1st degree AV block
- Progressively lengthening PR until a QRS is dropped = 2nd degree AV block (Mobitz I / Wenckebach)
- Fixed prolonged PR with dropped beats = Mobitz II
- No relationship between P and QRS at all = 3rd degree (complete) heart block
Step 6 - QRS Complex
Normal QRS duration: < 0.12 sec (< 3 small boxes)
- Narrow QRS (< 0.12 sec) = normal ventricular conduction
- Wide QRS (≥ 0.12 sec) = bundle branch block, ventricular rhythm, or Wolff-Parkinson-White
Bundle branch block quick ID:
- LBBB (Left BBB): Wide QRS + "W" shape in V1 and "M" shape in V5/V6 (William)
- RBBB (Right BBB): Wide QRS + "M" shape in V1 and "W" shape in V5/V6 (MoRRoW)
Pathological Q waves: Q wave > 1 small box wide (0.04 sec) or > 25% of following R wave height = suggests old myocardial infarction in that territory.
R-wave progression in chest leads V1-V6: R wave should get progressively taller from V1 to V5. Poor R-wave progression (R stays small) = anterior MI or LBBB.
Step 7 - ST Segment
This is one of the most clinically important parts. The ST segment should be flat and at baseline (isoelectric).
ST elevation (> 1 mm in limb leads, > 2 mm in chest leads):
- Convex/tombstone ST elevation = STEMI (ST-elevation myocardial infarction) - emergency!
- Saddle-shaped ST elevation in most leads = pericarditis
- Concave ST elevation = often benign early repolarization
ST depression:
- Horizontal or downsloping = myocardial ischemia or NSTEMI
- Digoxin effect = "reverse tick" or sagging ST depression
Lead territory to infarct location:
| Leads with changes | Territory | Artery |
|---|---|---|
| II, III, aVF | Inferior | Right coronary artery (RCA) |
| V1-V4 | Anterior | LAD |
| I, aVL, V5-V6 | Lateral | Circumflex |
| V1-V2 tall R, ST depression | Posterior | RCA or circumflex |
Step 8 - T Waves
Normal T waves: upright in I, II, V3-V6; inverted in aVR (always), V1 (often normal).
- Tall peaked T waves = hyperkalemia ("peaked" or "tent-shaped") or early MI (hyperacute T waves)
- Inverted T waves = ischemia, ventricular hypertrophy, bundle branch block, pulmonary embolism (V1-V4)
- Flat T waves = hypokalemia, ischemia
Bonus - QT Interval
Measured from start of QRS to end of T wave.
Normal corrected QTc: < 0.44 sec in men, < 0.46 sec in women (corrected for rate using Bazett's formula).
- Prolonged QT = risk of Torsades de Pointes (life-threatening arrhythmia). Causes: drugs (antiarrhythmics, antibiotics, antipsychotics), hypokalemia, hypomagnesemia, congenital long QT syndromes.
Quick Summary Checklist
Every time you pick up an ECG, run through this:
✅ Rate - fast, slow, or normal?
✅ Rhythm - regular? P before every QRS?
✅ Axis - normal, left, or right deviation?
✅ P waves - present, shape, size?
✅ PR interval - 0.12-0.20 sec?
✅ QRS - narrow or wide? Q waves?
✅ ST segment - elevated or depressed?
✅ T waves - upright and normal shape?
✅ QT interval - prolonged?
Helpful Video Resource
This 13-minute video walks through all 5 steps in a clear, visual way:
Key Normal Values at a Glance
| Parameter | Normal Value |
|---|---|
| Heart rate | 60-100 bpm |
| PR interval | 0.12-0.20 sec (3-5 small boxes) |
| QRS duration | < 0.12 sec (< 3 small boxes) |
| QT interval (corrected) | < 0.44 sec (men), < 0.46 sec (women) |
| P wave duration | < 0.12 sec |
| P wave amplitude | < 2.5 mm |
Sources: Goldman-Cecil Medicine (p. 535), Harrison's Principles of Internal Medicine 22E (p. 1592), Costanzo Physiology 7th Ed (p. 149), Tietz Textbook of Laboratory Medicine 7th Ed (p. 1771-1772).
The GeekyMedics ECG guide and Life in the Fast Lane ECG library are excellent free resources for practicing on real ECG examples.
This is a shared conversation. Sign in to Orris to start your own chat.