
Give me a 10 marks answer about Thromoelastogram including diagrams and flowcharts for AIIMS md anaesthesia exams from standard textbooks
Reading File
Now let me search the medical library for thromboelastogram content in parallel.
Finding Sources
Finding Sources
Finding Sources
Excellent! Found rich content. Now let me read the key anaesthesia textbook sections in parallel - especially Sabiston (has the diagram), Barash, and Miller's.
Reading File
Finding Sources
Finding Sources
I found the key TEG diagram URL. Let me now read more content from Morgan & Mikhail (anaesthesia-specific) and Miller's, and also fetch the TEG image in parallel.
Reading File
Reading File
Loading Image
Finding Sources
Excellent! I have the TEG diagram. Now let me get the TEG tracings for disorders (Sabiston block 24) and the Rockwood parameters content, plus fetch the second Morgan & Mikhail image:
Reading File
Reading File
Loading Image
Now let me fetch the TEG abnormal tracings image and get the remaining detailed content from Sabiston block 24:
Reading File
Loading Image
Finding Sources
I now have all the essential content - two excellent TEG diagrams, detailed parameter descriptions, abnormal tracings, and clinical management guidance. Let me compile the comprehensive AIIMS MD answer.
Thromboelastogram (TEG) - Comprehensive Answer for AIIMS MD Anaesthesia
Definition and Introduction
Thromboelastography (TEG) is a point-of-care viscoelastic hemostatic assay that provides a real-time, functional assessment of whole blood coagulation - from initial clot formation through fibrinolysis. It was first described by Hartert in 1948 and gained widespread perioperative application from the 1980s, particularly in liver transplantation and cardiac surgery.
Unlike conventional coagulation tests (PT/INR, aPTT, platelet count, fibrinogen) which measure isolated parts of coagulation in plasma-based systems, TEG assesses the entire hemostatic process including interactions between the coagulation cascade, platelets, and the fibrinolytic system.
"The advantage of VET over traditional coagulation tests is that VET is a real-time, detailed functional assay that provides information about clot formation, propagation, strength, and lysis." - Sabiston Textbook of Surgery, 10e, p. 946
Principle / Mechanism
Traditional TEG:
- A small blood sample (0.36 mL citrated whole blood) is placed in a cylindrical cup that oscillates at a fixed angle (4°45') and frequency (0.1 Hz) around a suspended pin (torsion wire)
- As clot forms, fibrin strands link the cup wall to the pin
- The torque transmitted to the pin is measured by a transducer and recorded as the thromboelastogram
- The amplitude of the trace correlates with clot strength/viscosity
TEG 6s (Haemonetics - newer iteration):
- The blood sample itself vibrates
- A light detector measures meniscus motion as clot forms (resonance technology - no mechanical pin/cup)
"Traditional TEG involves a pin suspended in a sample of patient blood, oscillating at a fixed frequency. As a clot forms and slows the movement of the pin, the torque is measured by a transducer and traced into the thromboelastogram." - Sabiston Textbook of Surgery, 10e, p. 945
The Thromboelastogram - Key Diagram
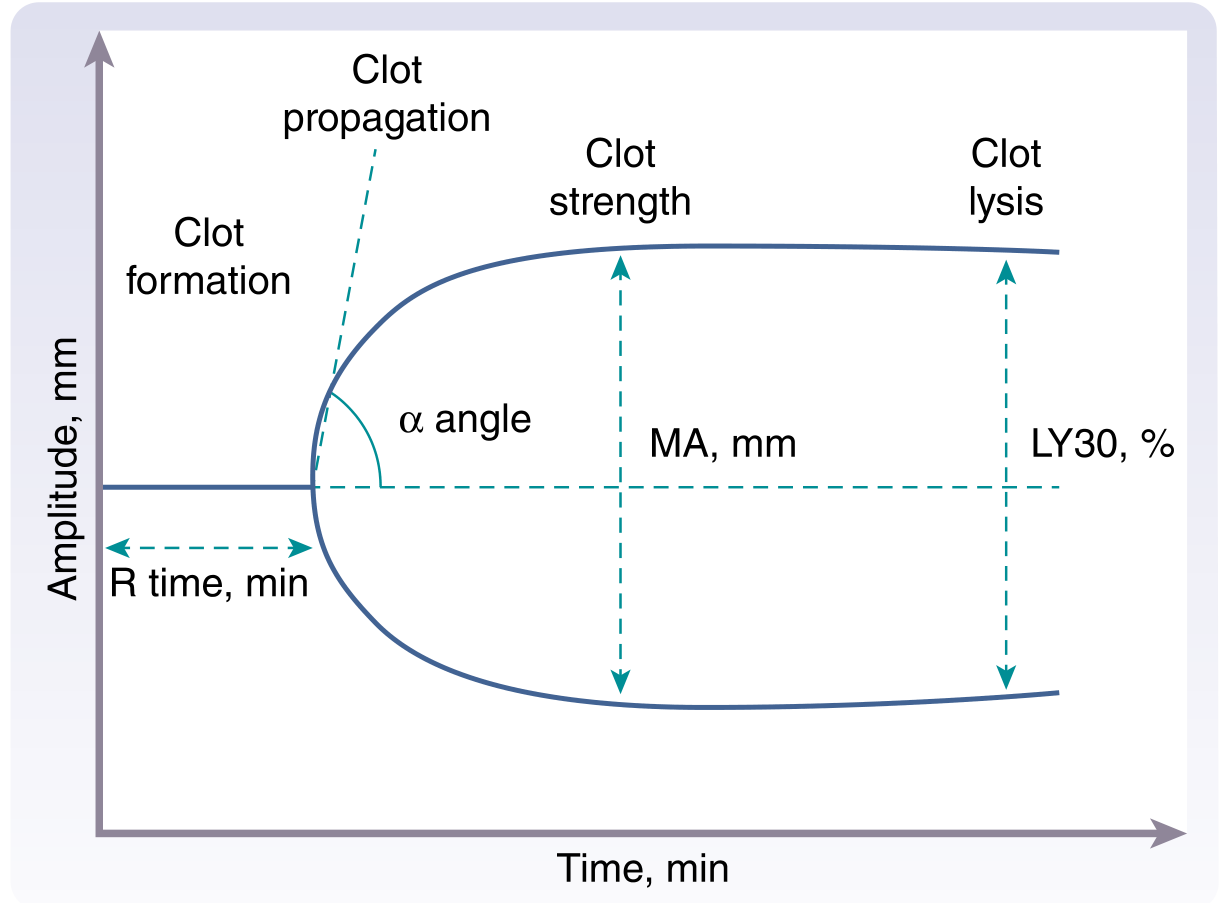
Figure: TEG tracing showing the four phases - clot formation (R time), clot propagation (α angle), clot strength (MA), and clot lysis (LY30). Source: Sabiston Textbook of Surgery, 10e, Fig. 46.1
TEG Parameters - Normal Values and Clinical Significance
| Parameter | Definition | Normal Value | Significance | Abnormality → Treatment |
|---|---|---|---|---|
| R time (Reaction time) | Time from start of test to first clot formation (2 mm amplitude) | 5-10 min | Coagulation factor activity - enzymatic phase; thrombin generation | Prolonged R → FFP / Factor concentrates |
| K time (Kinetical time) | Time from end of R to 20 mm amplitude | 1-3 min | Fibrin cross-linking; fibrinogen levels; clot solidification | Prolonged K → Cryoprecipitate |
| α angle (Alpha angle) | Slope of the tangent to the TEG curve at 2 mm amplitude | 53-72° | Rate of fibrin polymerization; fibrinogen function | Decreased α → Cryoprecipitate |
| MA (Maximum Amplitude) | Peak width of the tracing - highest amplitude | 50-70 mm | Peak clot strength; platelet-fibrin interaction (~80% platelet contribution) | Decreased MA → Platelet transfusion or DDAVP |
| LY30 (Lysis at 30 min) | % reduction in amplitude 30 min after MA | <7.5% | Fibrinolysis rate | Elevated LY30 → Tranexamic acid (TXA) or aminocaproic acid |
| CL30 (Clot lysis 30 min) | % clot remaining at 30 min after MA | >92.5% | Inverse of LY30 | - |
| EPL (Estimated % lysis) | Predicted lysis before 30 min | <15% | Early fibrinolysis estimation | - |
Second Classic TEG Diagram (Morgan & Mikhail's)
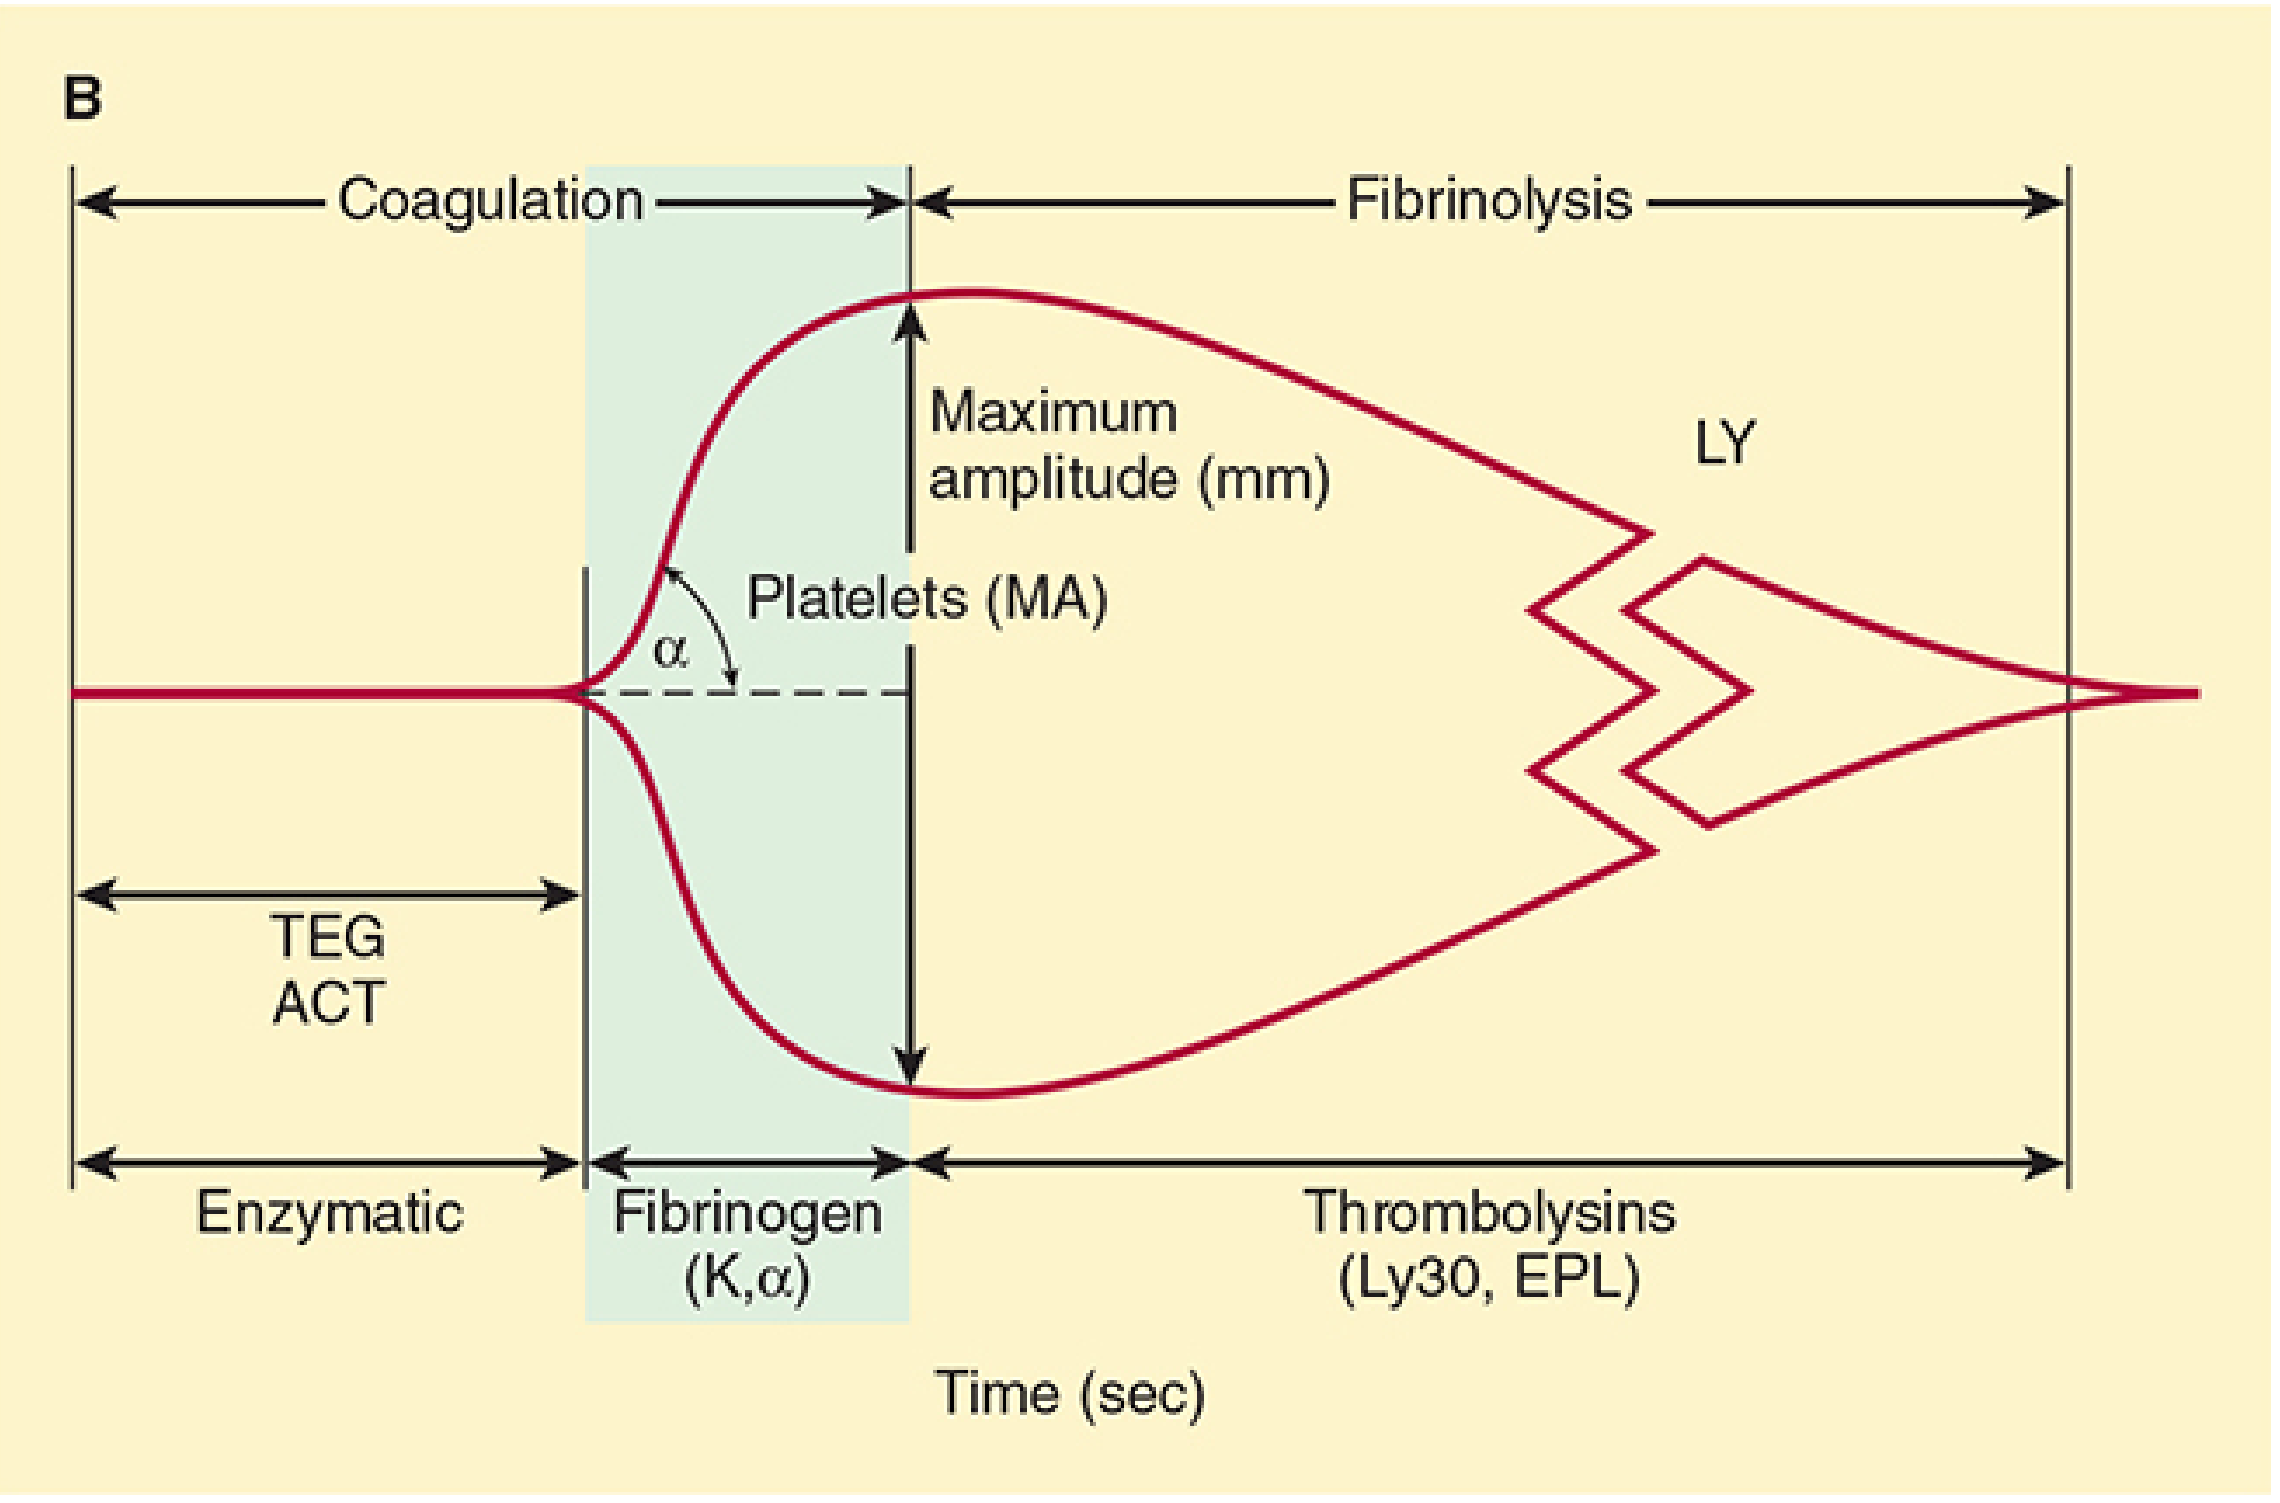
Figure 39-5: TEG showing the enzymatic stage (ACT/R), fibrinogen/platelet stage (K, α, MA), and fibrinolysis stage (Ly30, EPL). Source: Morgan & Mikhail's Clinical Anaesthesiology, 7e, p. 1543
Flowchart: TEG-Guided Transfusion Algorithm
                    BLEEDING PATIENT
                          |
                    Obtain TEG sample
                          |
            ┌─────────────┴──────────────┐
            |                            |
       Rapid TEG                    Standard TEG
     (+ Tissue Factor)            (citrated whole blood)
     Result in 15 min             Result in 30-45 min
            |                            |
            └────────────┬───────────────┘
                         |
               Analyze TEG parameters
                         |
    ┌────────────────────┼─────────────────────┐
    |                    |                      |
  R time prolonged    K↑ / α angle↓         MA decreased
  (>10 min)          Fibrinogen deficiency   (<50 mm)
    |                    |                      |
Give FFP (or PCC)   Cryoprecipitate        Platelet transfusion
10-15 mL/kg         or Fibrinogen           or DDAVP
    |                concentrate             |
    |                    |                      |
    └────────────────────┼─────────────────────┘
                         |
                   LY30 > 7.5% ?
                         |
                   YES ──┴── NO
                    |          |
               Give TXA    No antifibrinolytic
           (Tranexamic acid  therapy needed
            15 mg/kg IV)
                    |
           Reassess TEG after treatment
Abnormal TEG Patterns
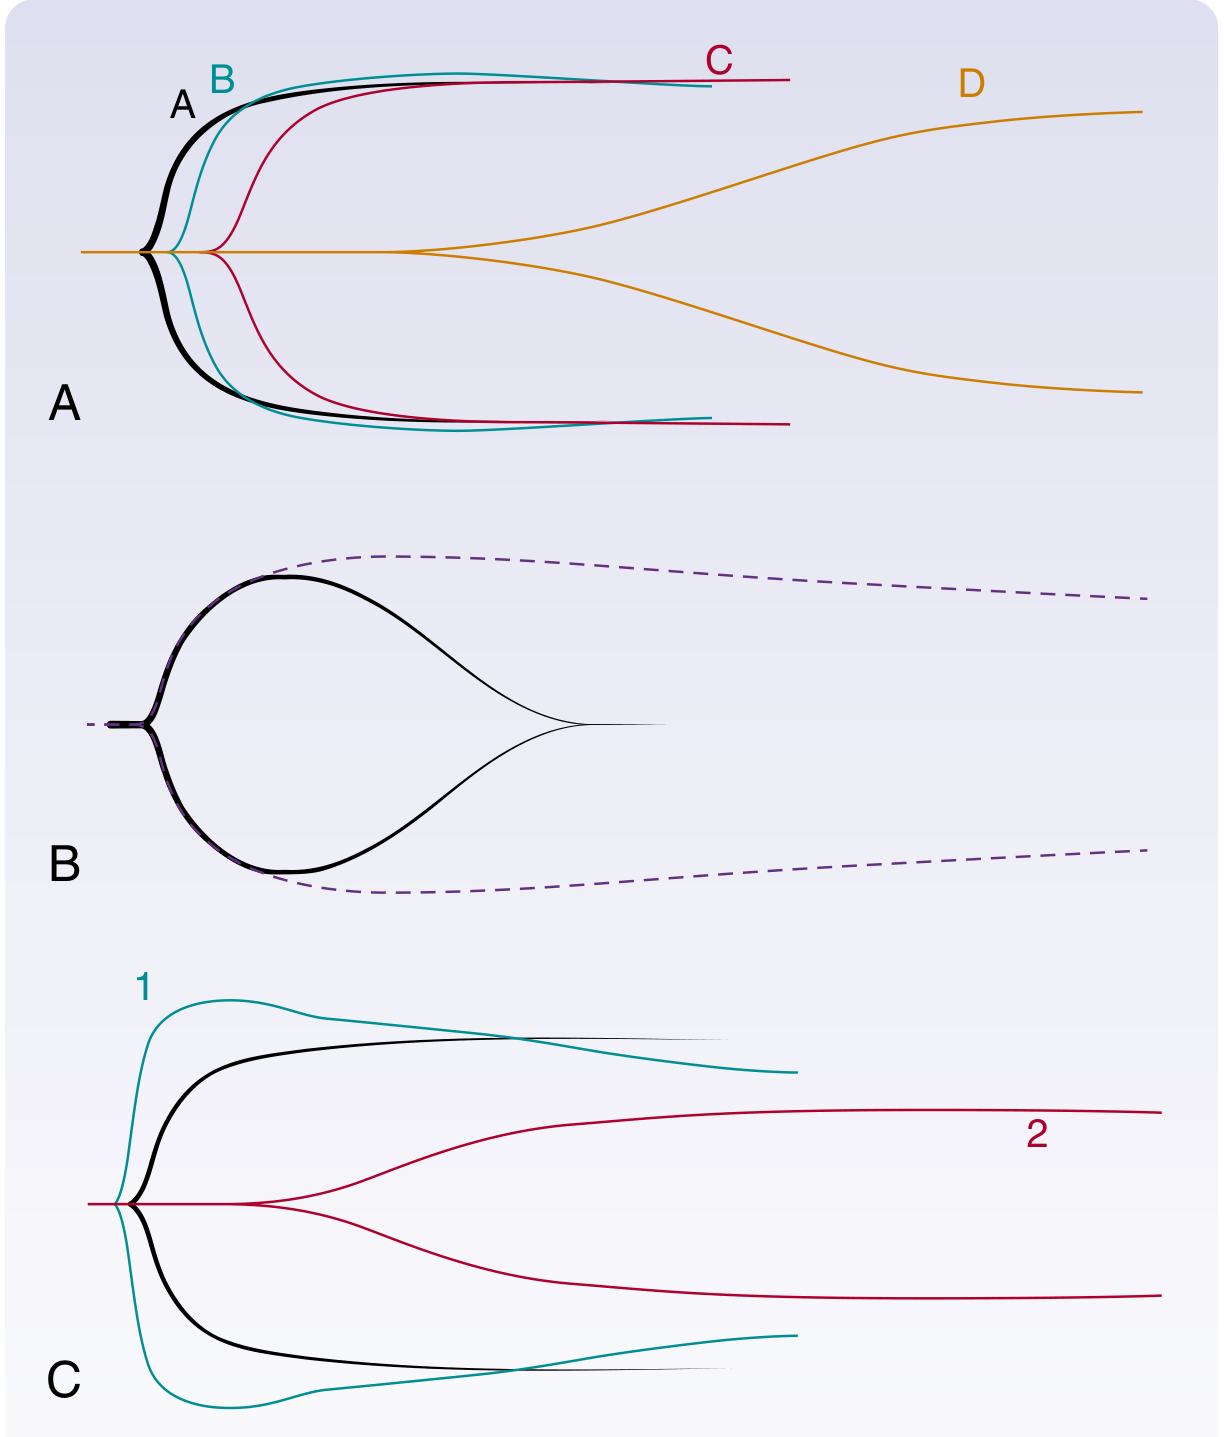
Figure 100.4 (A-C): TEG tracings for coagulation disorders. (A) Hemophilia - progressively prolonged R time as factor level falls. (B) Primary fibrinolysis - closed loop/clot lysis before full MA is reached. (C) DIC - Stage 1 = hypercoagulable (wide MA, narrow R, K); Stage 2 = consumptive = all parameters hypocoagulable. Source: Sabiston Textbook of Surgery, 10e, Fig. 100.4
| Condition | R time | K time | α angle | MA | LY30 |
|---|---|---|---|---|---|
| Normal | 5-10 min | 1-3 min | 53-72° | 50-70 mm | <7.5% |
| Coagulation factor deficiency (Hemophilia) | ↑↑ | ↑ | ↓ | Normal/↓ | Normal |
| Fibrinogen deficiency | Normal/↑ | ↑↑ | ↓↓ | ↓ | Normal |
| Thrombocytopenia / platelet dysfunction | Normal | Normal/↑ | Normal/↓ | ↓↓ | Normal |
| Primary fibrinolysis | Normal | Normal | Normal | ↓ (rapid closure) | ↑↑ |
| Stage 1 DIC (hypercoagulable) | ↓ | ↓ | ↑ | ↑ | ↑ (mild) |
| Stage 2 DIC (consumptive) | ↑↑ | ↑↑ | ↓↓ | ↓↓ | ↑↑ |
| Heparin effect | ↑↑ | ↑ | ↓ | ↓ | Normal |
| Hypercoagulable state (pregnancy at term) | ↓ | ↓ | ↑ | ↑ | ↓ |
TEG vs. ROTEM - Comparison
| Feature | TEG (Haemonetics) | ROTEM (Werfen) |
|---|---|---|
| Cup movement | Cup oscillates; pin is fixed | Cup is fixed; pin oscillates |
| Parameters | R, K, α, MA, LY30, EPL | CT, CFT, α, A10/A5/MCF, LI30 |
| Comparable parameter | R time | CT (clotting time) |
| Comparable parameter | K time | CFT (clot formation time) |
| Comparable parameter | MA | MCF (maximum clot firmness) |
| Comparable parameter | LY30 | LI30 (lysis index at 30 min) |
| Reagents | Kaolin, heparinase, RapidTEG | EXTEM, INTEM, FIBTEM, HEPTEM |
| Geography | Preferred in North America | Preferred in Europe |
| Results interchangeable? | No - values are NOT interchangeable |
Clinical Applications of TEG in Anaesthesia
1. Cardiac Surgery
- Guides anticoagulation monitoring during cardiopulmonary bypass (CPB)
- Detects residual heparin effect after protamine reversal
- Reduces blood product transfusion by targeted therapy
- Differentiates surgical bleeding from coagulopathic bleeding
2. Liver Transplantation
- Major historical application (1985 onward)
- Liver disease = complex coagulopathy (combined deficiency + hyperfibrinolysis)
- TEG guides correction without over-transfusing
- Identifies reperfusion-induced fibrinolysis
3. Trauma / Massive Hemorrhage
- TEG-guided goal-directed resuscitation reduces blood product use
- Identifies trauma-induced coagulopathy (TIC)
- Detects hyperfibrinolysis - guides TXA use
- 2020 EAST guidelines: conditional recommendation for use in bleeding trauma/surgical/ICU patients with suspected coagulopathy
- Replaces empirical 1:1:1 FFP:PLT:PRBC ratio with targeted therapy
4. Obstetric Anaesthesia
- At term, TEG reflects physiological hypercoagulable state (↓R, ↓K, ↑α, ↑MA)
- Guides management of postpartum hemorrhage
- Used in amniotic fluid embolism
5. Neurosurgery / Neurocritical Care
- Guides anticoagulation reversal before emergency procedures
Advantages of TEG Over Conventional Tests
| Advantage | Explanation |
|---|---|
| Whole blood assay | Tests all elements - clotting factors, platelets, fibrin, fibrinolysis |
| Real-time | Results available in 15-30 min (vs. hours for conventional labs) |
| Point-of-care | Bedside testing; no need to send to central lab |
| Functional test | Measures actual clot strength, not just factor levels |
| Guided therapy | Reduces unnecessary blood product transfusion |
| Fibrinolysis detection | Conventional tests cannot reliably detect hyperfibrinolysis |
Limitations:
- Does not assess primary hemostasis (platelet plug formation / vessel wall interaction)
- Not reliable for patients on anticoagulants or antiplatelet agents
- Requires specialized equipment and training
- Results may vary based on sample handling, temperature, activators used
- Not standardized across laboratories
Summary Flowchart: Phases of Coagulation on TEG
Time (min) ──────────────────────────────────────────────────►
               |←R→|← K →|
Amplitude       ╱▔▔▔▔▔▔▔▔▔▔▔▔▔▔▔▔▔▔▔▔▔╲____
(mm)          ╱  ↑α angle            ↑MA   ↘ LY30
            ─/                              \────
           ↑                                ↑
    Enzymatic phase                 Fibrinolysis phase
  (thrombin generation)         (plasmin activity)
  Factor activity → R time

       ←─────────────────────────────────────────→
                CLOT FORMATION PHASE
     R = factors    K/α = fibrinogen    MA = platelets
Key Points for AIIMS Exam
- TEG was first described by Hartert (1948) - became clinically practical in 1980s
- R time = coagulation factors (prolonged → give FFP)
- K time and α angle = fibrinogen (abnormal → give cryoprecipitate)
- MA = platelet function (80% platelet contribution, 20% fibrin) (decreased → platelets/DDAVP)
- LY30 = fibrinolysis (elevated → TXA)
- Rapid TEG adds tissue factor to give results in 15 minutes
- TEG and ROTEM values are NOT interchangeable
- The characteristic "cigar/sausage-shaped" tracing = normal clot formation and lysis
- Primary fibrinolysis on TEG = "closed loop" or "clot lysis" pattern (MA reached then rapid return to baseline)
- In pregnancy: TEG shows hypercoagulable state (↓R, ↓K, ↑α, ↑MA) - begins in first trimester
Sources:
- Sabiston Textbook of Surgery, 10e, Section: Viscoelastic Testing, p. 945-946 and Section: Rotational Thromboelastometry, p. 2232-2233
- Morgan & Mikhail's Clinical Anaesthesiology, 7e, Chapter 39, Fig. 39-5, p. 1542-1543
- Miller's Anesthesia, 10e, Chapter 58, Table 58.4
- Rockwood & Green's Fractures, 10e, Chapter 14, p. 3051-3058
Just from millers, barasch, morgan
Let me pull content specifically from Miller's, Barash, and Morgan & Mikhail in parallel.
Finding Sources
Finding Sources
Finding Sources
Found key file paths. Now reading all three books' detailed TEG sections in parallel, plus fetching the Barash figure.
Reading File
Reading File
Reading File
Excellent! Found the Morgan & Mikhail TEG tracings figure and the Barash TEG vs ROTEM figure. Let me fetch both images and read a few more sections simultaneously.
Loading Image
Loading Image
Reading File
Reading File
I found the Miller's Fig 46.5 with actual TEG tracings. Let me fetch that image and also get the Miller's trauma/cardiac surgery clinical applications content.
Loading Image
Reading File
Reading File
I now have all three books' content plus three excellent textbook figures. Let me get the Barash Figure 53-2 (schematic tracings) and the Morgan clinical applications section.
Finding Sources
Reading File
Reading File
I have comprehensive content from all three books now. Let me compile the complete, well-structured answer.
Thromboelastogram (TEG) - 10 Marks Answer for AIIMS MD Anaesthesia
(Sourced exclusively from Miller's Anesthesia 10e, Barash's Clinical Anesthesia 9e, and Morgan & Mikhail's Clinical Anaesthesiology 7e)
1. Introduction and Historical Background
The thromboelastograph (TEG) was developed by Hartert in 1948 and has undergone a resurgence in popularity due to its unique ability to measure the entire spectrum of clot formation in whole blood - from early fibrin strand generation through clot retraction and fibrinolysis.
"The early thromboelastograph (TEG) developed by Hartert in 1948 has evolved into two independent viscoelastic monitors: the modern TEG (TEG 5000 Hemostasis Analyzer System, Haemnetics) and rotational thromboelastometry (ROTEM, TEM Systems)." - Miller's Anesthesia 10e, Ch. 46
"These tests measure the rate of clot initiation, maximum clot strength, and time to lysis using citrated whole blood samples with the potential for point-of-care testing. As opposed to standard coagulation assays such as PT, aPTT, and INR studies, viscoelasticography provides a more complete assessment of coagulation in vivo, as it assesses the primary and secondary hemostatic pathways in a cell-based format." - Barash's Clinical Anesthesia 9e, Ch. 17
2. Principle and Mechanism
TEG 5000 (Traditional):
- A small 0.35 mL sample of whole blood is placed into a disposable cuvette maintained at 37°C
- The cuvette continuously rotates around an axis of approximately 5 degrees
- A sensor "piston" attached by a torsion wire to an electronic recorder is lowered into the blood
- An activator (most often kaolin or celite) initiates clot formation
- As the fibrin-platelet plug evolves, the piston becomes enmeshed within the clot, transferring rotation of the cuvette to the piston, torsion wire, and electronic recorder
- The mechanical resistance is translated into an electronic waveform subject to quantitative analysis
TEG 6s (Newer generation):
- Measures movement of a meniscus formed by whole blood in a microfluidics chamber
- Using frequencies from 20-500 Hz, the meniscus is vibrated; as a clot forms, clot-strength-specific resonance frequencies are detected by a photodetector and converted into TEG-equivalent units
(Miller's Anesthesia 10e, Ch. 46, p. 6747)
3. The TEG Tracing and Parameters
Diagram 1: Standard TEG Parameters (from Sabiston/Barash framework)
Standard TEG trace showing the four key phases: clot formation (R), clot propagation (α angle), clot strength (MA), and clot lysis (LY30). Source: Sabiston Textbook of Surgery, 10e, Fig. 46.1
Diagram 2: TEG vs ROTEM Parameters Side-by-Side (Barash Fig. 17-5)
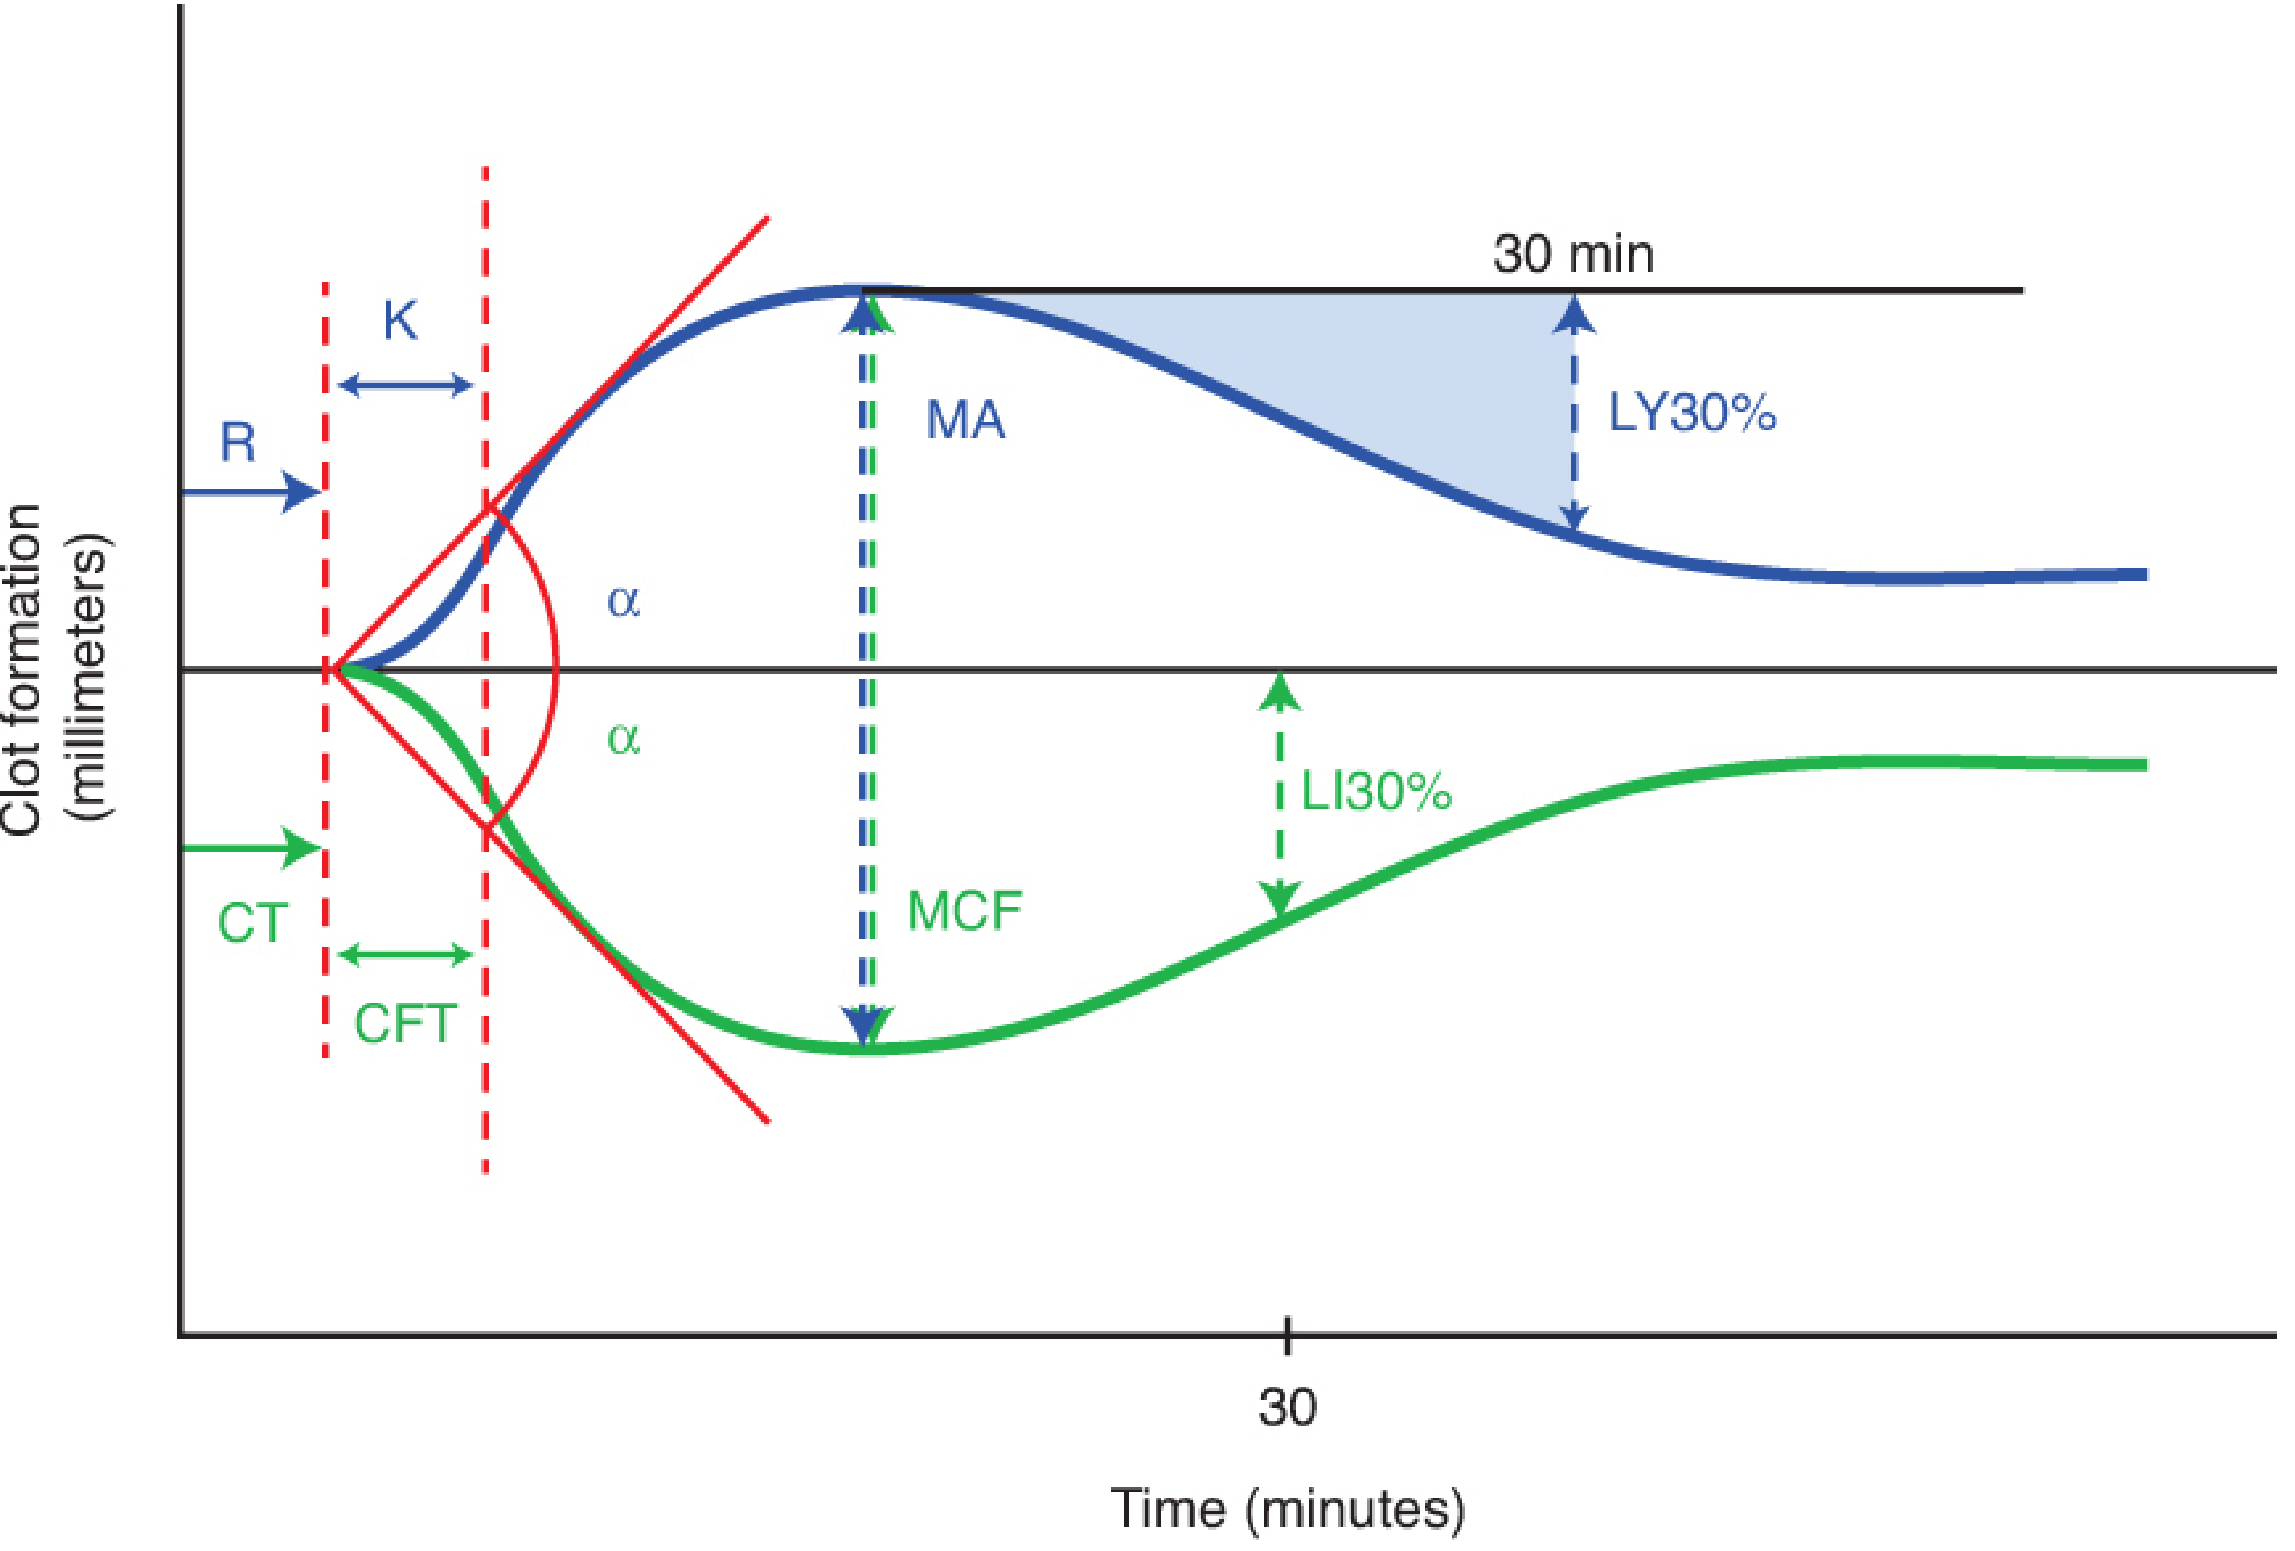
Figure 17-5 from Barash's Clinical Anesthesia 9e: TEG (blue) parameters - R, K, α, MA, LY30%. ROTEM (green) parameters - CT, CFT, α, MCF, LI30%. Note that the ROTEM trace runs as a mirror image below the axis.
TEG Parameters - Normal Values and Meaning
| Parameter | Full Name | Normal Value | What it Measures | Abnormality → Treatment |
|---|---|---|---|---|
| R | Reaction time | 5-10 min | Time to initial clot formation; coagulation factor activity; thrombin generation | R prolonged → FFP / Factor concentrates |
| K | Kinetical time (BiKoatugulierung) | 1-3 min | Time until clot reaches specific viscosity; fibrin cross-linking; fibrinogen level | K prolonged → Cryoprecipitate |
| α angle | Alpha angle | 53-72° | Slope / rate of fibrin polymerization during K time | α decreased → Cryoprecipitate / Fibrinogen concentrate |
| MA | Maximum amplitude | 50-70 mm | Peak clot strength; platelet-fibrin interaction (platelets = 70-80% of MA) | MA decreased → Platelet transfusion / DDAVP |
| LY30 | Lysis at 30 min | 0-8% | % clot breakdown 30 min after MA; fibrinolysis rate | LY30 elevated → Tranexamic acid |
| EPL | Estimated % lysis | 0-15% | Predicted lysis before 30 min | EPL elevated → TXA |
| G | Clot strength (shear elastic modulus) | 4.5K-11.0K d/sc | Mathematical derivation of clot strength from MA | - |
"R value (reaction time) measures time to initial clot formation. Maximum amplitude provides a measure of clot strength and may be decreased by either qualitative or quantitative platelet dysfunction or decreased fibrinogen concentration. The α angle and K values measure rate of clot formation..." - Miller's Anesthesia 10e, Ch. 46
"VHA tracings typically represent four phases of clot kinetics: initiation, propagation, clot strength, and fibrinolysis. Platelets account for 70-80% of the peak resistance curve." - Barash's Clinical Anesthesia 9e, Ch. 53
4. Actual TEG Tracings from Miller's (Fig. 46.5)
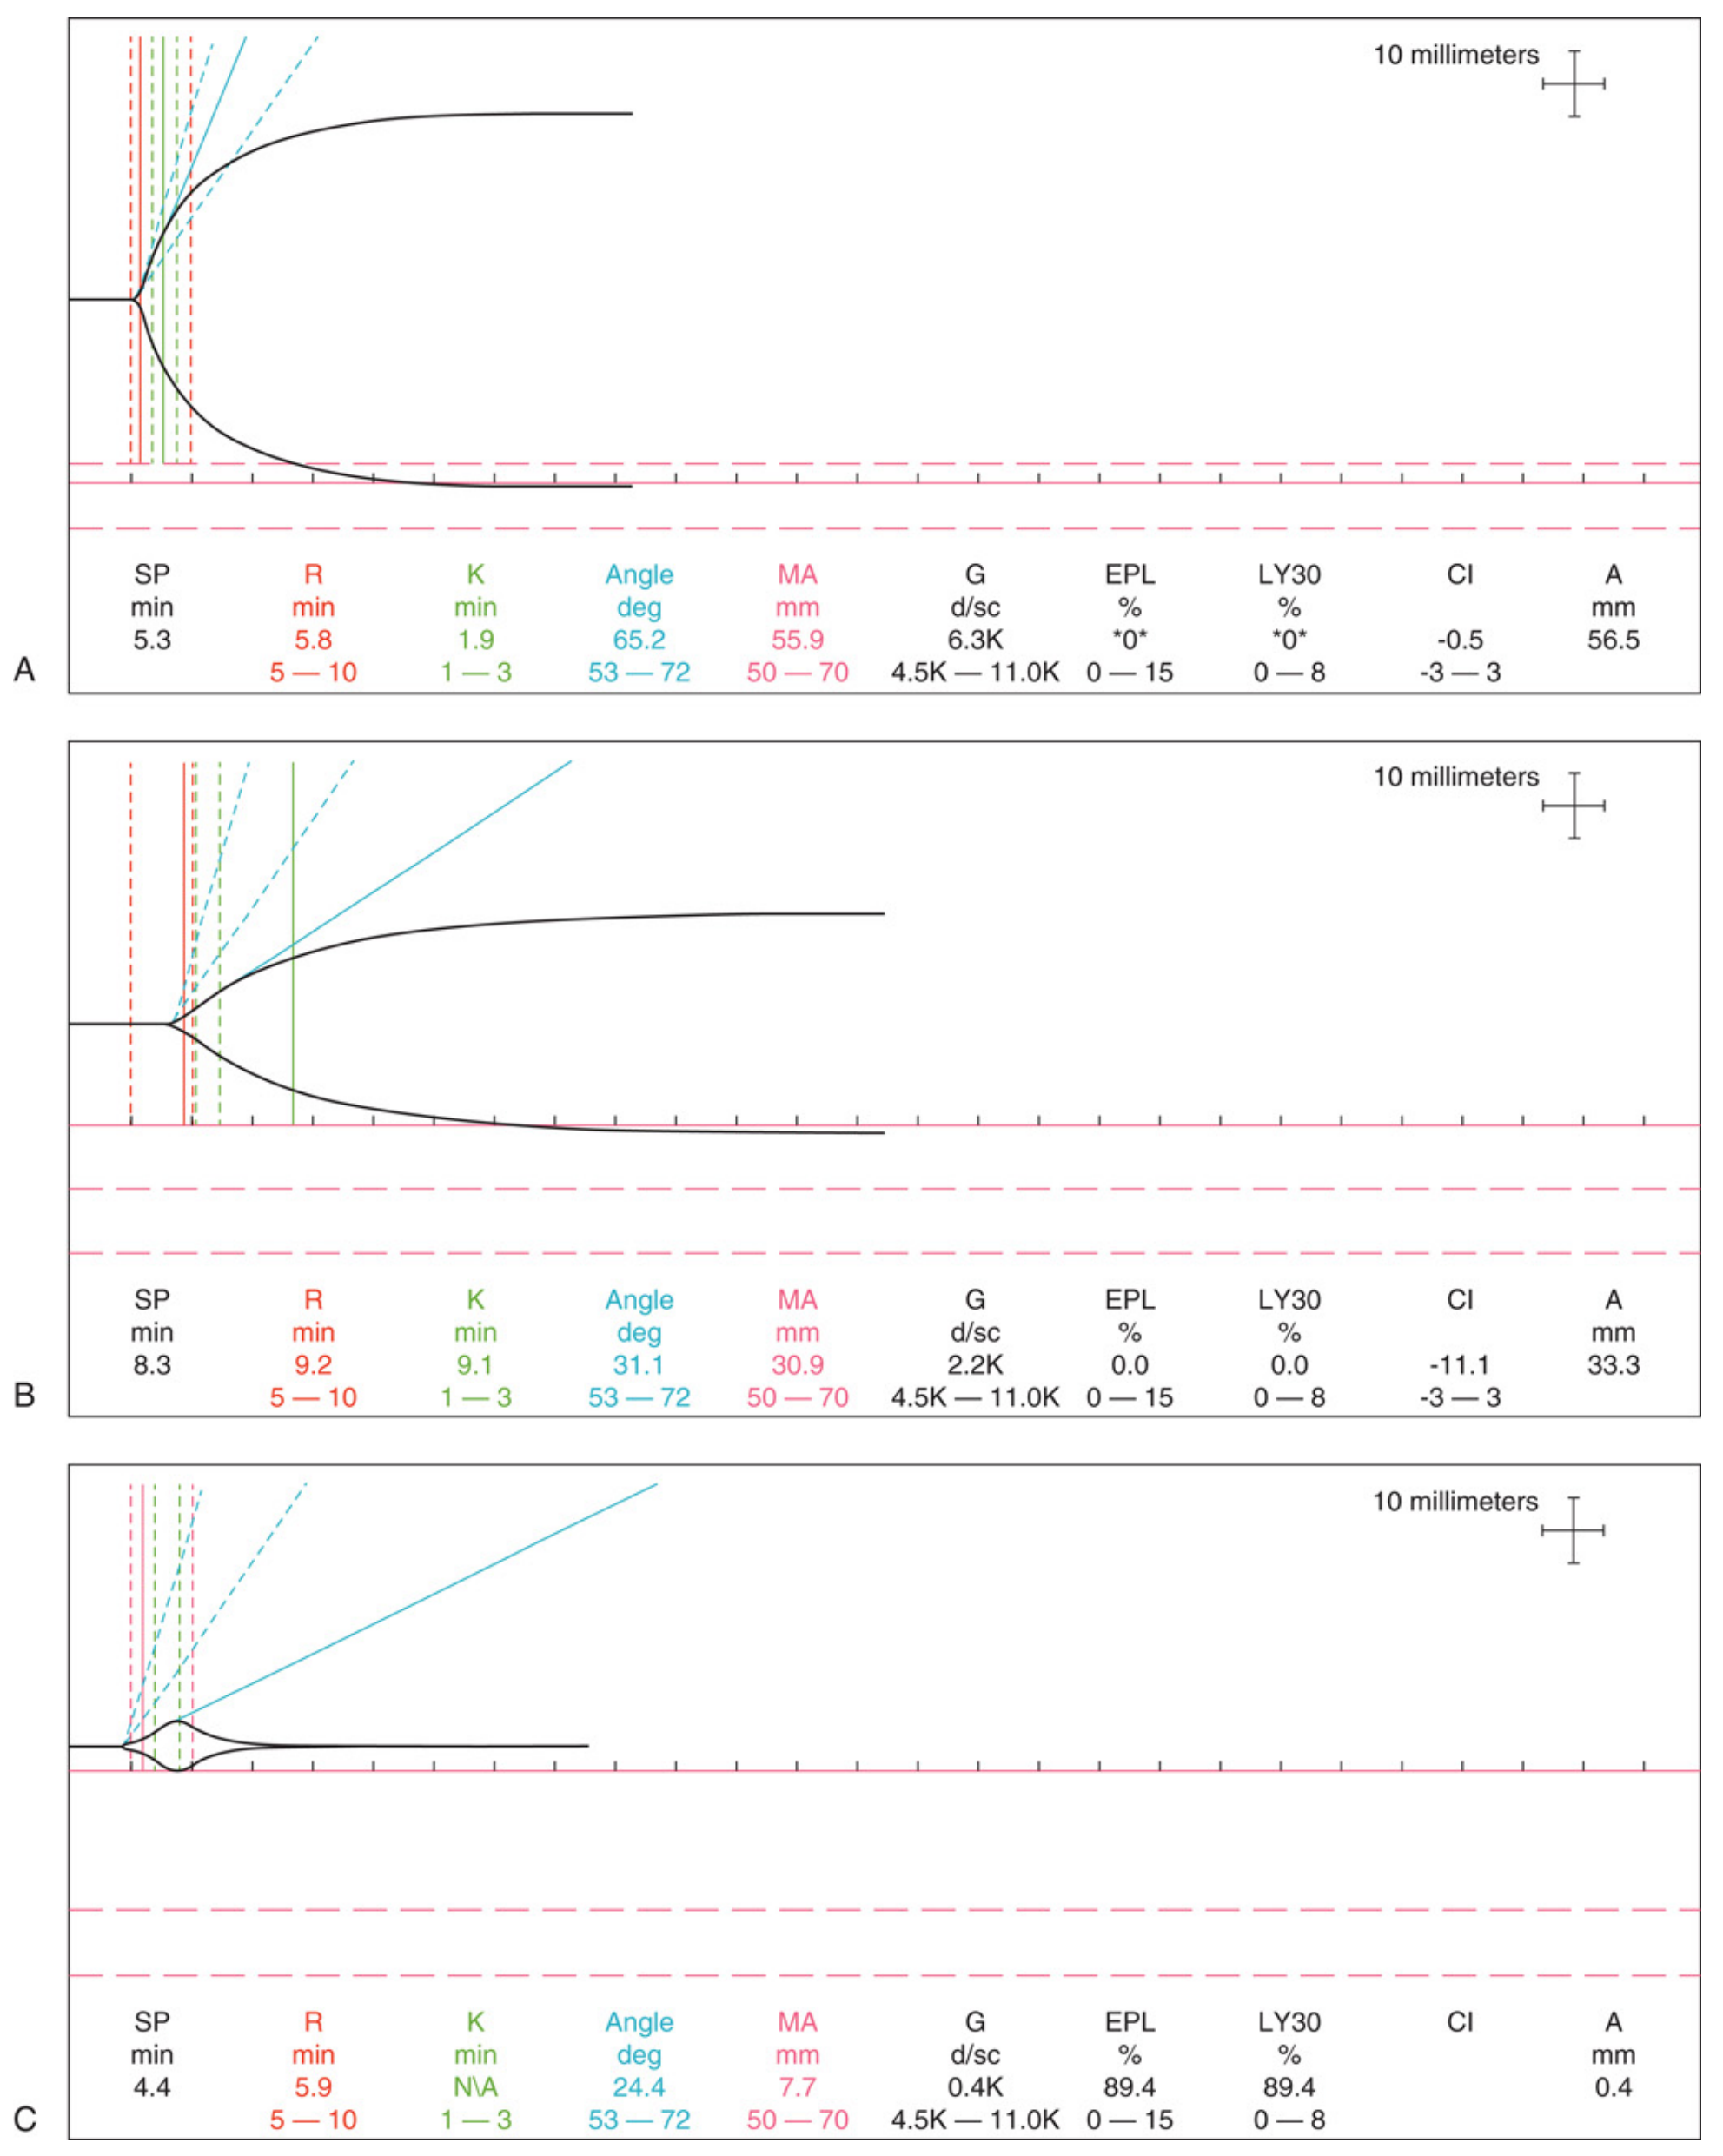
Figure 46.5 from Miller's Anesthesia 10e: Kaolin-activated TEG 5000 tracings. (A) Normal - R=5.8, K=1.9, α=65.2°, MA=55.9mm, LY30=0%. (B) Hypocoagulable - R=9.2, K=9.1, α=31.1°, MA=30.9mm. (C) Fibrinolysis - MA=7.7mm, EPL=89.4%, LY30=89.4%.
5. Typical TEG Patterns in Common Conditions (Morgan & Mikhail Fig. 33-7)
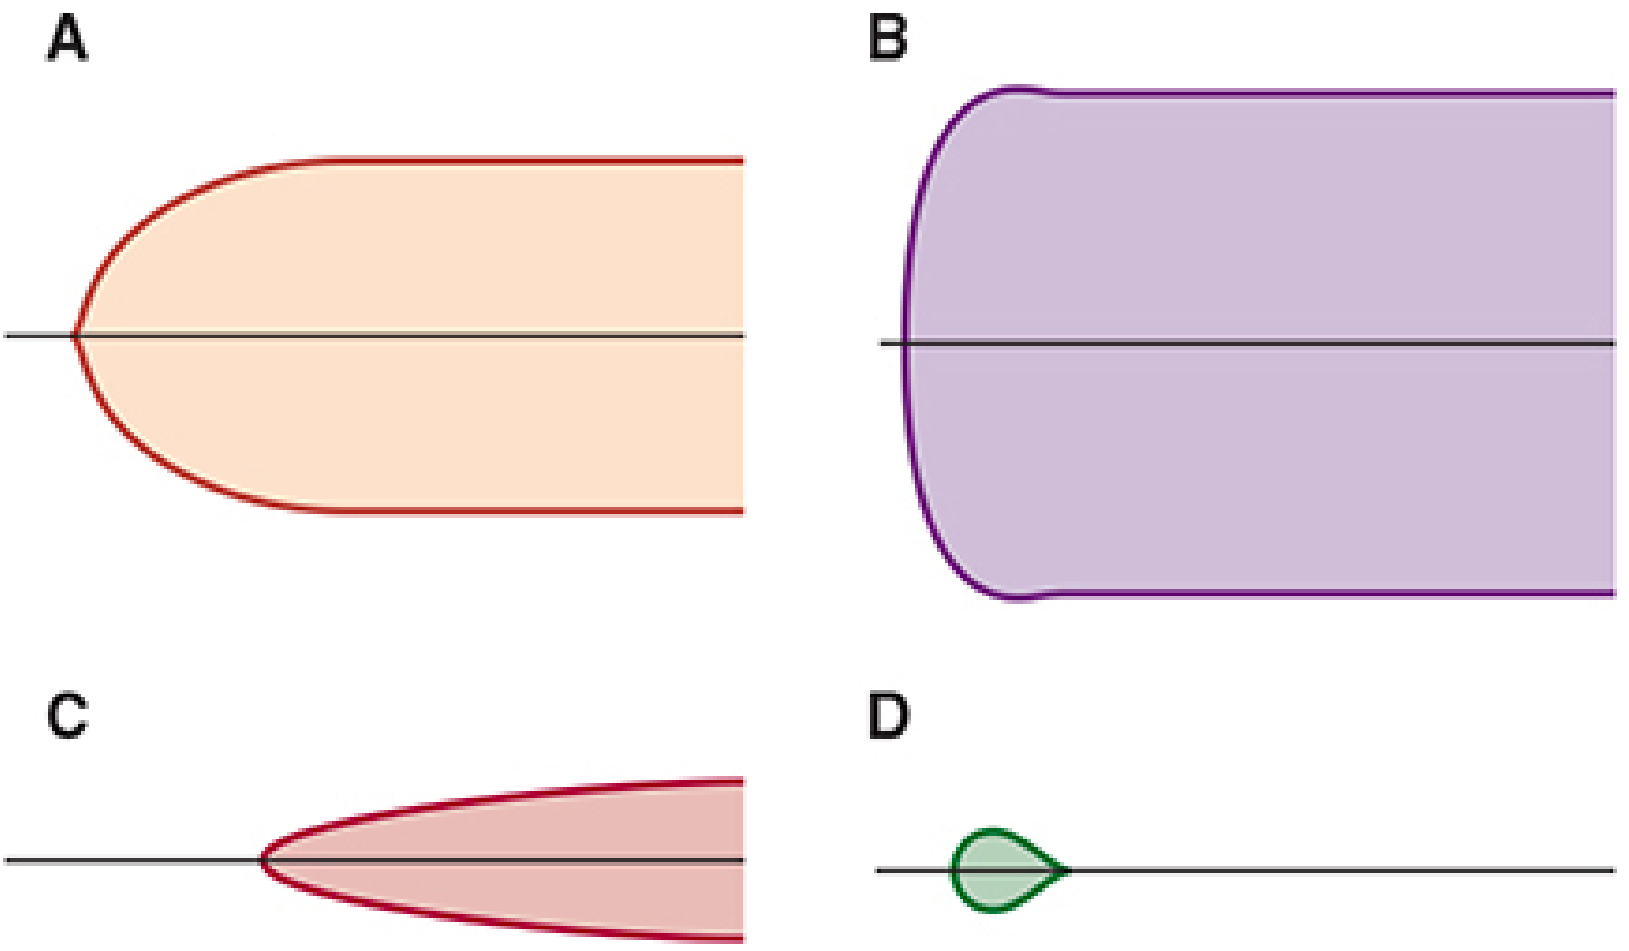
Figure 33-7 from Morgan & Mikhail's Clinical Anaesthesiology 7e: Examples of typical TEG tracings. A: Normal (symmetrical rounded shape). B: Hypercoagulation (wide, flat-ended shape with large MA). C: Hypocoagulation / thrombocytopenia (narrow, pointed shape with small MA). D: Fibrinolysis (small closed loop - clot forms briefly then dissolves).
6. TEG vs ROTEM - Key Differences
| Feature | TEG (Haemonetics) | ROTEM (Werfen) |
|---|---|---|
| Mechanism | Cup oscillates; piston pin is fixed | Cup is fixed; pin oscillates |
| Activator | Kaolin (standard); Tissue factor (Rapid TEG) | EXTEM (TF+PL), INTEM (ellagic acid), FIBTEM, HEPTEM |
| R time equivalent | R time | CT (Clotting Time) |
| K time equivalent | K time | CFT (Clot Formation Time) |
| MA equivalent | MA (Maximum Amplitude) | MCF (Maximum Clot Firmness) |
| LY30 equivalent | LY30 | CLI30 / LI30 |
| Key advantage | Platelet mapping assay | Specific pathway testing via multiple reagent channels |
| Interchangeable? | NO - values are NOT interchangeable between platforms |
"TEG provides results in terms of R = reaction time and K = clot formation kinetics, α-angle = tangential angle to midline, MA = maximum amplitude indicating clot strength, and LY30 = percent lysis at 30 minutes. ROTEM measures similar metrics with different labels including CT = clot time, CFT = clot formation time, MCF = maximum clot formation, and CLI30 = clot lysis index at 30 minutes." - Barash's Clinical Anesthesia 9e, Ch. 17, Fig. 17-5
7. TEG-Guided Transfusion Algorithm - Flowchart
         BLEEDING PATIENT WITH SUSPECTED COAGULOPATHY
                            │
               Obtain TEG (citrated whole blood)
               Add kaolin activator → run at 37°C
               Actionable results in 5-10 minutes
                            │
            ┌───────────────┼──────────────────┐
            │               │                  │
        R > 10 min    K↑ / α < 53°         MA < 50 mm
        (prolonged)   (fibrinogen           (low platelet
            │          deficiency)           function)
            │               │                  │
          Give FFP    Give Cryoprecipitate   Platelet
          10-15 mL/kg  or Fibrinogen          transfusion
          or PCC        concentrate           or DDAVP
                            │
                   LY30 > 8% OR EPL > 15%?
                            │
                    YES ────┴──── NO
                     │             │
             Tranexamic acid    Observe
             (TXA) 15 mg/kg     Monitor
             Aminocaproic acid
                     │
              Reassess TEG after each intervention
(Based on Barash Table 53-3 and Morgan & Mikhail Ch. 33, 39)
8. CCT vs VHA - Comparison Table (Barash Table 53-3)
| Feature | Conventional Coagulation Tests (CCT) | Viscoelastic Hemostatic Assays (VHA / TEG/ROTEM) |
|---|---|---|
| Turnaround time | 15-60 min | 20-40 min (actionable in 5-10 min) |
| Cost | Less | More |
| Sample | Citrated plasma | Whole blood |
| Detect hyperfibrinolysis | No | Yes |
| Detect hypercoagulation | No | Yes |
| Detect Warfarin | Yes | Unreliable |
| Detect DOAC | No | Nonspecific |
| Detect primary hemostasis | No | No |
(Barash's Clinical Anesthesia 9e, Ch. 53, Table 53-3)
9. Clinical Applications in Anaesthesia
Cardiac Surgery
"Many TEG-guided and ROTEM-guided algorithms have been studied and shown to reduce blood product use effectively in cardiac surgery-related hemorrhage." - Miller's Anesthesia 10e, Ch. 46
- Identifies residual heparin effect post-CPB
- Differentiates surgical bleeding from coagulopathic bleeding
- Detects excess fibrinolysis during bypass
- Some centers routinely use TEG to identify causes of bleeding after CPB (Morgan & Mikhail 7e)
Trauma / Massive Hemorrhage
"TEG and ROTEM identify the specific deficiencies, freeing the practitioner from reliance solely on the 1:1:1 transfusion ratio DCR approach. Both TEG and ROTEM assess the rate of clot formation and clot stability, reflecting the interactions between the coagulation cascades, platelets, and the fibrinolytic system." - Morgan & Mikhail 7e, Ch. 39
- Detects trauma-induced coagulopathy (TIC) early
- VHA can identify both hyperfibrinolysis (early TIC) and fibrinolytic shutdown (late TIC)
- CCT cannot reliably identify hyperfibrinolysis; VHA can
- Clot amplitude <35mm at 5 min on ROTEM predicts need for massive transfusion (detection rate 77%)
Liver Disease / Transplantation
"TEG, ROTEM, and Sonoclot are the optimal methods of demonstrating the global state of the coagulation system at a specific moment in time in any patient with liver disease. A patient with an INR of 3, for example, may also have anticoagulant factors so reduced that the patient is in a hypercoagulable state." - Morgan & Mikhail 7e, Ch. 33
- INR only examines the procoagulant side; VHA reveals the full picture
- Detects real-time fibrinolysis during reperfusion
- Prevents over-transfusion in patients with apparent but balanced coagulopathy
Obstetric Anaesthesia
"At term gestation, TEG analysis reflects a hypercoagulable state with decreased time to start of clot formation (R), decreased time to specified clot strength (K), increased rate of clot formation (α), and increased clot strength (MA)." - Miller's Anesthesia 10e, Ch. 58, Table 58.4
- Guides management of PPH
- Physiological pregnancy TEG: ↓R, ↓K, ↑α, ↑MA (changes begin in 1st trimester)
10. Limitations of TEG
- Does not assess primary hemostasis (platelet adhesion, vWF-vessel wall interaction)
- Unreliable for patients on anticoagulants (Warfarin, DOACs) or antiplatelet therapy
- Susceptible to vibration artifacts (addressed in newer cartridge-based devices)
- Requires frequent calibration (1st generation devices)
- Lack of specificity with abnormal findings; qualitative interpretation challenges
- Results not interchangeable between TEG and ROTEM platforms
- ITACTIC trial (cited in Barash 9e): most recent multicenter RCT - no difference in mortality compared to CCT-guided resuscitation (though criticised for low TIC prevalence in study population)
Key Points Summary (Memory Aid: R-K-Alpha-MA-LY)
| Parameter | Abnormality | Defect | Treatment |
|---|---|---|---|
| R ↑ | Prolonged R | Coagulation factors ↓ | FFP / PCC |
| K ↑ / α ↓ | Slow fibrin polymerisation | Fibrinogen ↓ | Cryoprecipitate |
| MA ↓ | Weak clot | Platelet dysfunction/count ↓ | Platelets / DDAVP |
| LY30 ↑ | Early lysis | Hyperfibrinolysis | TXA / Aminocaproic acid |
References:
- Miller's Anesthesia, 10e - Ch. 46 (Viscoelastic Measures of Coagulation, p. 6747-6751), Ch. 58 (Table 58.4), Ch. 66 (Trauma)
- Barash, Cullen & Stoelting's Clinical Anesthesia, 9e - Ch. 17 (Viscoelastic Testing, p. 1278), Ch. 53 (VHA in Trauma, p. 4522-4524, Table 53-3)
- Morgan & Mikhail's Clinical Anaesthesiology, 7e - Ch. 33 (Point-of-Care Viscoelastic Coagulation Monitoring, Fig. 33-7), Ch. 39 (TEG in Trauma, Fig. 39-5)
This is a shared conversation. Sign in to Orris to start your own chat.