
How to interpret the ecg
Reading File
ECG interpretation follows a systematic approach: check rate, rhythm, axis, P waves, PR interval, QRS complex, ST segment, and T waves. Each component gives clues about different cardiac conditions.
Searching sources...
Finding Sources
Finding Sources
Reading File
Finding Sources
Reading File
Finding Sources
Reading File
Reading File
Reading File
Reading File
Now I have enough comprehensive information to give a thorough, well-structured answer. Let me fetch the key ECG diagram image to include visually.
Loading Image
Loading Image
Here is a complete, systematic guide to ECG interpretation, sourced from Harrison's Principles of Internal Medicine 22E and Goldman-Cecil Medicine.
How to Interpret an ECG
The Cardiac Conduction System (foundation)
Before reading an ECG, understand what generates the waveforms:
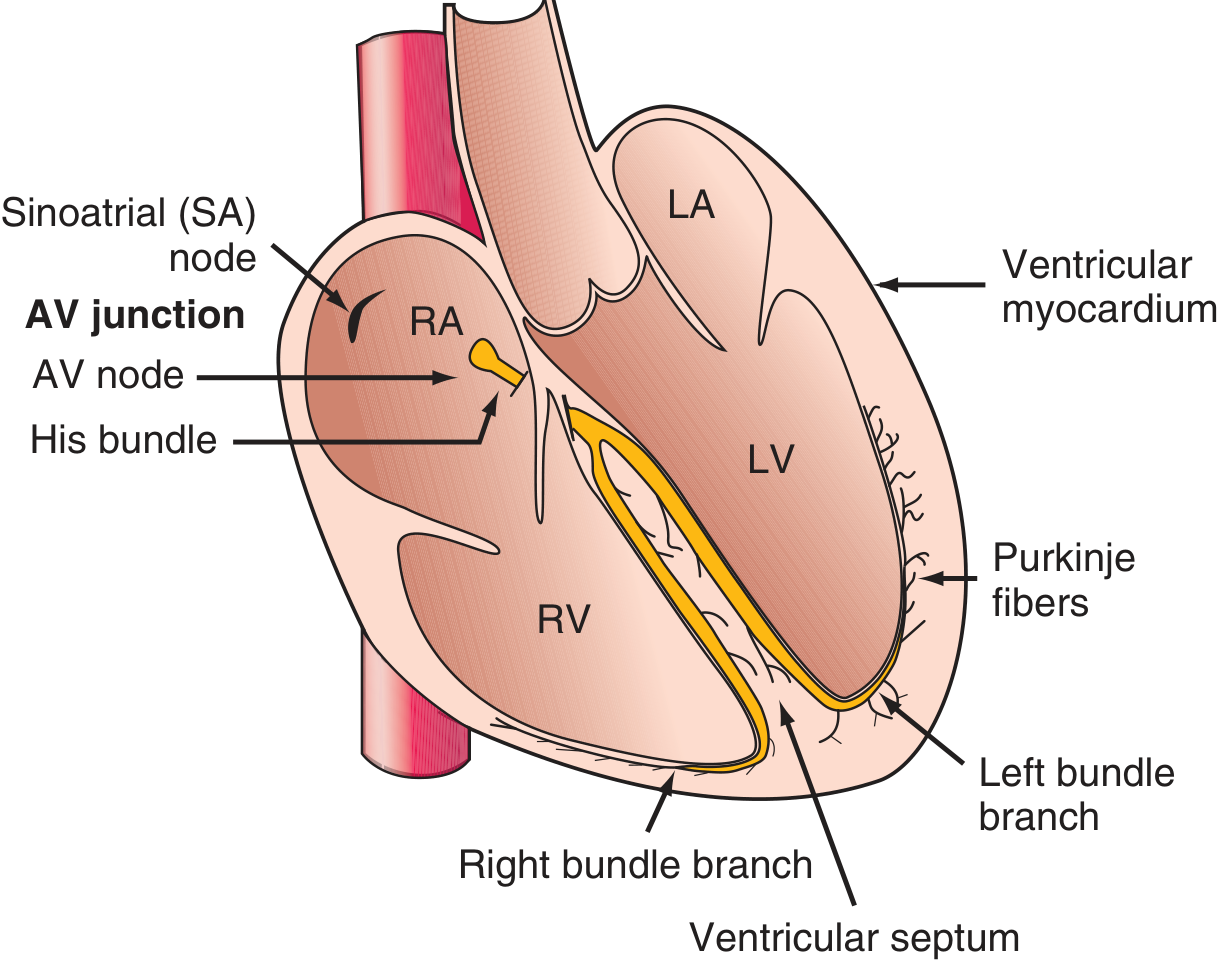
The SA node fires spontaneously, depolarizes the atria, then passes through the AV node (where there is a physiologic delay), then down the His bundle, right and left bundle branches, and Purkinje fibers into the ventricular myocardium. Each of these steps inscribes a specific part of the ECG trace.
The ECG Waveforms
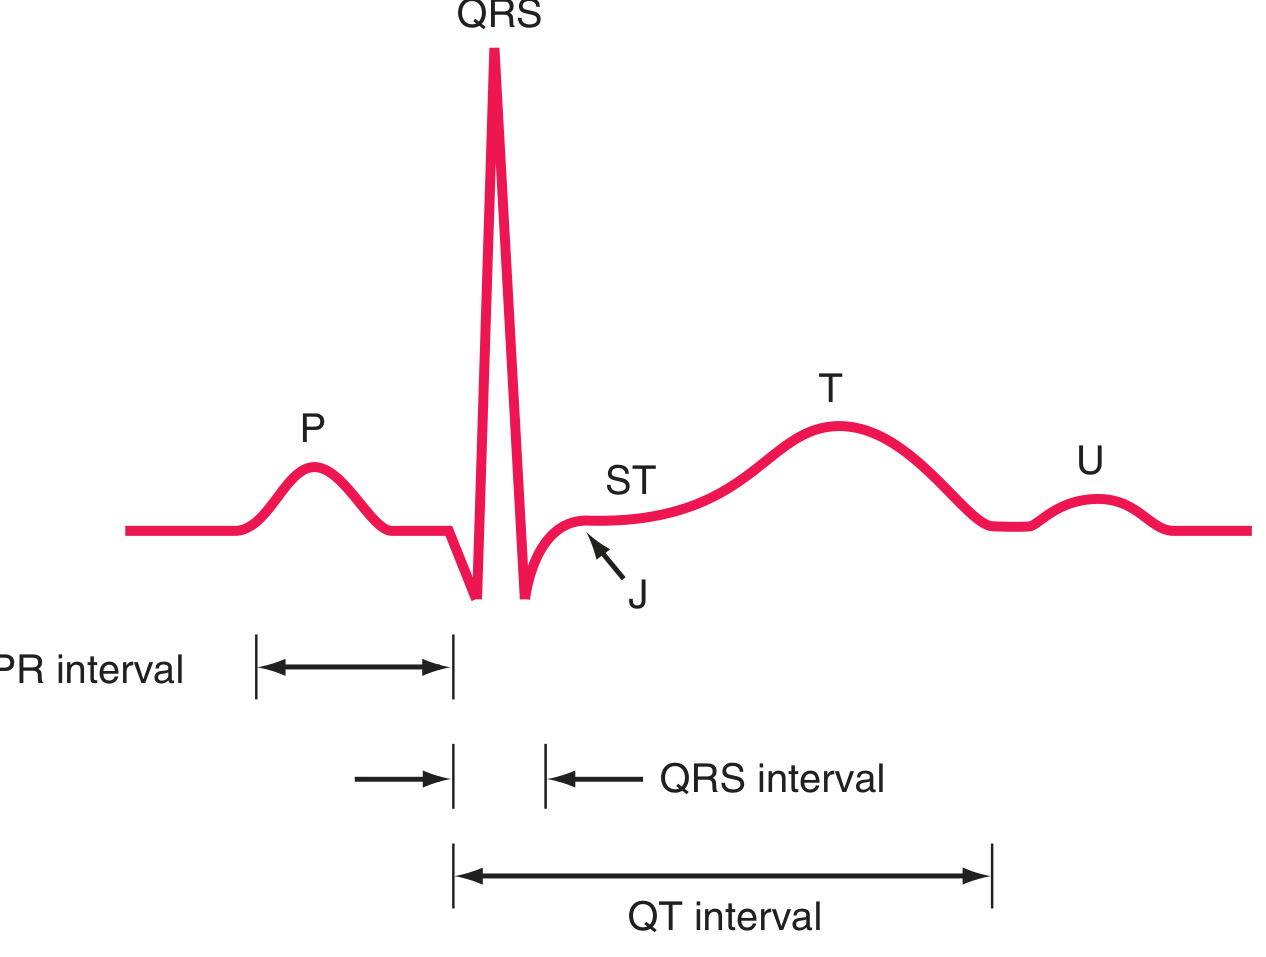
| Waveform | What it represents |
|---|---|
| P wave | Atrial depolarization (contraction) |
| PR interval | Conduction from SA node through AV node to ventricles |
| QRS complex | Ventricular depolarization |
| J point | Junction between end of QRS and start of ST segment |
| ST segment | Isoelectric plateau phase of ventricular action potential |
| T wave | Ventricular repolarization |
| U wave | Afterpotentials (often hypokalemia-related when prominent) |
| QT interval | Total ventricular depolarization + repolarization time |
Systematic Approach - 14 Parameters (Harrison's)
According to Harrison's Principles of Internal Medicine 22E, every ECG should be analyzed in this order:
1. Standardization and Technical Features
- Standard calibration: 1 mV = 10 mm (2 large squares vertically)
- Paper speed: 25 mm/s - 1 small box = 40 ms; 1 large box = 200 ms
- Check for lead placement errors and artifact
2. Rhythm
- Is it regular or irregular?
- Is there a P wave before every QRS and a QRS after every P?
- Normal sinus rhythm: P wave in lead II positive, rate 60-100 bpm
3. Heart Rate
Two quick methods:
- Large box method: 300 ÷ number of large boxes between R waves (e.g., 2 boxes = 150, 3 = 100, 4 = 75, 5 = 60)
- Small box method: 1500 ÷ number of small boxes between R waves
- Normal: 60-100 bpm; Bradycardia: <60; Tachycardia: >100
4. PR Interval
- Normal: 120-200 ms (3-5 small boxes)
- Short PR (<120 ms): pre-excitation (WPW), AV junctional rhythm
- Long PR (>200 ms): 1st degree AV block
- Progressively lengthening PR until dropped QRS: 2nd degree AV block (Mobitz I/Wenckebach)
- Fixed PR with randomly dropped QRS: 2nd degree AV block (Mobitz II)
- No relationship between P and QRS: 3rd degree (complete) AV block
5. QRS Interval (Duration)
- Normal: ≤100-110 ms (≤2.5 small boxes)
- Wide QRS (>120 ms): bundle branch block, ventricular rhythm, hyperkalemia, drug toxicity (e.g., flecainide, TCAs)
6. QT/QTc Interval
- Varies with heart rate - always correct for rate (QTc)
- Framingham formula: QTc = QT + 0.154 × (1000 - RR) [in ms]
- Upper normal limits: ≤460 ms in women, ≤450 ms in men
- Prolonged QT: hypokalemia, hypomagnesemia, hypocalcemia, drugs (amiodarone, quinidine, antipsychotics), congenital long QT syndrome - risk of torsades de pointes
7. Mean QRS Electrical Axis
- Normal axis: -30° to +90°
- Left axis deviation (LAD) < -30°: left anterior fascicular block, inferior MI, LVH
- Right axis deviation (RAD) > +90°: right ventricular hypertrophy, left posterior fascicular block, PE, lateral MI
- Quick method: If lead I is positive and aVF is positive = normal axis. If lead I positive and aVF negative = LAD. If lead I negative and aVF positive = RAD.
8. P Waves
- Normal: <120 ms wide, <2.5 mm tall, upright in leads I, II, V4-V6, inverted in aVR
- Tall peaked P in II (P pulmonale, >2.5 mm): right atrial enlargement
- Broad notched P in II (P mitrale, >120 ms): left atrial enlargement
- Absent P waves: atrial fibrillation, flutter, junctional rhythm
9. QRS Voltages
- LVH criteria (Sokolow-Lyon): S in V1 + R in V5 or V6 >35 mm; or R in aVL >11 mm
- Low voltage (<5 mm in all limb leads): pericardial effusion, cardiac tamponade, obesity, emphysema, hypothyroidism
10. Precordial R-Wave Progression
- R wave should grow from V1 to V5 (small in V1, tall in V5-V6)
- Poor R-wave progression (dominant S to V4 or beyond): anterior MI, LBBB, RVH
- Transition zone (R = S) normally at V3 or V4
11. Abnormal Q Waves
- Pathological Q wave: >40 ms wide OR >25% of the R wave height in the same lead
- Location indicates territory of infarction:
- Q in II, III, aVF = inferior MI (RCA territory)
- Q in V1-V4 = anterior MI (LAD territory)
- Q in I, aVL, V5-V6 = lateral MI (LCx territory)
12. ST Segments
- Should be at baseline (isoelectric)
- ST elevation: acute STEMI, pericarditis (diffuse saddle-shaped), Prinzmetal angina, early repolarization, LV aneurysm
- ST depression: subendocardial ischemia/NSTEMI, posterior MI (V1-V2), LVH strain pattern, digoxin effect
- The J point separates QRS from ST - ST is measured 60-80 ms after J point
13. T Waves
- Should be upright in I, II, V3-V6; inverted in aVR, V1
- Hyperacute T waves (tall, symmetrical): earliest sign of STEMI
- Deep symmetrical T inversions: myocardial ischemia, Wellens sign (critical LAD stenosis when in V1-V4)
- Peaked narrow T waves: hyperkalemia
- Flat/inverted T: ischemia, LVH, bundle branch block, electrolyte abnormalities
14. U Waves
- Small positive deflections after T wave, best seen in V2-V3
- Prominent U waves: hypokalemia, bradycardia, class IA antiarrhythmics
- Negative U waves: ischemia, hypertension, LVH
The 12 Leads at a Glance
| Lead Group | Leads | View of Heart |
|---|---|---|
| Inferior | II, III, aVF | Inferior wall (RCA) |
| Lateral | I, aVL, V5, V6 | Lateral wall (LCx) |
| Anterior | V1-V4 | Anterior wall (LAD) |
| Septal | V1, V2 | Interventricular septum |
| Right | V1, V3R-V6R | Right ventricle |
Common Patterns and Their Meaning
| ECG Finding | Think of |
|---|---|
| Delta wave + short PR | WPW syndrome |
| Wide QRS + RBBB pattern (RSR' in V1) | Right bundle branch block |
| Wide QRS + LBBB pattern (broad notched R in I, V6) | Left bundle branch block |
| Irregularly irregular rhythm, no P waves | Atrial fibrillation |
| Sawtooth baseline at 300 bpm, 2:1 or 4:1 block | Atrial flutter |
| ST elevation + reciprocal ST depression | Acute STEMI |
| Alternating QRS height (electrical alternans) | Pericardial effusion/tamponade |
| Peaked T waves progressing to wide QRS, no P waves | Severe hyperkalemia |
| Prolonged QT + polymorphic VT | Torsades de pointes |
Summary Mnemonic: "R-RATE-P-PR-QRS-QT-AXIS-ST-T"
- R - Rhythm (regular/irregular, P before QRS?)
- Rate - Calculate bpm
- P - P wave morphology
- PR - PR interval (120-200 ms)
- QRS - Duration (<110 ms), axis, voltages, Q waves, R progression
- QT - Rate-corrected QTc (<450 ms men, <460 ms women)
- ST - Elevation or depression
- T - T wave morphology
- U - U waves
Sources: Harrison's Principles of Internal Medicine 22E (2025), p. 1912-1916 | Goldman-Cecil Medicine, Chapter 42
This is a shared conversation. Sign in to Orris to start your own chat.