
How to read CXR
CXR pleural effusion pneumothorax consolidation comparison
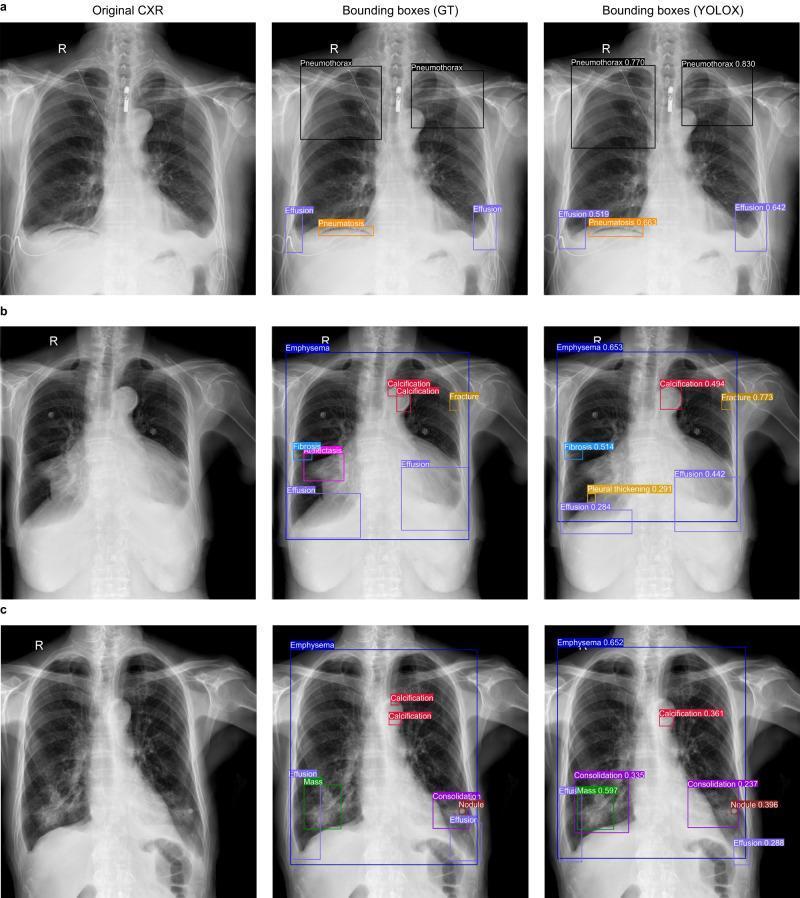
A multi-panel diagnostic image comparison displaying three clinical cases (a, b, c) of posterior-anterior (PA) chest X-rays (CXRs). The image is organized into three columns for each case: 'Original CXR', 'Bounding boxes (GT)' representing the ground truth expert annotations, and 'Bounding boxes (YOLOX)' showing deep learning model predictions with confidence scores. Case (a) demonstrates bilateral apical pneumothorax and basilar pleural effusions. Case (b) illustrates complex pathology including emphysema, aortic arch calcification, a rib fracture, fibrosis, and pleural thickening. Case (c) shows a large pulmonary mass/consolidation in the right lower lobe, emphysema, and calcification. The color-coded bounding boxes categorize 14 different chest abnormalities, including effusion, pneumothorax, consolidation, and mass. This comparison serves as an educational tool for artificial intelligence in radiology, highlighting the model's ability to localize and identify multi-focal pathology while also demonstrating discrepancies such as missed small calcifications or additional diagnoses not in the ground truth.
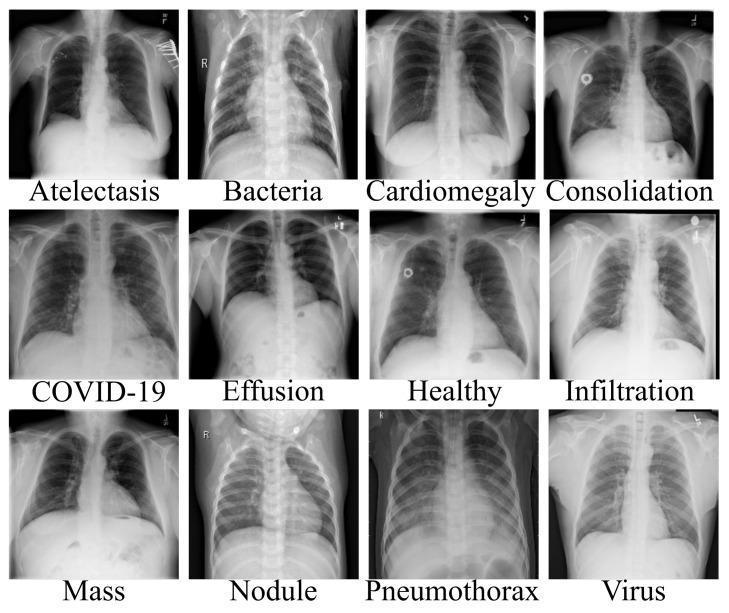
This diagnostic image is a comparison chart consisting of a 3x4 grid of posteroanterior (PA) chest x-ray (CXR) radiographs, each labeled with a specific clinical finding or diagnosis. The collection serves as a visual guide for thoracic pathology in adult and pediatric patients. Conditions depicted include Atelectasis (linear opacities), Bacterial Pneumonia (localized consolidation), Cardiomegaly (enlarged cardiac silhouette), and Consolidation. The second row demonstrates COVID-19 (bilateral patchy opacities), Pleural Effusion (blunting of the costophrenic angle), a Healthy chest for baseline comparison, and Infiltration. The final row shows Mass, Nodule (small focal opacity), Pneumothorax (characterized by hyperlucency, absence of lung markings, and a visible pleural line indicating lung collapse), and Viral Pneumonia (diffuse, interstitial infiltrates). The educational focus is on differentiating between normal pulmonary anatomy and various respiratory pathologies based on radiodensity, distribution of opacities, and anatomical distortion, making it a valuable tool for radiology training and computer-aided diagnosis (CAD) classification tasks.
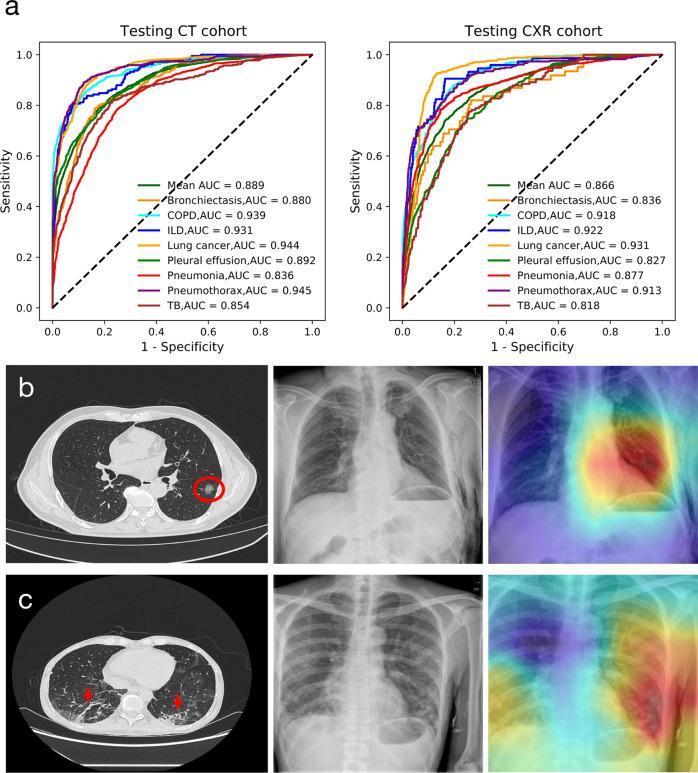
This composite image evaluates AI performance in respiratory disease diagnosis using CT scans and Chest X-rays (CXR). Section (a) presents two ROC curves comparing diagnostic accuracy for eight conditions: bronchiectasis, COPD, ILD, lung cancer, pleural effusion, pneumonia, pneumothorax, and tuberculosis. The CT cohort shows a slightly higher mean AUC (0.889) compared to the CXR cohort (0.866). Section (b) demonstrates a case of lung cancer. The axial CT slice shows a hyperdense pulmonary nodule in the right lung (highlighted with a red circle), while the corresponding CXR and AI heatmap show the system's ability to localize the lesion. Section (c) illustrates pneumonia; the axial CT scan displays bilateral patchy infiltrates and ground-glass opacities (indicated by red arrows) in the lower lobes. The accompanying CXR and heatmap visualize the infectious consolidation. This comparison highlights the superior sensitivity of CT for detecting subtle lesions, such as early-stage lung cancer and localized infectious shadows, compared to standard radiography, and demonstrates the utility of AI heatmaps in clinical localization.
How to Read a Chest X-Ray (CXR)
Step 0 - Before You Start
- Patient ID, age, sex, date - never read an anonymous film
- Projection: PA (posteroanterior, gold standard) vs AP (portable, less reliable for heart size) vs Lateral
- Old films available? - comparison is often more informative than a single film
- Clinical context: symptoms, duration, relevant history
Step 1 - Technical Quality (RIP)
| Check | How to assess | What it means if abnormal |
|---|---|---|
| Rotation | Distance from spinous processes to medial clavicular heads should be equal bilaterally (allow 2-3 mm difference) | Falsely shifts mediastinum, distorts heart borders |
| Inspiration | Count posterior ribs joining the spine - need at least 9 ribs visible | Poor inspiration causes false "fluffy" opacities mimicking CHF/infiltrates |
| Penetration | Intervertebral spaces should disappear within the cardiac shadow, not be visible below the diaphragm | Underpenetration = too white; Overpenetration = lungs appear black, burns out lung detail |
If technical quality is significantly compromised, insert a disclaimer or request a repeat film.
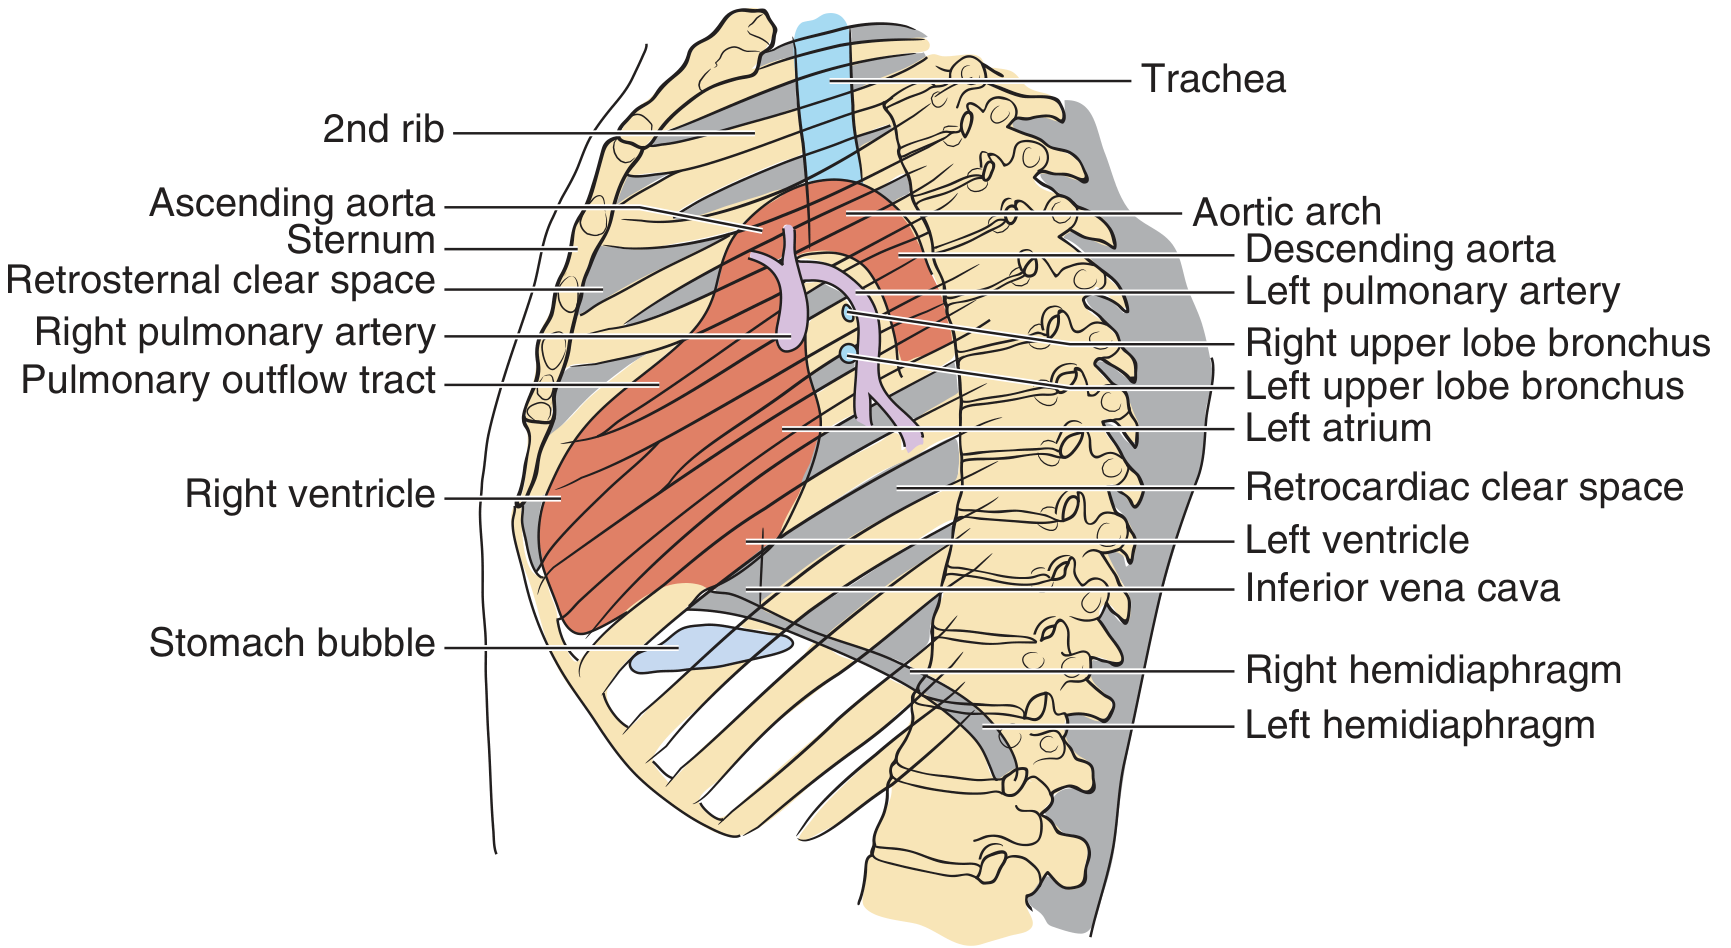
Step 2 - Lateral View
Step 3 - Bones and Soft Tissues
- Rib fractures, lytic lesions, compression fractures, scoliosis
- Soft tissue masses, subcutaneous emphysema, breast shadows (can mimic opacities)
- Shoulder joints, clavicles, scapulae
Step 4 - Mediastinum
- Width: should be <8 cm in adults. A widened mediastinum (>8 cm, or >25% of thoracic diameter at carina level) suggests: aortic dissection, pericardial tamponade, lymphoma, thymic/thyroid tumor, germ cell teratoma
- Trachea: midline - deviation suggests tension pneumothorax, large effusion, or mass
- Check the aortic knob, paratracheal region, and carina angle
Step 5 - Cardiac Silhouette
- Cardiothoracic ratio (CTR): cardiac transverse diameter ÷ thoracic diameter at the same level. Normal = <50% on PA view (AP views overestimate heart size)
- Left ventricular enlargement on lateral: cardiac shadow extends >2 cm posterior to the inferior vena cava shadow
- An extra hump on the left cardiac border = enlarged pulmonary artery segment
- Pneumopericardium = black line encircling the heart
- Note: COPD patients may have a narrow heart due to hyperinflation - this is not pathological
Step 6 - Diaphragms
- Right hemidiaphragm is normally 2-20 mm higher than the left (liver below)
- Air under the diaphragm = surgical emergency until proven otherwise (bowel perforation)
- Elevated diaphragm causes: atelectasis, phrenic nerve palsy, effusion, lobectomy, subphrenic abscess
Step 7 - Lungs (Three Sub-checks)
7A - Hila
- Normally the left hilum is higher than the right (in ~70% of people); right never normally higher than left
- Hilar enlargement = serious: lymphoma, sarcoid, malignancy, TB, infection
- Unilateral hilar enlargement is more concerning than bilateral
7B - Lung Parenchyma
- Do a rapid "ping-pong" comparison of left vs right lung fields - obvious asymmetry flags pathology
- Key patterns to recognize:
| Finding | CXR Appearance | Common Causes |
|---|---|---|
| Consolidation | Homogeneous opacity, air bronchogram | Pneumonia, pulmonary edema |
| Atelectasis | Linear/plate-like opacity, volume loss | Post-op, mucus plugging |
| Nodule | 5-30 mm round opacity | Granuloma, malignancy |
| Mass | >30 mm round opacity | Malignancy, abscess |
| Interstitial pattern | Diffuse reticular/nodular markings | ILD, pulmonary fibrosis, sarcoid |
| Cephalization of flow | Upper lobe vessels larger than lower | CHF (hydrostatic pressure redistribution) |
- The silhouette sign: when a lesion erases the border of a normal structure (e.g., right heart border lost = right middle lobe pathology; left heart border lost = lingula pathology; diaphragm border lost = lower lobe pathology)
- Vascular markings normally stop 3-5 mm short of the chest wall
7C - Pleura
- Pneumothorax: absence of lung markings extending to the chest wall + visible visceral pleural line; "no vessels seen out to the bony edge = pneumothorax until proven otherwise"
- Pleural effusion: blunting of the costophrenic angle, meniscus sign, white-out of lung base. Causes: infection, malignancy, cardiac failure, renal failure, pancreatitis, subphrenic abscess, hepatitis
- Chronic effusions can cause loculation and adhesions
Normal Radiograph - Quick Reference Checklist
| Finding | Normal value |
|---|---|
| Rotation | Clavicular heads equidistant from spinous processes |
| Inspiration | ≥9 posterior ribs visible |
| Penetration | Vertebral interspaces disappear within cardiac shadow |
| Mediastinal width | <8 cm |
| Cardiothoracic ratio | <50% (PA view) |
| Left hilum vs right | Left is higher (or equal) |
| Right diaphragm vs left | Right is higher by 2-20 mm |
| Lung vasculature | Stop 3-5 mm from chest wall; taper toward apex |
Pathology Atlas

Normal Anatomy Reference (PA View)
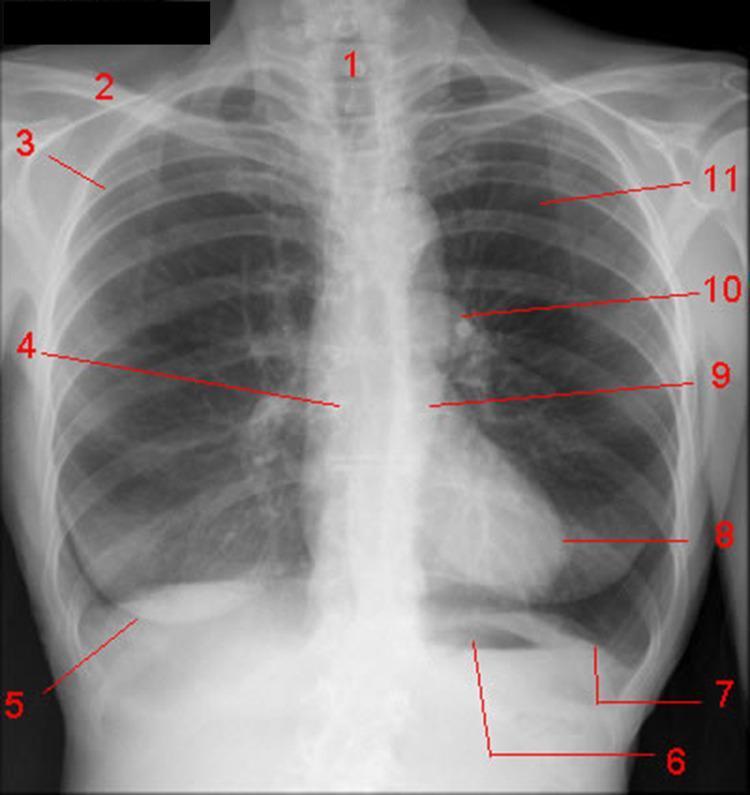
Top 10 "Normal" Tips (from Pfenninger & Fowler)
- Always integrate history and physical - correlation is everything
- Clavicular heads equidistant from spinous processes = no rotation
- At least 9 posterior ribs = adequate inspiration
- Intervertebral spaces invisible below the diaphragm = correct penetration
- Under age 5, a normal thymus can look like a widened mediastinum - don't over-call
- Mediastinum should not exceed 8 cm in adults
- Left hilum is normally higher than the right
- Right hemidiaphragm is normally higher than the left
- Clinical context matters more than exact size of a granuloma
- For lesions >10 mm, consider a second opinion or CT