
Why seeing rdw in cbc what diagnosis can be made
Reading File
RDW (Red cell Distribution Width) reflects variation in red blood cell size (anisocytosis). Normal range is roughly 11.5-14.5%. It's a key parameter in CBC used primarily to differentiate types of anemia and flag mixed deficiencies.
Searching sources...
Finding Sources
Finding Sources
Searching the Web
RDW red cell distribution width CBC clinical significance diagnosis 2024
Good results. Now let me read the key textbook sections and fetch that flowchart image.
Reading File
Reading File
Finding Sources
Reading File
Reading File
Excellent data gathered. Let me now fetch the diagnostic flowchart images from Tintinalli's.
Loading Image
Loading Image
Finding Sources
I now have comprehensive information to provide a thorough answer. Here is the full clinical breakdown:
RDW (Red Cell Distribution Width) in CBC - Clinical Interpretation
What is RDW?
RDW is an automated CBC parameter that quantifies anisocytosis - the degree of variation in red blood cell size. It is calculated as:
RDW-CV = (Standard deviation of MCV ÷ Mean MCV) × 100
- Normal range: 11-14% (some labs report up to 14.5%)
- In morphologic anisocytosis, RDW rises to 15-18%
There are two forms reported by modern cell counters:
- RDW-CV - coefficient of variation (most common, expressed as %)
- RDW-SD - standard deviation of the red cell distribution curve (in femtoliters)
(Harrison's Principles of Internal Medicine 22E, p. 247-248)
The Key Diagnostic Framework: RDW + MCV Together
RDW is most powerful when interpreted alongside MCV (mean corpuscular volume). This combination significantly narrows the differential diagnosis of anemia.
| MCV | RDW | Likely Diagnosis |
|---|---|---|
| Low (microcytic) | High | Iron deficiency anemia |
| Low (microcytic) | Normal | Thalassemia trait, Anemia of chronic disease |
| Normal (normocytic) | High | Early iron/B12/folate deficiency, hemolytic anemia, sickle cell disease, mixed deficiency |
| Normal (normocytic) | Normal | Aplastic anemia, renal failure anemia, anemia of chronic disease |
| High (macrocytic) | High | Vitamin B12 deficiency, folate deficiency, hemolytic anemia |
| High (macrocytic) | Normal | Alcohol abuse, liver disease, hypothyroidism, drug-induced, myelodysplastic syndromes |
(Henry's Clinical Diagnosis and Management by Laboratory Methods, Table 9.1; Tintinalli's Emergency Medicine, Fig. 231-1)
Elevated RDW (>14.5%) - Diagnoses to Consider
1. Iron Deficiency Anemia (IDA)
The most classic cause of high RDW. As iron stores deplete, new RBCs are produced smaller and paler while older normal cells still circulate, creating two populations of cells - one large, one small. RDW is typically markedly elevated.
2. Vitamin B12 or Folate Deficiency (Megaloblastic Anemia)
New macrocytic cells mix with older normal-sized cells. RDW rises alongside MCV. RDW may become elevated before MCV changes - this makes it an early warning sign in nutritional deficiencies.
3. Dimorphic Anemia (Mixed Deficiency)
A large RDW with a normal or near-normal MCV should raise suspicion for a dual deficiency - e.g., combined iron deficiency (lowering MCV) and B12/folate deficiency (raising MCV). The two effects cancel each other on MCV, but RDW is strikingly high. A classic scenario is chronic atrophic gastritis causing both B12 malabsorption and gastric bleeding.
4. Sideroblastic Anemia
Shows a dimorphic blood picture - one population of normal cells and one hypochromic microcytic population. RDW is elevated.
5. Hemolytic Anemia
Active hemolysis causes reticulocytosis; young reticulocytes are larger than mature RBCs, increasing RDW. Seen in autoimmune hemolytic anemia, hereditary spherocytosis, etc.
6. Sickle Cell Disease
Sickled cells, target cells, and reticulocytes all coexist - RDW elevated.
7. Post-Transfusion or Post-Treatment State
After starting iron or B12 therapy, new normal-sized cells appear among old abnormal ones - RDW temporarily increases before normalizing.
8. Clonal Hematopoiesis
An elevated RDW is a known laboratory marker associated with clonal hematopoiesis, which carries increased risk for cardiovascular mortality and hematologic malignancies.
(Robbins, Cotran & Kumar Pathologic Basis of Disease, p. 4018)
Normal RDW - Key Differential Value
A normal RDW helps rule in these conditions even when MCV is low:
- Thalassemia trait - small uniform RBCs, normal RDW (key distinguishing feature from IDA)
- Anemia of chronic disease (ACD) - normal RDW in most cases
- Aplastic anemia - normal RDW with pancytopenia
- Renal failure anemia - burr cells but normal RDW
- Hypothyroidism - macrocytic but normal RDW
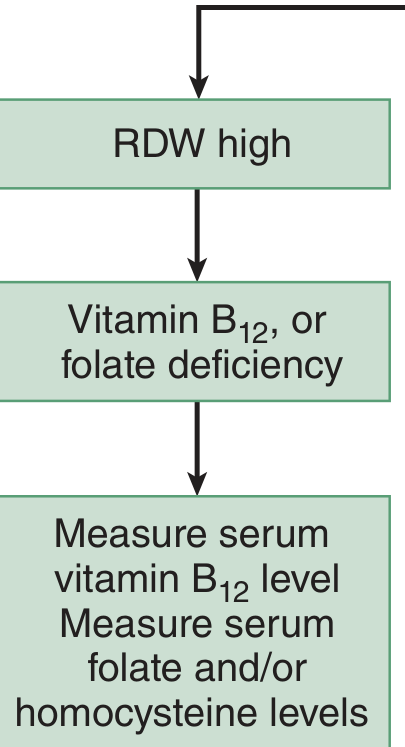
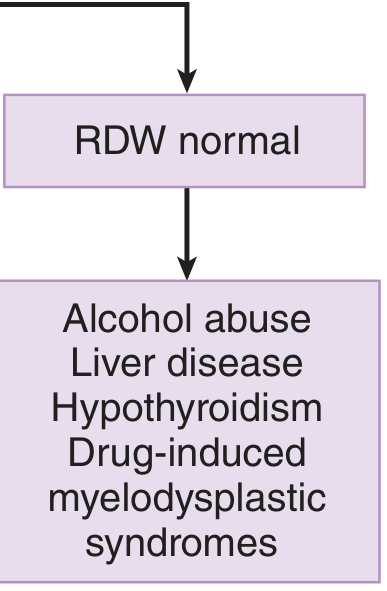
Tintinalli's Diagnostic Flowcharts (Macrocytic Anemia)
When MCV is elevated, RDW helps split the diagnosis:
MCV elevated + RDW high → Vitamin B12 or folate deficiency
MCV elevated + RDW normal → Alcohol abuse, liver disease, hypothyroidism, drug-induced, myelodysplastic syndromes
Important Clinical Pearls
- Early detection: RDW rises before MCV changes in early iron, B12, or folate deficiency - it's a sensitive early flag.
- Thalassemia vs. IDA: In microcytic anemia, a normal RDW favors thalassemia, while a high RDW favors iron deficiency. This is one of the most clinically useful RDW applications.
- MCV can be misleading: In mixed deficiency (iron + B12), MCV appears falsely normal - only the high RDW reveals the problem.
- Beyond anemia: Elevated RDW is associated with all-cause mortality in population studies, and with inflammatory conditions, heart failure, and malignancy - though the mechanism is not fully understood.
- Always combine: RDW alone is non-specific. Pair it with MCV, reticulocyte count, peripheral smear, ferritin, B12/folate levels, and clinical context.
Sources: Harrison's Principles of Internal Medicine 22E (2025), Henry's Clinical Diagnosis and Management by Laboratory Methods, Tintinalli's Emergency Medicine, Goldman-Cecil Medicine, Robbins & Kumar Pathologic Basis of Disease.
This is a shared conversation. Sign in to Orris to start your own chat.