
Refer guyton and hall physiology textbook chapter # membrane potential and action potential #contraction of skeletal muscle Summerise this topic but include all info
action potential nerve fiber depolarization repolarization stages
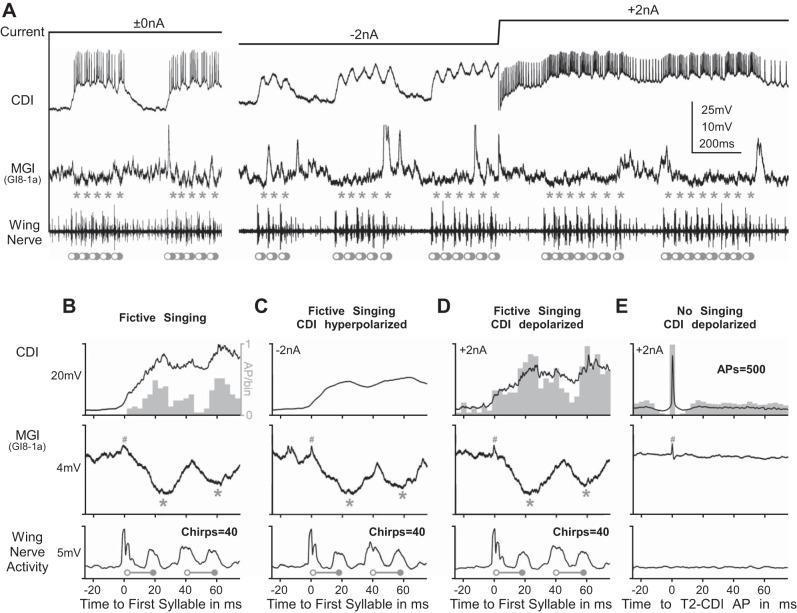
This figure presents electrophysiological data from a neurobiological study on corollary discharge inhibition (CDI). Panel A displays simultaneous intracellular recordings of a CDI interneuron and a median giant fiber (MGI, GI8-1a), along with extracellular wing nerve activity under three current injection conditions: 0nA, -2nA (hyperpolarization), and +2nA (depolarization). The top traces show CDI membrane potential and action potentials, while the middle MGI traces show inhibitory postsynaptic potentials (IPSPs), marked by asterisks. The bottom wing nerve trace indicates motor activity (opener and closer motoneuron firing) during fictive singing. Panels B-E provide quantitative signal averages. B-D compare normal fictive singing with CDI hyperpolarized and depolarized states, showing that while CDI spike amplitude varies, the rhythmic inhibition (IPSPs) in the MGI remains constant in timing and amplitude. Panel E demonstrates that in a 'no singing' resting state, driving the CDI with +2nA current injection does not induce inhibition in the MGI, suggesting the inhibitory mechanism is independent of CDI spike activity alone and requires the central motor program.
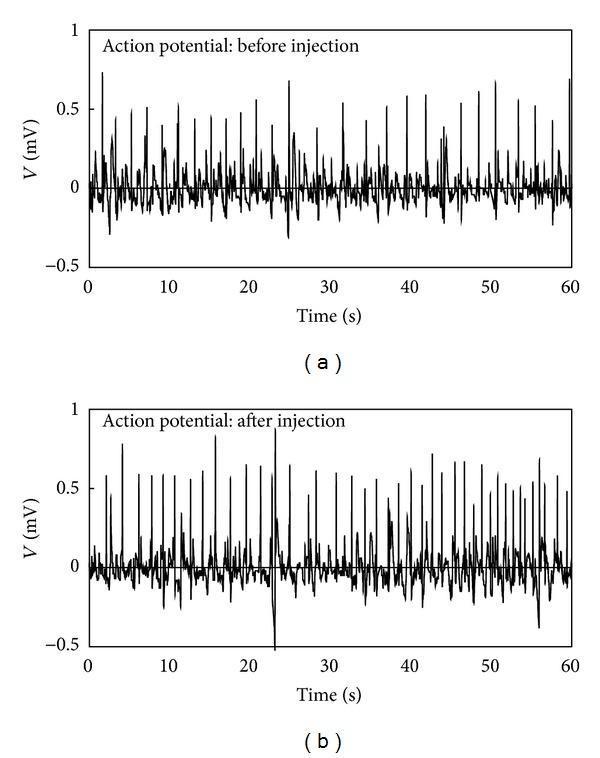
This physiological data visualization displays two action potential plots (a and b) recorded from a Primo-vessel, representing a comparison chart of electrical activity before and after acetylcholine injection. Both graphs plot Voltage (V) in millivolts (mV) on the y-axis, ranging from -0.5 to 1.0 mV, against Time in seconds (s) on the x-axis, spanning a 60-second interval. Graph (a) shows baseline periodic action potentials characterized by rapid depolarization and repolarization phases with an average period of approximately 2.2 seconds. Graph (b) illustrates the post-injection state, where the frequency of action potentials is visibly increased, demonstrated by narrower spacing between pulses and a reduced average period of approximately 1.4 seconds. The pulses in both plots maintain a similar morphology with mean amplitudes around 0.5-0.6 mV. This visual data is used in medical research to demonstrate the excitatory effect of acetylcholine on the Primo-vascular system, reflecting increased cellular activation.
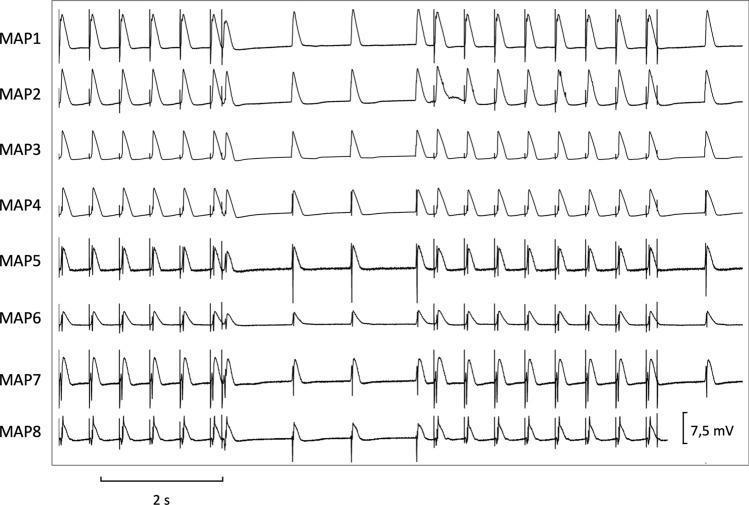
This diagnostic trace image displays eight simultaneous monophasic action potential (MAP) recordings, labeled MAP1 through MAP8, used in cardiac electrophysiology research. The primary focus is the determination of effective refractory periods (ERP) at a basic cycle length of 500 ms. The traces exhibit characteristic cardiac action potential morphology with rapid depolarization and subsequent repolarization phases. Throughout the 2-second time interval (indicated by the scale bar), regular pacing stimuli are followed by short-coupled extrastimuli (S2/S3) to test ventricular vulnerability and refractory periods. Variations in amplitude and morphology are visible across the different MAP traces, with a voltage scale of 7.5 mV provided for reference. Notable features include the presence of premature beats and varying repolarization kinetics (APD90/APD50) across different anatomical recording sites. This recording is representative of programmed electrical stimulation protocols used to assess spatial dispersion of repolarization and the propensity for arrhythmias such as ventricular tachycardia or torsade de pointes.
skeletal muscle sliding filament mechanism actin myosin contraction
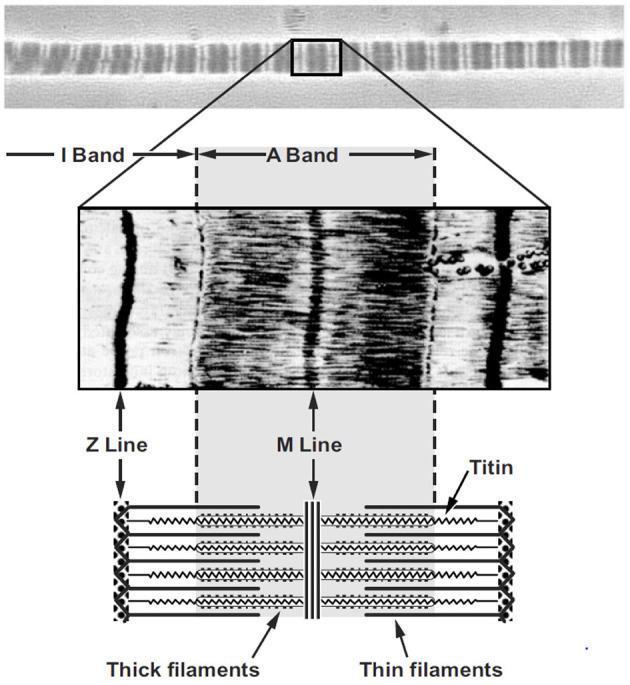
This composite educational graphic illustrates the microanatomy of skeletal muscle fibers across three levels of magnification. The top panel features a high-resolution micrograph of a single myofibril, displaying characteristic dark A-bands and light I-bands in a repeating transverse striation pattern. The middle panel provides a magnified view of a single sarcomere unit, identifying key vertical landmarks: the Z-line (defining sarcomere boundaries), the central M-line, and the horizontal alignment of contractile proteins. The bottom panel is a labeled schematic diagram correlating the visual findings with molecular structures. It depicts the thick filaments (myosin) at the center anchored by the M-line, and thin filaments (actin) extending from the Z-lines. The spring-like protein titin is shown tethering the thick filaments to the Z-line. This multi-modal representation serves to teach the relationship between visible light/electron microscopy patterns and the underlying sliding filament theory of muscle contraction, relevant to physiology and histology.
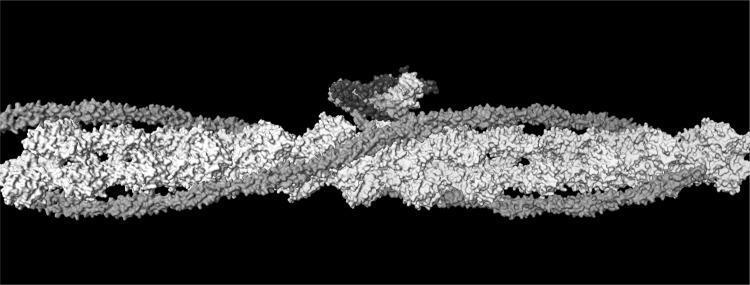
This molecular model illustrates the structural organization of a muscle thin filament, a key component of the sarcomere's contractile apparatus. The image depicts a double-stranded helix of F-actin (white), characterized by repeating globular G-actin subunits. Wound along the longitudinal grooves of the actin filament are two strands of tropomyosin (grey/red). At regular intervals, the regulatory troponin complex is visible as a multi-subunit globular mass bound to the actin-tropomyosin assembly. According to the structural data by Pirani et al. (2006), the troponin complex is subdivided into three specific subunits: Troponin C (TnC), Troponin I (TnI), and Troponin T (TnT), which are represented here by varying shades of grey/color. The left side of the model represents the barbed end (Z-band end) of the actin filament. This illustration is essential for understanding the steric blocking mechanism of muscle contraction, where Ca2+ binding to troponin triggers a conformational shift in tropomyosin to expose myosin-binding sites on actin.
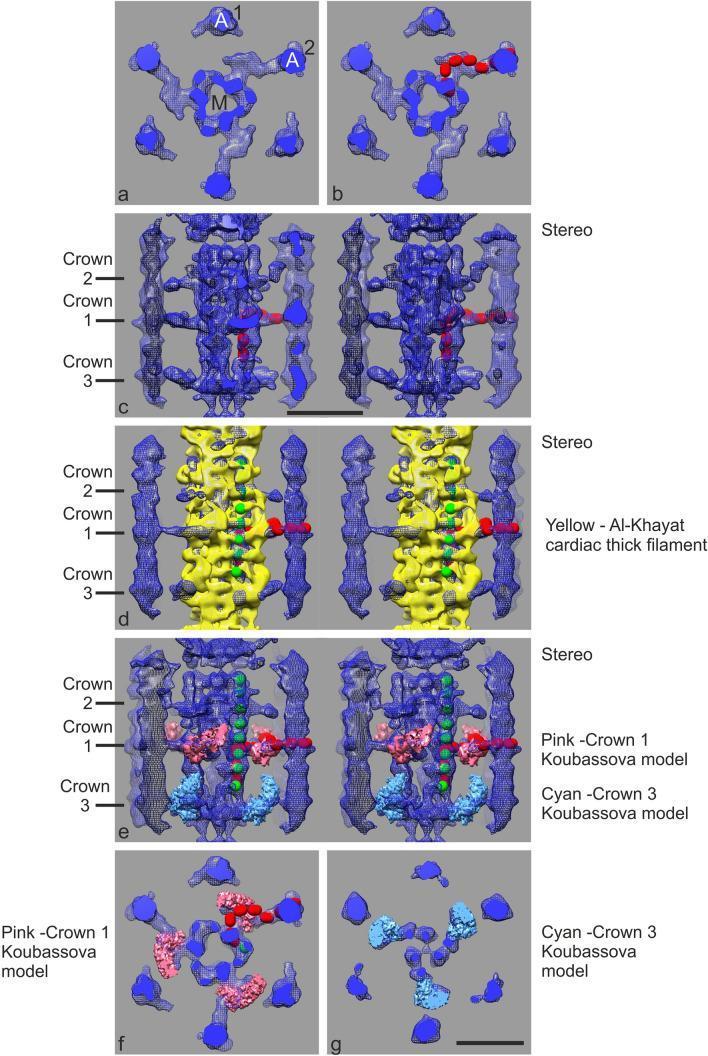
A multi-panel scientific visualization showing subtomogram averages and molecular docking models of the cardiac muscle sarcomere's C-zone, specifically focusing on the interactions between myosin thick filaments and actin thin filaments. Panel (a) provides a cross-sectional view of a central myosin filament (M) surrounded by six actin filaments (A1, A2), illustrating the threefold symmetry of the thick filament backbone. Panels (b-g) integrate structural models to characterize MyBP-C (myosin-binding protein C) and myosin head arrangements. Longitudinal stereo views (c-e) demonstrate the axial distribution of myosin crossbridge 'crowns' (Crowns 1, 2, and 3) along the 430 Å repeat, with Crown 1 coinciding with the MyBP-C stripe. The models incorporate Ig-domain spheres (red) to trace the path of MyBP-C from the myosin backbone to actin, alongside docked crystal structures of cardiac thick filaments (yellow) and myosin motor domains (pink/cyan). This diagram serves as a high-resolution anatomical and physiological illustration for understanding cardiac muscle contraction at the molecular level, highlighting the spatial relationship between titin, MyBP-C, and the actomyosin complex.
Chapter 5: Membrane Potential and Action Potential
1. Measuring the Membrane Potential
- Outside the membrane: 0 mV (reference)
- Inside the nerve fiber: -70 mV (resting state)
- Only 1/3,000,000 to 1/100,000,000 of total positive charges inside need to be transferred to create this potential
- Reversing the potential from -70 mV to +35 mV requires an equally tiny ion shift, occurring in as little as 1/10,000 of a second
2. Resting Membrane Potential of Neurons (-70 mV)
Active Transport: The Na⁺-K⁺ Pump
- 3 Na⁺ ions outward for every 2 K⁺ ions inward per cycle
- This creates a net negative charge inside (electrogenic effect contributes ~4 mV of the resting potential)
- Energy source: ATP hydrolysis
Ion Concentration Gradients (large nerve fiber)
| Ion | Intracellular (mEq/L) | Extracellular (mEq/L) |
|---|---|---|
| Na⁺ | 14 | 142 |
| K⁺ | 140 | 4 |
| Cl⁻ | 4 | 103 |
Origin of the Resting Membrane Potential
-
Potassium diffusion potential: K⁺ leaks out through potassium leak channels (more permeable than Na⁺ at rest), taking positive charge out and creating a negative interior. The Nernst equilibrium potential for K⁺ is about -94 mV.
-
Sodium diffusion potential: Na⁺ leaks inward (opposite direction), partially reducing the negativity. The Nernst equilibrium for Na⁺ is about +61 mV.
-
The Goldman-Hodgkin-Katz equation accounts for the permeabilities of multiple ions simultaneously. At rest, K⁺ permeability is about 100 times greater than Na⁺ permeability, which is why the resting potential (-70 mV) lies much closer to the K⁺ equilibrium potential.
-
The Na⁺-K⁺ pump contributes directly by pumping more positive charges out than in (3 Na⁺ out, 2 K⁺ in), adding an additional ~4 mV of negativity.
3. Neuron Action Potential
Stages of the Action Potential
- A stimulus depolarizes the membrane to the threshold (~-55 mV)
- Voltage-gated Na⁺ channels open suddenly - Na⁺ rushes in
- Membrane potential rises rapidly from -70 mV, overshoots 0 mV, reaches +35 mV
- This is the upstroke (spike) of the action potential
- Within <1 ms, Na⁺ channels begin to inactivate (close via inactivation gates)
- Voltage-gated K⁺ channels open - K⁺ rushes out
- Membrane potential rapidly returns toward -70 mV
- K⁺ channels may stay open briefly longer, causing hyperpolarization (undershoot) to about -80 mV
- When K⁺ channels close, the potential returns to exactly -70 mV
4. Voltage-Gated Sodium and Potassium Channels
Voltage-Gated Sodium Channel
- Has two gates: activation gate (m gate) and inactivation gate (h gate)
- At rest: activation gate CLOSED, inactivation gate OPEN
- On depolarization to threshold: activation gate OPENS rapidly (within 0.01 ms) → Na⁺ floods in
- Within 1/10,000 sec after opening: inactivation gate CLOSES → Na⁺ entry stops
- The channel cannot reopen until the membrane is repolarized (inactivation gate resets)
Voltage-Gated Potassium Channel
- Has only one gate (n gate) - activation gate
- Opens slowly during depolarization (lags behind Na⁺ channel)
- Opens fully as membrane repolarizes → K⁺ rushes out → repolarization accelerates
- Responsible for the undershoot/hyperpolarization (afterhyperpolarization)
Three States of the Na⁺ Channel
- Resting (closed, activatable): activation gate closed, inactivation gate open
- Activated (open): both gates open briefly - this is the actual conduction state
- Inactivated (closed, non-activatable): inactivation gate closed - cannot respond to stimulus
5. Summary of Events During the Action Potential
| Time | Event |
|---|---|
| 0 ms | Threshold reached, Na⁺ activation gates open |
| 0-0.5 ms | Na⁺ floods in - rapid depolarization to +35 mV |
| 0.5 ms | Na⁺ inactivation gates close; K⁺ channels open |
| 0.5-1 ms | K⁺ floods out - rapid repolarization |
| 1-1.5 ms | Hyperpolarization (undershoot) to ~-80 mV |
| 1.5+ ms | K⁺ channels close; return to -70 mV resting potential |
6. Initiation of the Action Potential
- Threshold: usually -55 mV (about 15 mV above resting -70 mV)
- Positive feedback (Hodgkin cycle): depolarization → Na⁺ channels open → more Na⁺ in → more depolarization → more Na⁺ channels open (explosive, self-sustaining)
- Subthreshold stimuli: do not trigger an action potential; a local depolarization decays passively
- Suprathreshold stimuli: produce a full action potential (all-or-none principle)
7. Refractory Periods
Absolute Refractory Period
- During the peak of depolarization and part of repolarization
- No stimulus, however strong, can trigger another action potential
- Reason: Na⁺ inactivation gates are closed and cannot reopen until repolarization
Relative Refractory Period
-
After absolute refractory period, during undershoot/hyperpolarization
-
A stronger-than-normal stimulus can fire another action potential
-
Reason: membrane is more negative than resting, so threshold is harder to reach
-
Absolute refractory period in large nerve fibers: ~1/2500 second → maximum firing rate ~2500 impulses/sec
8. Propagation of the Action Potential
- An action potential at one point of the nerve fiber electrically stimulates adjacent membrane segments
- Local current loops form: positive charges flow from the active site to adjacent resting membrane, depolarizing it to threshold → new action potential fires
- In unmyelinated fibers: propagation is continuous and relatively slow
- In myelinated fibers: action potentials jump from one node of Ranvier to the next (saltatory conduction) - much faster and more energy-efficient
- Propagation velocity: up to 120 m/sec in large myelinated fibers; as slow as 0.5 m/sec in unmyelinated C fibers
9. Roles of Other Ions
- Calcium ions: Stabilize the membrane by binding to outer channel proteins, reducing Na⁺ channel permeability. Hypocalcemia causes increased membrane excitability (tetany)
- Chloride: Cl⁻ is passively distributed; its equilibrium potential is close to the resting potential, so it plays a minor role
- Anesthetics: Substances like procaine and tetracaine block Na⁺ activation gates, stabilizing the membrane and preventing action potential generation
10. Energy Metabolism After Action Potentials
- Each action potential causes a tiny loss of the Na⁺/K⁺ gradient (Na⁺ in, K⁺ out)
- This change is so small that 100,000 to 50 million impulses can be conducted before gradients are exhausted
- The Na⁺-K⁺ pump restores gradients using ATP - an active, energy-requiring process
- Pump activity increases by the cube of intracellular Na⁺ concentration (if Na⁺ doubles inside, pump activity increases ~8x)
- Heat production increases proportionally with impulse frequency (measurable as metabolic activity)
11. Plateau Action Potentials
- In some fibers (notably heart muscle), the membrane does not repolarize immediately
- A plateau keeps the potential near +0 mV for 0.2-0.3 seconds
- Mechanism: special Ca²⁺ channels that open slowly and stay open, balanced by delayed K⁺ channel opening
- This extended depolarization drives prolonged cardiac muscle contraction
Chapter 6: Contraction of Skeletal Muscle
1. Physiological Anatomy of Skeletal Muscle
- Skeletal muscle = ~40% of body mass
- Each fiber: 10-80 micrometers diameter, usually extends the entire length of the muscle
- Innervated by a single nerve ending near its midpoint
- Each fiber contains hundreds to thousands of myofibrils
- Each myofibril is made of ~1500 myosin (thick) filaments and ~3000 actin (thin) filaments arranged in parallel
Sarcomere Structure (basic contractile unit)
- Defined by two Z disks (Z membranes)
- A band: dark region containing myosin filaments (and overlapping actin ends)
- I band: light region containing only actin filaments
- H zone: center of A band where actin does not overlap myosin
- M line: center of the sarcomere; connects myosin filaments by protein linkages
- Titin: giant elastic protein (molecular weight ~3 million) anchoring myosin to Z disks, acts as a spring to restore sarcomere length
Sarcoplasm and Sarcoplasmic Reticulum
- Sarcoplasm: cytoplasm of muscle fiber, rich in glycogen, large amounts of myoglobin (oxygen store)
- Sarcoplasmic reticulum (SR): a specialized smooth ER that envelops each myofibril; stores Ca²⁺
- Transverse (T) tubules: extensions of the cell membrane that pass deep into the fiber, carrying electrical signals inward to reach the SR
2. Molecular Characteristics of the Contractile Filaments
Myosin Filament (thick filament)
- ~480,000 molecular weight per myosin molecule
- Each molecule has: 2 heavy chains coiled together (rod portion) + 4 light chains forming the myosin head (cross-bridge)
- ~200 myosin molecules stack to form one thick filament, with cross-bridge heads projecting outward
- The myosin head is the motor unit: it binds actin and hydrolyzes ATP
Actin Filament (thin filament)
- Double-stranded F-actin helix, each strand made of G-actin monomers
- Each G-actin has an active site that binds the myosin cross-bridge
- Two regulatory proteins sit on the actin filament:
- Tropomyosin: rod-shaped protein that winds around the actin strands and physically blocks the active sites at rest
- Troponin complex (3 subunits):
- Troponin I: inhibitory - binds actin and inhibits actin-myosin interaction
- Troponin T: binds to tropomyosin, anchoring the complex
- Troponin C: binds Ca²⁺; when it does, the whole complex shifts, uncovering active sites
3. Sliding Filament Mechanism of Contraction
- During contraction, actin filaments slide inward among myosin filaments
- The Z disks are pulled toward each other - the sarcomere shortens
- The A band length stays constant (myosin does not change)
- The I band and H zone narrow (as actin slides in)
- In fully contracted muscle, actin ends from opposite Z disks may overlap each other
4. Cross-Bridge Cycle (Walk-Along Theory)
- ATP binds to the myosin head → head detaches from actin
- ATP is hydrolyzed to ADP + Pi → myosin head cocks into a "high-energy" 90° position
- Myosin head attaches to actin active site (Ca²⁺ must be present to expose the site)
- Power stroke: Pi is released → myosin head pivots to 45° → pulls actin ~10 nm toward the M line
- ADP is released
- A new ATP binds → cycle repeats
- Each cross-bridge cycles 50-100 times/sec during strong contraction
- All cross-bridges in a sarcomere pull simultaneously, each pulling ~10 nm per stroke
5. Excitation-Contraction Coupling
- An action potential arrives at the motor nerve terminal
- Acetylcholine (ACh) is released into the neuromuscular junction
- ACh binds nicotinic receptors on the motor end plate → end-plate potential → muscle fiber action potential
- The action potential spreads along the sarcolemma and down T-tubules
- T-tubule depolarization activates dihydropyridine receptors (DHPR) (voltage sensors) on the T-tubule wall
- DHPR mechanically activates ryanodine receptors (RyR1) on the SR terminal cisternae
- Ca²⁺ floods out of SR into sarcoplasm (concentration rises from ~10⁻⁷ to ~10⁻⁵ mol/L)
- Ca²⁺ binds Troponin C → troponin-tropomyosin complex shifts → active sites on actin uncovered
- Myosin cross-bridges bind actin → power stroke → contraction begins
- After the stimulus ends, Ca²⁺-ATPase (SERCA pump) on SR actively pumps Ca²⁺ back into SR
- Ca²⁺ levels fall → tropomyosin re-covers active sites → relaxation
6. Muscle Action Potential
- Resting potential of muscle fiber: approximately -80 mV (slightly more negative than neurons)
- Duration of action potential: ~1-5 ms
- Propagation velocity: 3-5 m/sec
- The action potential in muscle follows the same mechanism as in neurons (Na⁺ channel activation, K⁺ channel repolarization)
- Special feature: after the action potential, Ca²⁺ release from SR lasts 1/50 second (much longer than the electrical event), driving the contraction
7. The Neuromuscular Junction
Structure
- Motor nerve terminal (presynaptic) forms an expanded end plate on the muscle fiber
- Synaptic cleft: ~20-30 nm gap
- Motor end plate (postsynaptic): has deep subneural clefts lined with nicotinic ACh receptors and acetylcholinesterase
ACh Release and Recycling
- ACh is packaged in ~40-nm vesicles (formed in the spinal cord motoneuron soma, transported to terminals)
- Each vesicle contains ~10,000 molecules of ACh
- ~300,000 vesicles are stored in one nerve terminal
- Arrival of action potential opens voltage-gated Ca²⁺ channels in the terminal → Ca²⁺ increases 100-fold → ~125 vesicles rupture and release ACh
- ACh diffuses across the cleft → binds nicotinic receptors → opens cation channels → depolarization (end-plate potential)
- Acetylcholinesterase splits ACh into acetate + choline within 5-10 ms
- Choline is actively reabsorbed and recycled into new ACh
- Vesicles are recycled within ~20 seconds via clathrin-coated pits
Safety Factor
- Each nerve impulse normally produces an end-plate potential ~3-4x the threshold needed to fire a muscle action potential - this large safety factor ensures reliable transmission
8. Pharmacology of the Neuromuscular Junction
| Drug/Agent | Mechanism | Effect |
|---|---|---|
| Curare | Blocks nicotinic receptors | Muscle paralysis |
| Methacholine, carbachol, nicotine | ACh-like agonists, resistant to cholinesterase | Prolonged depolarization, spasm |
| Neostigmine, physostigmine | Inhibit acetylcholinesterase | ACh accumulation, repetitive firing, spasm |
| Organophosphate nerve agents | Irreversibly inhibit acetylcholinesterase | Sustained depolarization, death |
| Botulinum toxin | Blocks ACh vesicle release | Flaccid paralysis |
| Myasthenia gravis | Autoimmune destruction of ACh receptors | Progressive muscle weakness |
9. Mechanics of Muscle Contraction
Summation of Contractions
- A single action potential produces a brief muscle twitch
- If a second stimulus arrives before the first twitch ends, the twitches summate (add) - greater force
- Wave summation: at high frequency, twitches merge into a tetanus (smooth, sustained maximal contraction)
- Summation occurs because: Ca²⁺ does not have time to be pumped back into SR before the next action potential arrives
Isometric vs. Isotonic Contraction
- Isometric: muscle generates force but does not shorten (e.g., holding a heavy weight still); length constant, tension increases
- Isotonic: muscle shortens while tension remains constant (e.g., lifting a weight through a range of motion)
Length-Tension Relationship
- Maximum contraction force is generated at the optimal resting length (full functional muscle length, ~2.0-2.2 µm sarcomere length)
- At this length, maximum actin-myosin overlap exists
- At shorter lengths: actin filaments from opposite sides overlap and interfere → reduced force
- At longer lengths (over-stretch): fewer cross-bridges can form (actin pulled away from myosin) → reduced force
10. Fast vs. Slow Muscle Fibers
| Feature | Slow (Type I, Red) | Fast (Type IIx, White) |
|---|---|---|
| Fiber size | Smaller | Larger |
| Innervation | Smaller motor fibers | Larger motor fibers |
| Mitochondria | Abundant | Few |
| Capillary supply | Dense | Sparse |
| Myoglobin | High (red color) | Low (pale) |
| ATPase activity | Low | High |
| Energy source | Oxidative (aerobic) | Glycolytic (anaerobic) |
| Fatigue | Resistant | Fatigues rapidly |
| Contraction speed | Slow | Fast |
| Function | Sustained posture, endurance | Rapid powerful movements |
- Examples of slow-fiber-dominant muscles: soleus (postural)
- Examples of fast-fiber-dominant muscles: anterior tibialis, ocular muscles
11. Contraction Durations
| Muscle | Duration of Isometric Contraction |
|---|---|
| Ocular muscles | <1/50 second |
| Gastrocnemius | ~1/15 second |
| Soleus | ~1/5 second |
12. Energy Sources for Muscle Contraction
- ATP (immediate energy, only 4-5 mmol/L in muscle) - lasts seconds
- Creatine phosphate (phosphocreatine) - rapidly regenerates ATP via creatine kinase; lasts 5-8 seconds of maximal effort
- Glycolysis (anaerobic) - from glycogen/glucose; produces ATP quickly but inefficiently; lasts ~1 minute; produces lactic acid
- Oxidative phosphorylation (aerobic) - from glucose, fatty acids, amino acids; efficient but slow; sustains prolonged activity
13. Muscle Fatigue
- Defined as inability to maintain a given force output despite continued stimulation
- Causes:
- Depletion of glycogen and creatine phosphate stores
- Lactic acid accumulation (lowers pH, inhibits enzyme activity)
- Intracellular K⁺ changes (altered membrane potentials)
- Reduced Ca²⁺ release from SR over time
- Neuromuscular junction fatigue (rarely the limiting factor)
14. Muscle Remodeling
Hypertrophy
- Increased mass from increased number of actin and myosin filaments per fiber (fiber hypertrophy)
- Requires loaded contractions; only a few strong contractions per day can cause significant hypertrophy within weeks
- Protein synthesis increases; muscle enzymes, mitochondria, and vascular supply also increase
Atrophy
- Occurs with disuse, immobilization, denervation, or prolonged illness (cachexia)
- Progressive loss of filaments and fiber cross-section
- Denervation atrophy is most severe - without a nerve supply, muscle eventually replaced by fibrous and fatty tissue
15. Lever Systems and Body Mechanics
- Muscles act through lever systems at joints
- Three classes of levers exist; most body movements use Class III (effort between fulcrum and load)
- Agonist-antagonist coactivation: virtually all movements involve simultaneous contraction of both agonist and antagonist muscles, controlled by CNS - this provides fine position control
- Muscle force depends on: fiber cross-section, number of fibers, sarcomere length, rate of stimulation, and temperature
Quick-Reference Summary Table
| Topic | Key Facts |
|---|---|
| Resting membrane potential | -70 mV (neurons), -80 mV (muscle) |
| Threshold for action potential | ~-55 mV |
| Action potential peak | +35 mV |
| Na⁺ influx causes | Depolarization |
| K⁺ efflux causes | Repolarization |
| Absolute refractory period | ~0.4 ms; no AP possible |
| Relative refractory period | After ARP; stronger stimulus needed |
| Myelinated fiber velocity | Up to 120 m/s (saltatory conduction) |
| Motor unit | 1 motor neuron + all its muscle fibers |
| ACh vesicles per nerve terminal | ~300,000 |
| ACh per vesicle | ~10,000 molecules |
| Ca²⁺ released from | Sarcoplasmic reticulum via RyR1 |
| Ca²⁺ triggers | Troponin C → tropomyosin shifts → actin active sites exposed |
| Cross-bridge power stroke | ~10 nm per stroke, ATP-driven |
| Optimal sarcomere length | ~2.0-2.2 µm |