
Ecg reading explain
I'll give you a solid overview of ECG reading, then pull from the medical library for depth.
Quick answer: An ECG (electrocardiogram) records the heart's electrical activity across 12 leads. Reading it involves a systematic approach: rate, rhythm, axis, P waves, PR interval, QRS complex, ST segment, and T waves. Each component reflects a specific phase of cardiac depolarization/repolarization.
Searching sources...
Reading File
Now let me search the medical library for ECG reading content in parallel:
Finding Sources
Finding Sources
Finding Sources
Finding Sources
Excellent - I have several strong sources. Let me read the key sections from Harrison's, Goldman-Cecil, and Costanzo in parallel:
Reading File
Reading File
Reading File
I have rich content. Let me now fetch the key ECG diagram image and read more from Harrison's for the systematic approach and intervals:
Loading Image
Reading File
Reading File
I now have comprehensive content from Harrison's, Goldman-Cecil, and Costanzo. Let me also get the leads section and the Harrison's ECG waveform image:
Loading Image
Reading File
I have excellent content and visuals. Now let me compile the full, comprehensive ECG guide.
ECG Reading: A Complete Guide
An ECG (electrocardiogram) records the heart's electrical activity from electrodes placed on the body surface. The fundamental principle: when a depolarization wave moves toward a positive electrode, it inscribes an upward (positive) deflection; when it moves away, it records a downward (negative) deflection.
The Basic ECG Waveform
Here is the standard ECG waveform with all labeled components:

Fig. 4.17 - The electrocardiogram measured from Lead II (Costanzo Physiology, 7th Ed.)
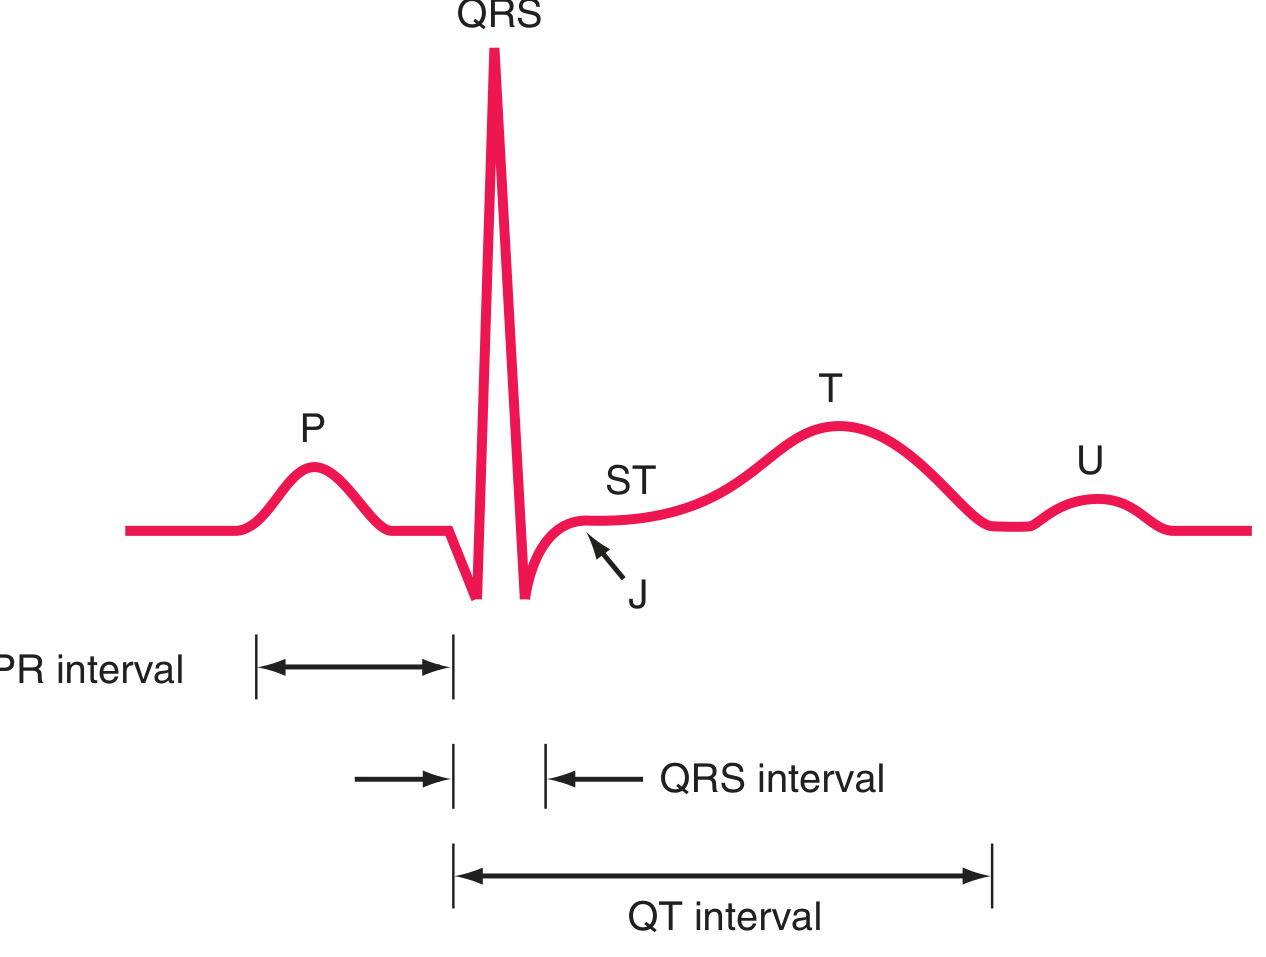
Fig. 247-2 - Basic ECG waveforms and intervals including the J point (Harrison's, 22nd Ed.)
The Cardiac Conduction System (What the ECG Records)
The ECG captures this sequence of electrical events:
- SA node (sinoatrial node, high right atrium) fires spontaneously - it is the dominant pacemaker
- Wave spreads through both atria (Bachmann bundle speeds it to the left atrium)
- Signal reaches the AV node - where there is a physiologic conduction delay
- Exits into the Bundle of His → splits into right and left bundle branches → left bundle divides into left anterior and left posterior fascicles
- Depolarization travels through the Purkinje system rapidly to ventricular myocardium (endocardium → epicardium)
"The depolarization wavefronts then spread through the ventricular wall, from endocardium to epicardium, triggering coordinated ventricular contraction." - Harrison's Principles of Internal Medicine, 22nd Ed.
Step-by-Step: What Each Wave/Segment Means
1. P Wave
- Represents atrial depolarization
- Duration reflects conduction time through the atria
- Normal: upright in leads I and II; negative in aVR
- The SA node-generated P wave is positive in Lead II and negative in aVR (the depolarization vector points down and leftward)
- Atrial repolarization is buried under the QRS and not normally seen
- Abnormal P wave? Broad/notched = left atrial enlargement; tall/peaked = right atrial enlargement; absent or inverted = ectopic/junctional rhythm
2. PR Interval
- From the start of the P wave to the start of the QRS complex
- Represents the time for the impulse to travel from atria → through the AV node → to the ventricles
- The isoelectric (flat) portion within it (the PR segment) corresponds to AV nodal conduction delay
- Normal: 120-200 ms (3-5 small squares at 25 mm/s)
- Sympathetic stimulation shortens it; parasympathetic (vagal) stimulation prolongs it
| Finding | Meaning |
|---|---|
| Short PR (<120 ms) | Pre-excitation (e.g., WPW syndrome) or junctional rhythm |
| Long PR (>200 ms) | 1st degree AV block |
| Progressively lengthening → dropped beat | 2nd degree AV block (Mobitz I / Wenckebach) |
| Fixed PR + random dropped beats | 2nd degree AV block (Mobitz II) |
| No relationship between P and QRS | 3rd degree (complete) AV block |
3. QRS Complex
- Represents ventricular depolarization
- Q = first downward deflection; R = first upward deflection; S = downward deflection after R
- Not every QRS has all three components - a large upward wave alone can be called an R wave
- Normal duration: ≤100-110 ms (≤2.5 small squares)
- The His-Purkinje system allows rapid ventricular spread, so QRS duration is similar to P wave duration despite the far larger ventricular mass
| Finding | Meaning |
|---|---|
| Wide QRS >120 ms | Bundle branch block, hyperkalemia, drugs (Na-channel blockers), paced rhythm |
| Deep Q waves (>25% of R height, >40 ms) | Pathological - prior myocardial infarction |
| Tall R waves | Left or right ventricular hypertrophy |
| Low voltage | Pericardial effusion, emphysema, hypothyroidism |
4. ST Segment
- From end of QRS (the J point) to start of T wave
- Corresponds to the plateau phase (phase 2) of the ventricular action potential - the isoelectric period between depolarization and repolarization
- Normally at the baseline (isoelectric)
| Finding | Meaning |
|---|---|
| ST elevation ≥1 mm | STEMI (myocardial infarction), pericarditis (diffuse saddle-shaped), Prinzmetal angina, Brugada pattern |
| ST depression | NSTEMI/unstable angina, subendocardial ischemia, digoxin effect (scooped) |
| Diffuse saddle-shaped elevation | Pericarditis |
5. T Wave
- Represents ventricular repolarization
- Normally upright in most leads (I, II, V3-V6), inverted in aVR
- Corresponds to phase 3 of the action potential (active repolarization)
| Finding | Meaning |
|---|---|
| Peaked tall T waves | Hyperkalemia (early), myocardial infarction (hyperacute) |
| Flat/inverted T waves | Ischemia, ventricular hypertrophy, bundle branch block |
| T wave inversions V1-V4 | Right heart strain (PE), anterior ischemia |
6. QT Interval
- From start of QRS to end of T wave
- Encompasses ventricular depolarization + repolarization
- Normal upper limits: 460 ms in women, 450 ms in men (rate-corrected QTc)
- QT varies inversely with heart rate - must correct using Bazett's formula: QTc = QT / √RR interval
- Prolonged QT → risk of Torsades de Pointes (polymorphic VT) - causes include drugs (antiarrhythmics, antipsychotics, macrolides), electrolyte abnormalities (hypokalemia, hypomagnesemia, hypocalcemia), congenital LQTS
7. U Wave
- Small deflection after the T wave, best seen in V2-V3
- Thought to represent repolarization of the Purkinje system or papillary muscles
- Prominent U waves: hypokalemia, bradycardia
- Inverted U waves: may indicate ischemia
The 12 Leads: What They See
The 12-lead ECG gives 12 different "camera angles" of the same electrical events:
Limb Leads (Frontal Plane):
| Lead | View |
|---|---|
| I | Lateral (left side) |
| II | Inferior |
| III | Inferior |
| aVR | Right shoulder (cavity view, everything inverted) |
| aVL | High lateral |
| aVF | Inferior |
Precordial (Chest) Leads (Horizontal Plane):
| Lead | View |
|---|---|
| V1-V2 | Septal / right ventricle |
| V3-V4 | Anterior wall |
| V5-V6 | Lateral wall |
A positive deflection occurs when depolarization moves toward the positive electrode of a lead.
Systematic ECG Reading: The RRIAPQRST Approach
Use this order every time to avoid missing anything:
| Step | What to assess | Normal values |
|---|---|---|
| 1. Rate | Count R-R intervals: 300/large squares between R waves | 60-100 bpm |
| 2. Rhythm | Regular vs. irregular; P before every QRS? | Regular sinus |
| 3. Axis | Leads I and aVF (both positive = normal axis) | -30° to +90° |
| 4. P waves | Morphology, upright in II, negative in aVR | Upright in II |
| 5. PR interval | Onset P to onset QRS | 120-200 ms |
| 6. QRS complex | Duration, morphology, Q waves | ≤110 ms |
| 7. ST segment | Elevation or depression vs. baseline | Isoelectric |
| 8. T waves | Upright vs. inverted, peaked vs. flat | Upright in I, II, V3-V6 |
| 9. QT interval | Measure QTc | <450 ms (men), <460 ms (women) |
| 10. U wave | Present? Prominent? | Small, if seen |
How to Calculate Heart Rate
Regular rhythm:
- Count large squares between two R waves → divide 300 by that number
- Or: count small squares between R waves → divide 1500 by that number
Example: R-R interval = 4 large squares → Heart rate = 300/4 = 75 bpm
Irregular rhythm (e.g., AF): Count QRS complexes in a 10-second strip × 6
Key Action Potential Correlations
The ECG waveforms directly reflect action potential phases:
| ECG | Action Potential Phase | Ion Movement |
|---|---|---|
| QRS onset | Phase 0 (rapid upstroke) | Na⁺ influx |
| ST segment | Phase 2 (plateau) | Ca²⁺ influx balanced by K⁺ efflux |
| T wave | Phase 3 (repolarization) | K⁺ efflux |
- Drugs/conditions impairing Na⁺ influx (e.g., hyperkalemia, flecainide) → widen QRS
- Drugs/conditions prolonging phase 2 or 3 (e.g., amiodarone, hypocalcemia) → lengthen QT
- Factors shortening repolarization (e.g., hypercalcemia, digoxin) → shorten QT
Sources:
- Harrison's Principles of Internal Medicine, 22nd Ed. (2025), Ch. 247
- Goldman-Cecil Medicine International Edition, 2 Vol Set, Ch. 42
- Costanzo Physiology, 7th Edition, Ch. 4
- Braunwald's Heart Disease, 11th Ed.
This is a shared conversation. Sign in to Orris to start your own chat.