
Can you explain me about basic ECG things with images how to make diagnosis and imp ecg findings in Icu
Reading File
Now let me search the medical library for ECG content with images.
Finding Sources
Finding Sources
Finding Sources
Finding Sources
Good - I found ECG content in Braunwald's Heart Disease and Costanzo Physiology. Let me read the key sections in parallel.
Reading File
Reading File
Excellent! I found great ECG content and images. Let me now search for ICU-specific findings and get more images.
Finding Sources
Finding Sources
Finding Sources
Finding Sources
Excellent! I have great content and image URLs. Let me now read more ICU ECG content and fetch key images in parallel.
Reading File
Reading File
Loading Image
Now let me fetch the key ECG images in parallel - STEMI, hyperkalemia, and arrhythmia images.
Loading Image
Loading Image
Loading Image
Excellent images! Let me fetch a few more critical ICU ECG images - the aVR STEMI, inferior STEMI, and get the arrhythmia/AV block content.
Loading Image
Reading File
Now let me get a few more essential ICU ECG images - the Costanzo physiology normal ECG image and the arrhythmia/VT/AF images.
Loading Image
Reading File
I now have all the core content and images needed. Let me update my todos and compile the comprehensive response.Here is your complete, image-rich ECG guide for ICU practice, compiled from Braunwald's Heart Disease, Rosen's Emergency Medicine, Costanzo Physiology, and Comprehensive Clinical Nephrology.
ECG Interpretation: From Basics to ICU Diagnosis
PART 1 - THE NORMAL ECG
The Waveform Components
The ECG measures electrical potential differences on the body surface that reflect the sequence of cardiac depolarization and repolarization. Here is the standard waveform:

| Component | What It Represents | Normal Value |
|---|---|---|
| P wave | Atrial depolarization | Duration < 120 ms, amplitude < 2.5 mm |
| PR interval | Atrial depol + AV node conduction | 120-200 ms (3-5 small boxes) |
| QRS complex | Ventricular depolarization | < 120 ms (< 3 small boxes) |
| ST segment | Plateau of ventricular AP | Isoelectric (flat) |
| T wave | Ventricular repolarization | Upright in most leads |
| QT interval | Total ventricular depol + repol | QTc < 440 ms (men), < 460 ms (women) |
Key memory aid:
- Intervals include waves (e.g., PR interval = P wave + PR segment)
- Segments are the flat bits between waves (e.g., ST segment, PR segment)
Heart Rate Calculation
The simplest method on a standard ECG (25 mm/s paper, 0.2 s/large box):
Rate = 300 ÷ number of large boxes between R-R
| R-R large boxes | Heart Rate |
|---|---|
| 1 box | 300 bpm |
| 2 boxes | 150 bpm |
| 3 boxes | 100 bpm |
| 4 boxes | 75 bpm |
| 5 boxes | 60 bpm |
| 6 boxes | 50 bpm |
The 12-Lead System
Limb leads (frontal plane):
- I, II, III - bipolar
- aVR, aVL, aVF - augmented unipolar
Precordial leads (horizontal plane):
- V1 - right ventricular surface
- V2-V3 - interventricular septum
- V4 - cardiac apex
- V5-V6 - lateral wall
PART 2 - SYSTEMATIC ECG READING (The "RRATE" Approach)
A reliable system used in the ICU:
- R - Rate (fast/slow/normal)
- R - Rhythm (regular/irregular? P before every QRS?)
- A - Axis (normal: -30 to +90)
- T - Trace abnormalities (P wave, PR, QRS, ST, T wave, QT)
- E - Extra findings (hypertrophy, blocks, ischemia pattern)
PART 3 - CRITICAL ICU ECG FINDINGS
3A. MYOCARDIAL INFARCTION - STEMI Localization
Universal rule: ST elevation > 1 mm in 2 or more contiguous leads = STEMI until proven otherwise.
| Territory | Leads with ST Elevation | Culprit Artery |
|---|---|---|
| Anterior STEMI | V1-V4 | LAD (Left Anterior Descending) |
| Anterolateral STEMI | V1-V6, I, aVL | Proximal LAD |
| Lateral STEMI | I, aVL, V5, V6 | LCx or Diagonal branch |
| Inferior STEMI | II, III, aVF | RCA (90% cases) |
| Right Ventricular MI | V3R-V6R (right-sided leads) | Proximal RCA |
| Posterior MI | ST depression V1-V3 (mirror image) | RCA or LCx |
| Left Main occlusion | ST elevation in aVR + widespread depression | Left Main CA |
(Source: Rosen's Emergency Medicine, Table 64.4)
Anterior STEMI (V1-V4):
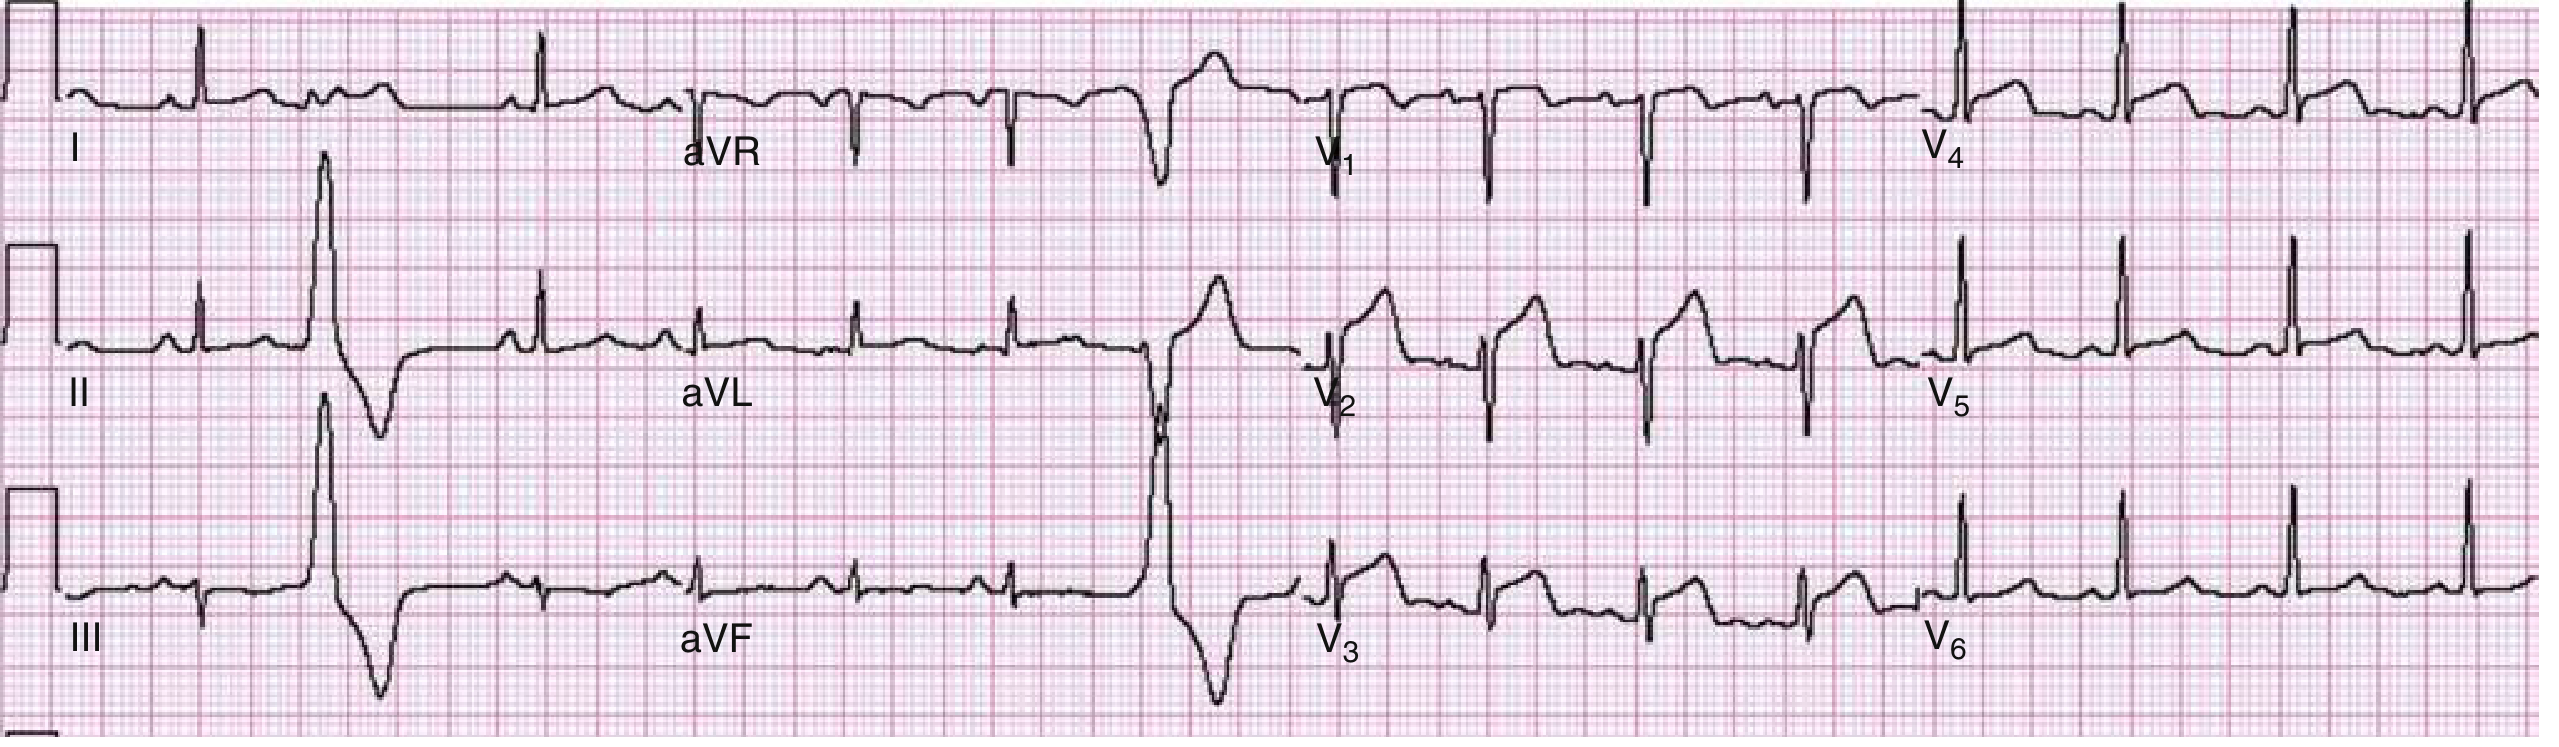
Anterolateral STEMI (V2-V6, I, aVL):
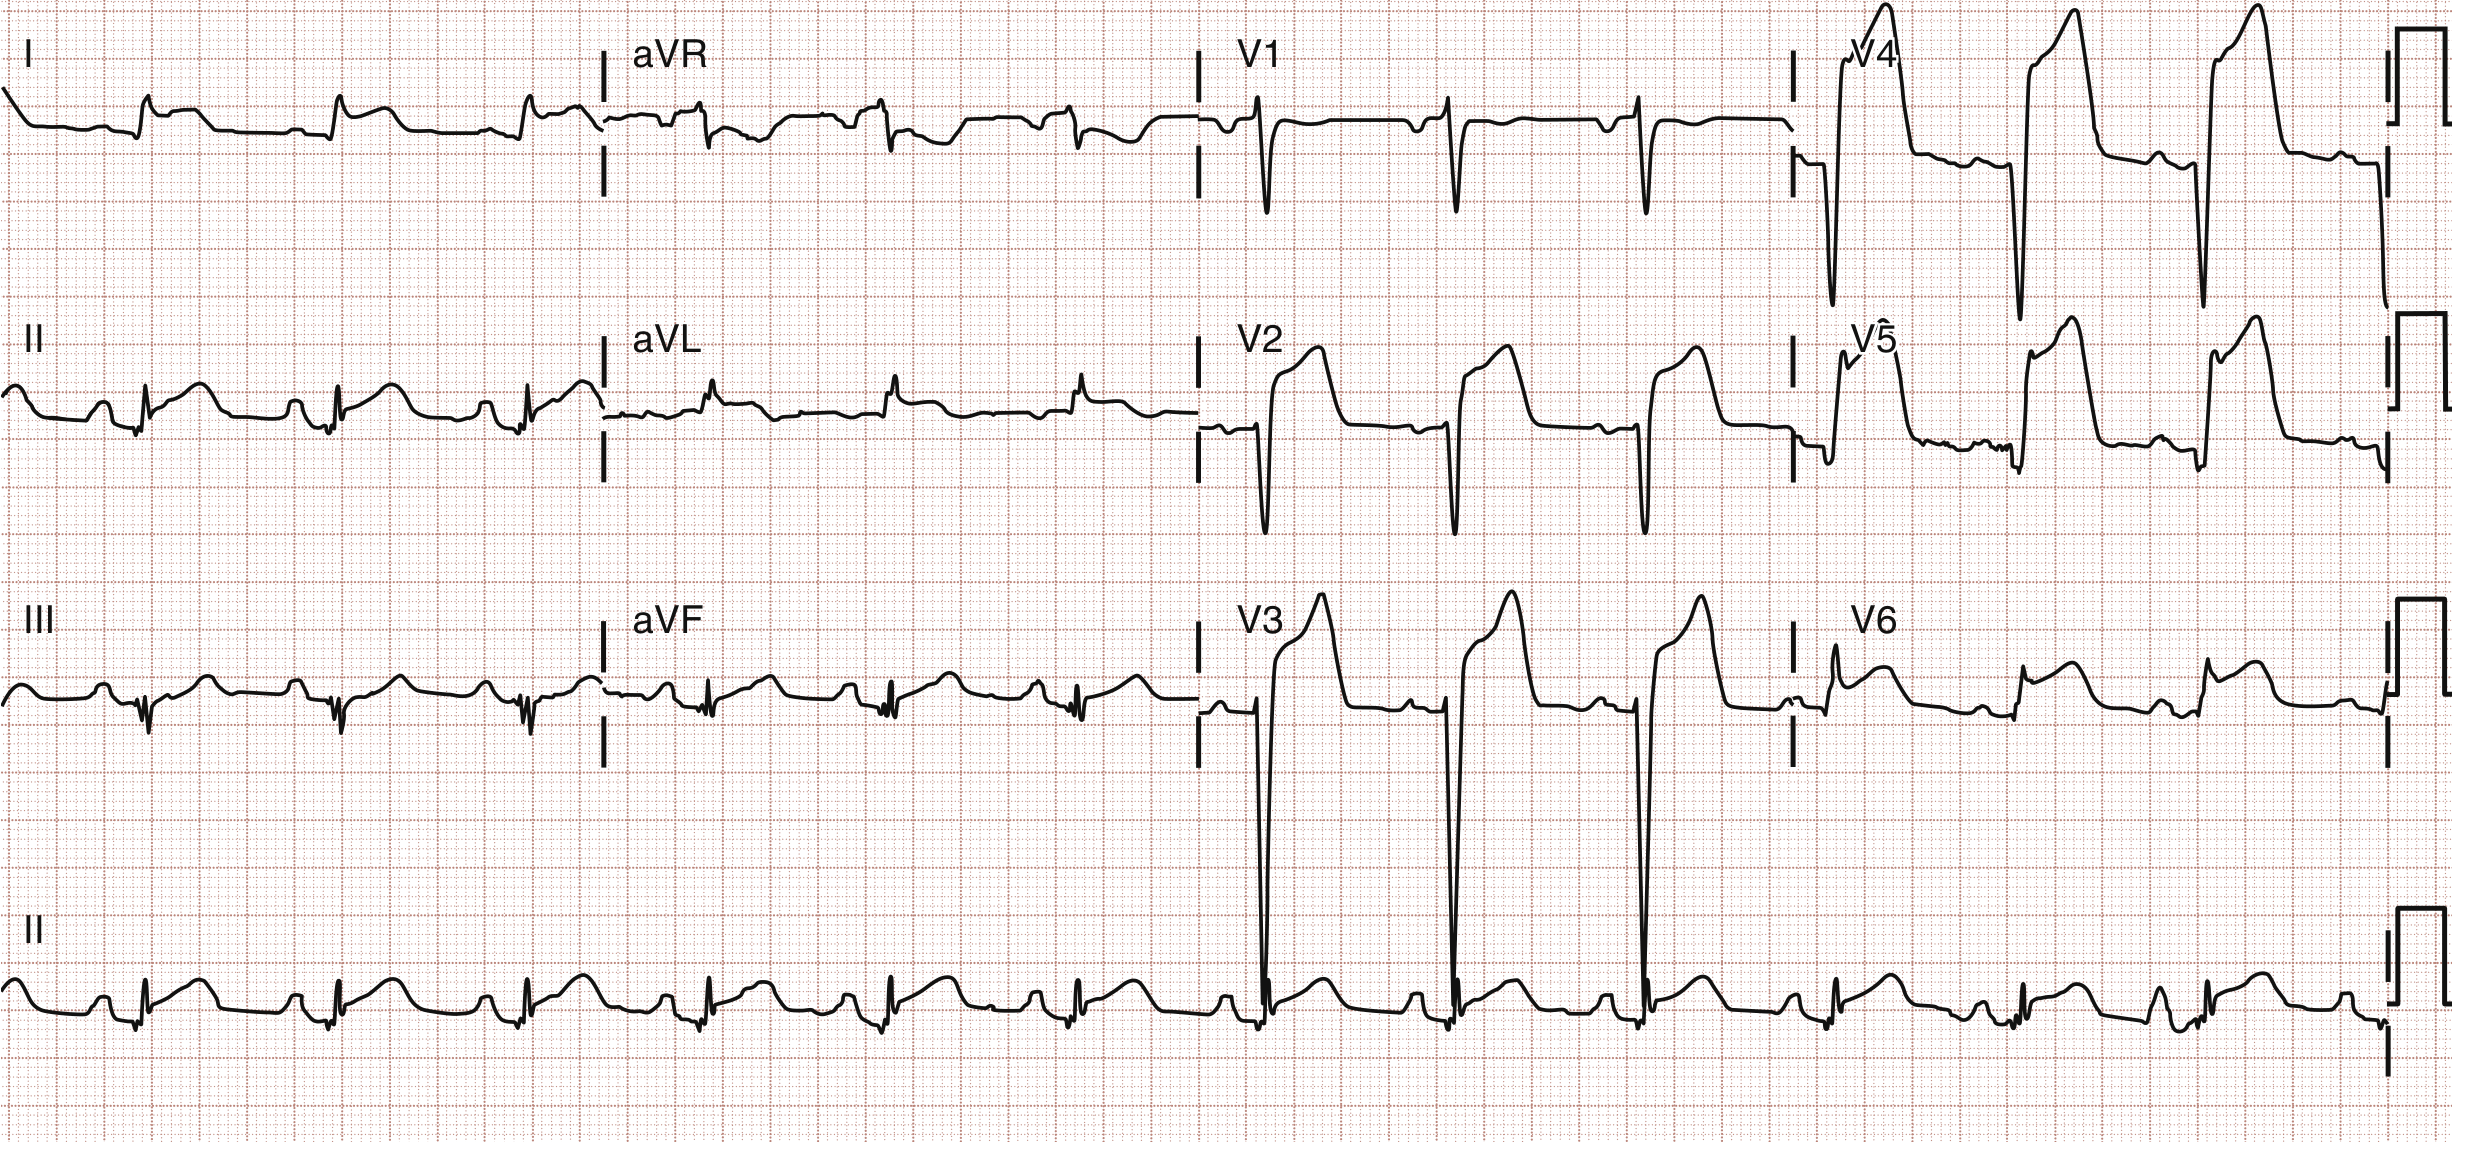
aVR Elevation - Left Main Occlusion:
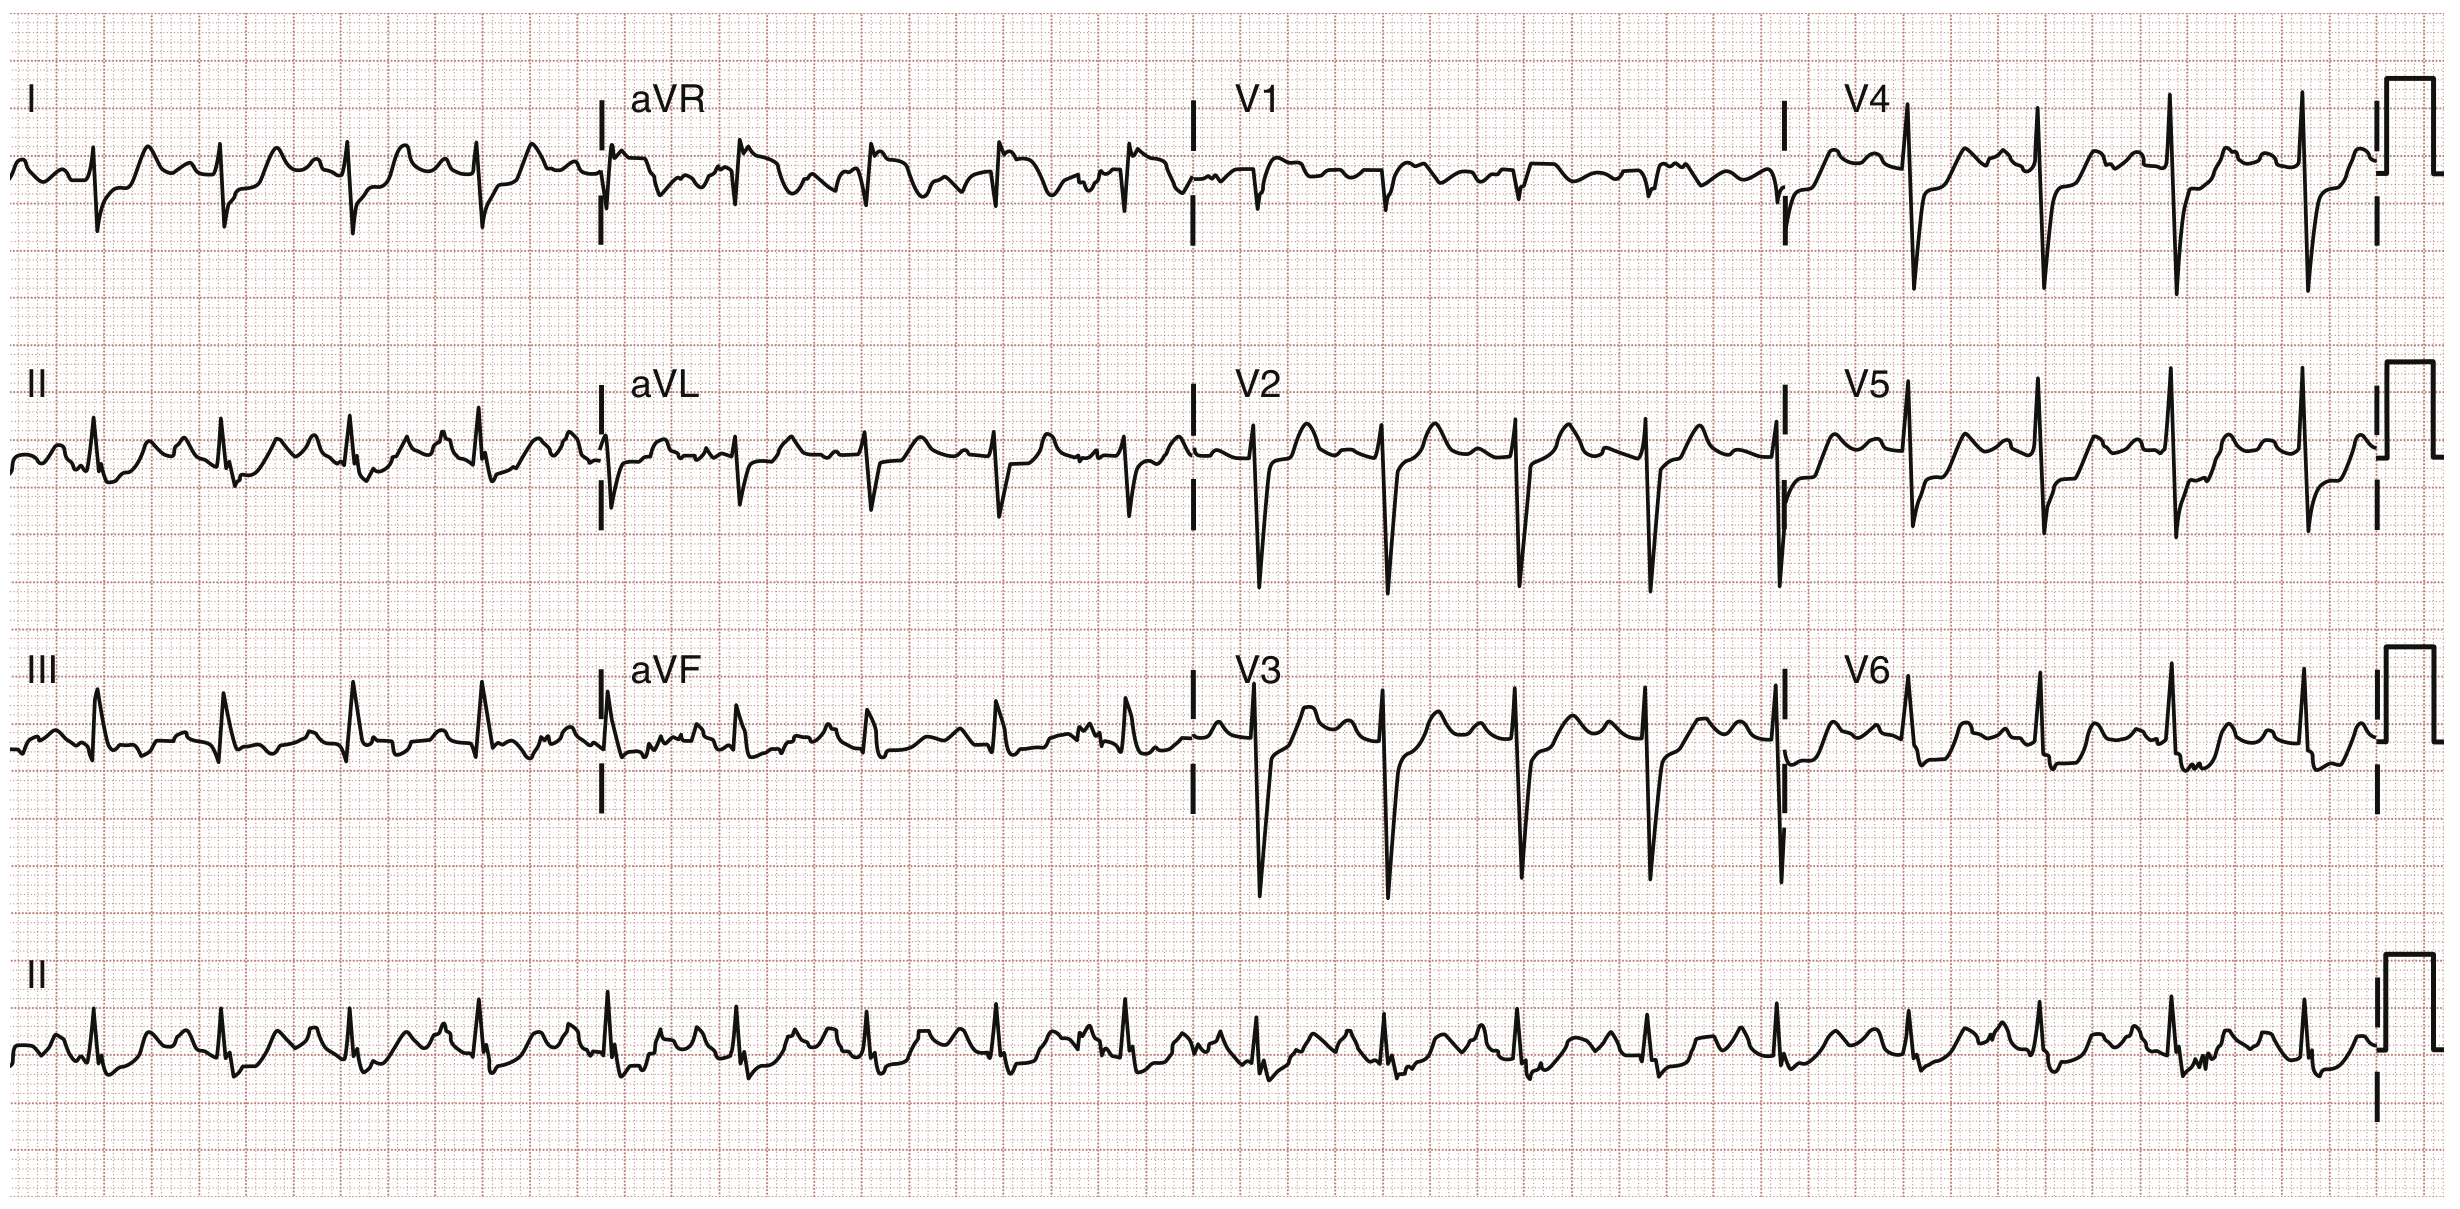
ICU Pearl - Inferior STEMI tips:
- STE greater in lead III than II → RCA occlusion (90% sensitive)
- STE in III > II + STE in V1 → concomitant right ventricular infarction (check right-sided leads V3R-V6R)
- STE in II > III → LCx occlusion more likely
- Always check: reciprocal ST depression in I and aVL confirms inferior STEMI
3B. ARRHYTHMIAS IN ICU
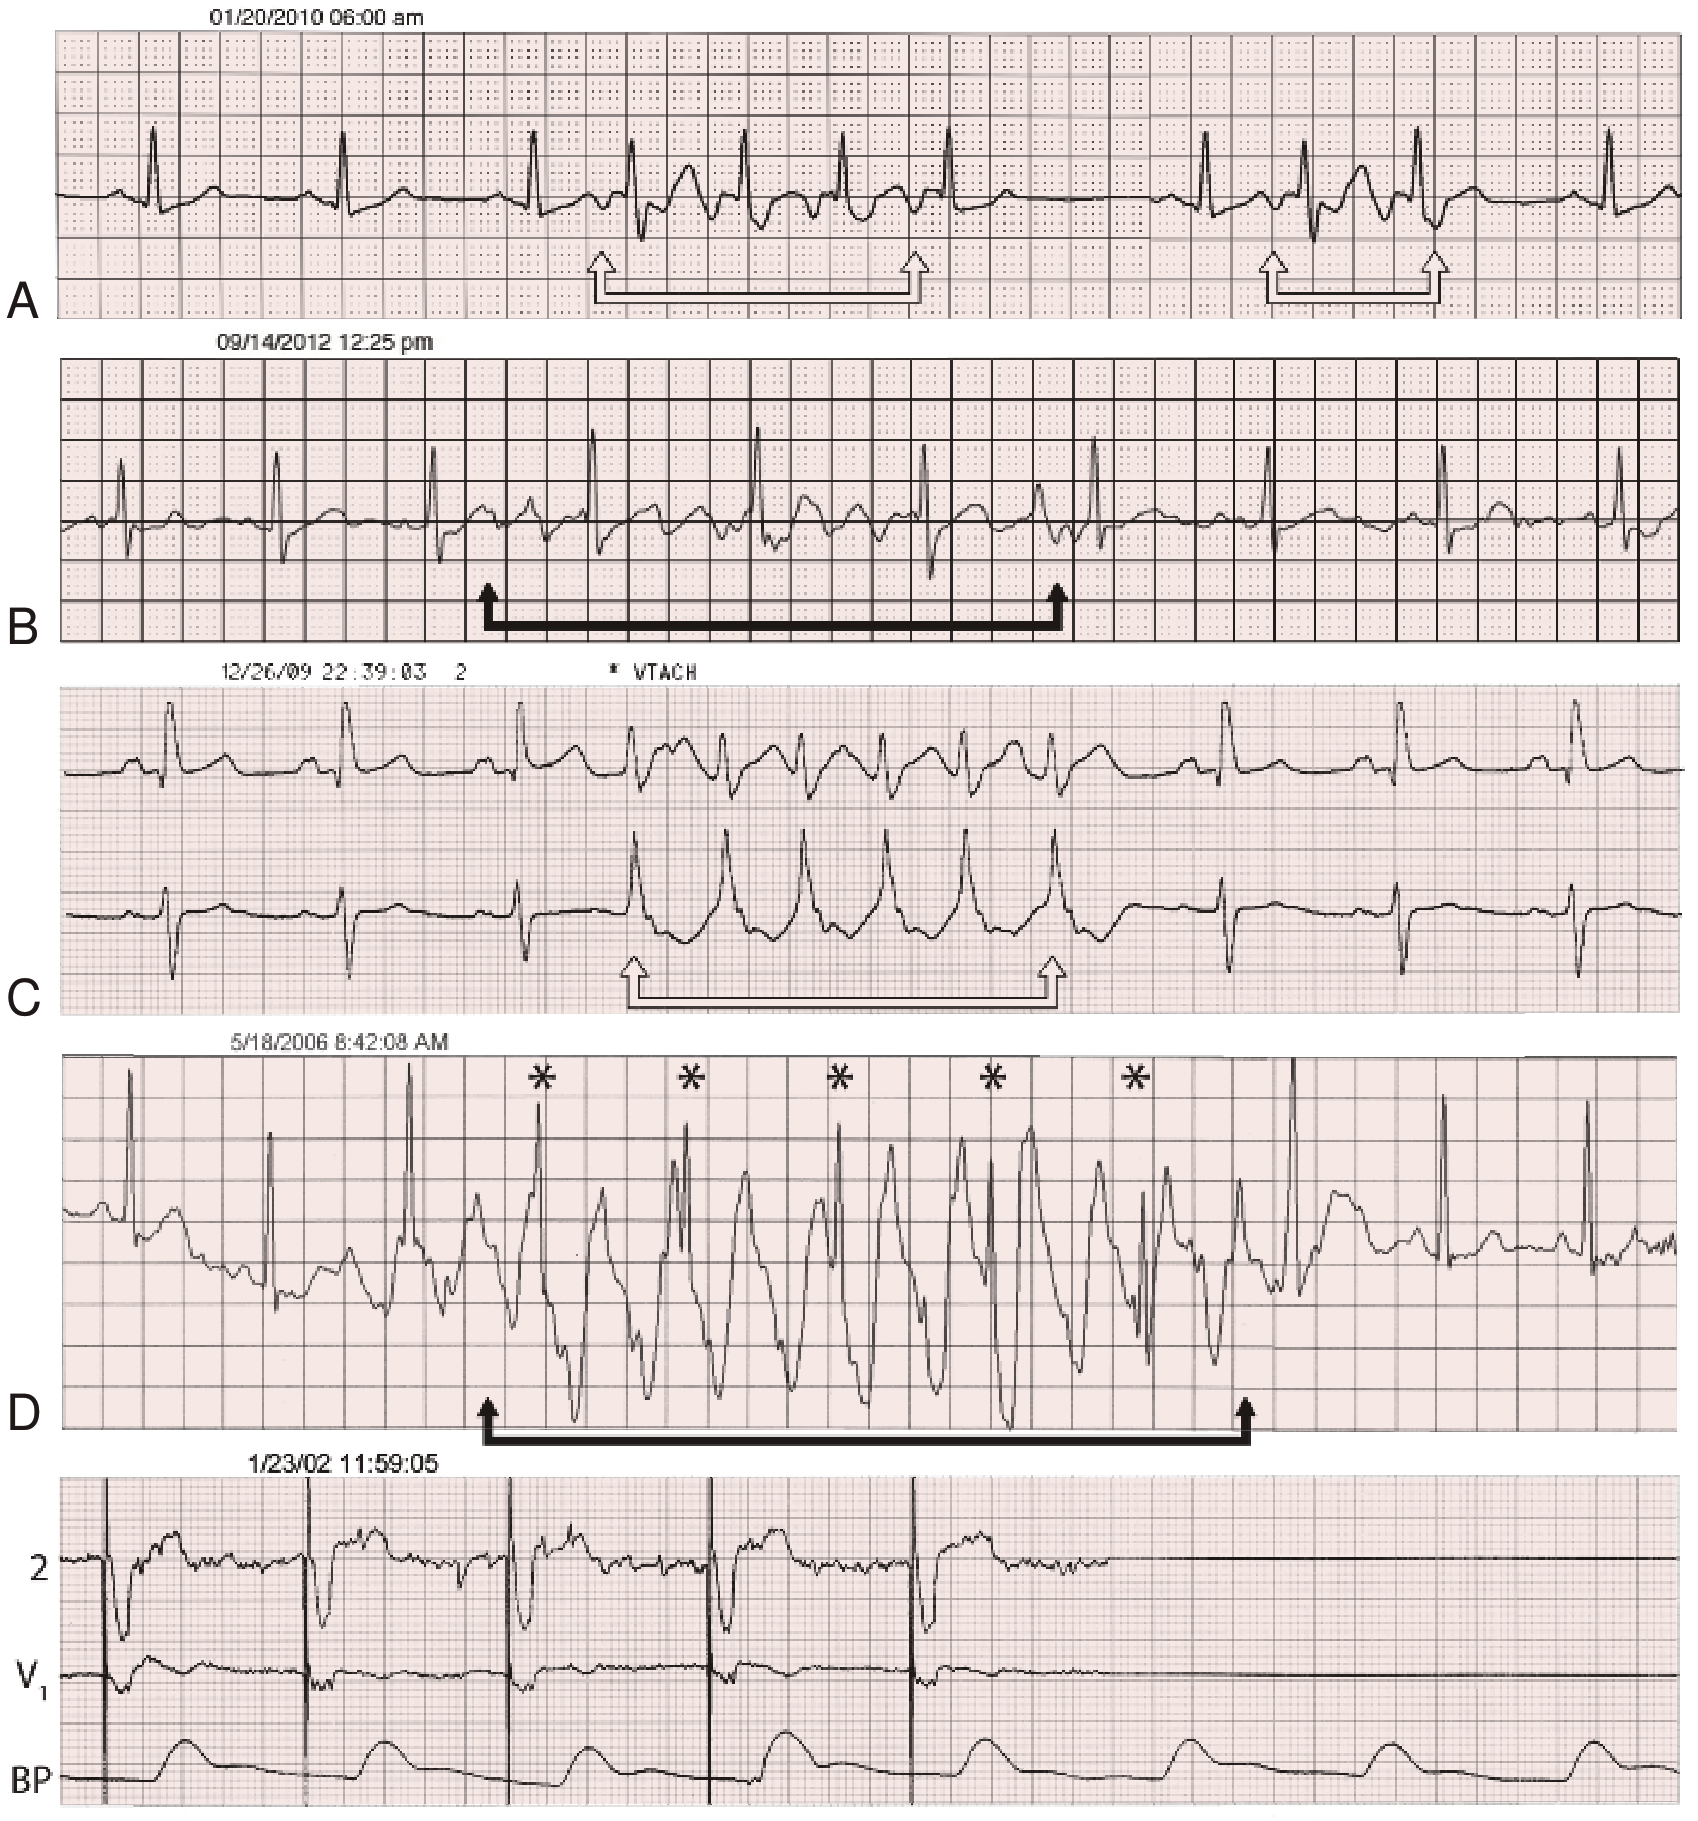
Key Arrhythmia Patterns:
Atrial Fibrillation:
- Irregularly irregular rhythm
- No distinct P waves - fibrillatory baseline
- Narrow QRS (unless aberrant conduction/WPW)
- Ventricular rate varies (uncontrolled = >100 bpm)
Atrial Flutter:
- "Sawtooth" flutter waves at ~300 bpm
- Usually 2:1, 3:1 or 4:1 block
- Ventricular rate typically 150 bpm (2:1 block)
Ventricular Tachycardia (VT):
- Wide QRS (>120 ms), rate >100 bpm
- AV dissociation (P waves independent of QRS)
- Fusion beats and capture beats confirm VT
- No P waves precede the QRS
Ventricular Fibrillation (VF):
- Chaotic, disorganized, no identifiable QRS
- No cardiac output - immediate defibrillation
AV Blocks (Critical ICU Recognition):
| Block | PR Interval | QRS | Features |
|---|---|---|---|
| 1st degree | >200 ms, constant | Normal | Benign, no treatment |
| 2nd degree Mobitz I (Wenckebach) | Progressive prolongation | Normal | PR lengthens then P drops |
| 2nd degree Mobitz II | Fixed PR | Normal or wide | Sudden non-conducted P - can progress to 3rd degree |
| 3rd degree (Complete) | No relationship | Wide (escape) or narrow (junctional) | P and QRS completely dissociated - emergent pacing |
3C. ELECTROLYTE ABNORMALITIES (Very Common in ICU)
Hyperkalemia - ECG Changes by Level:
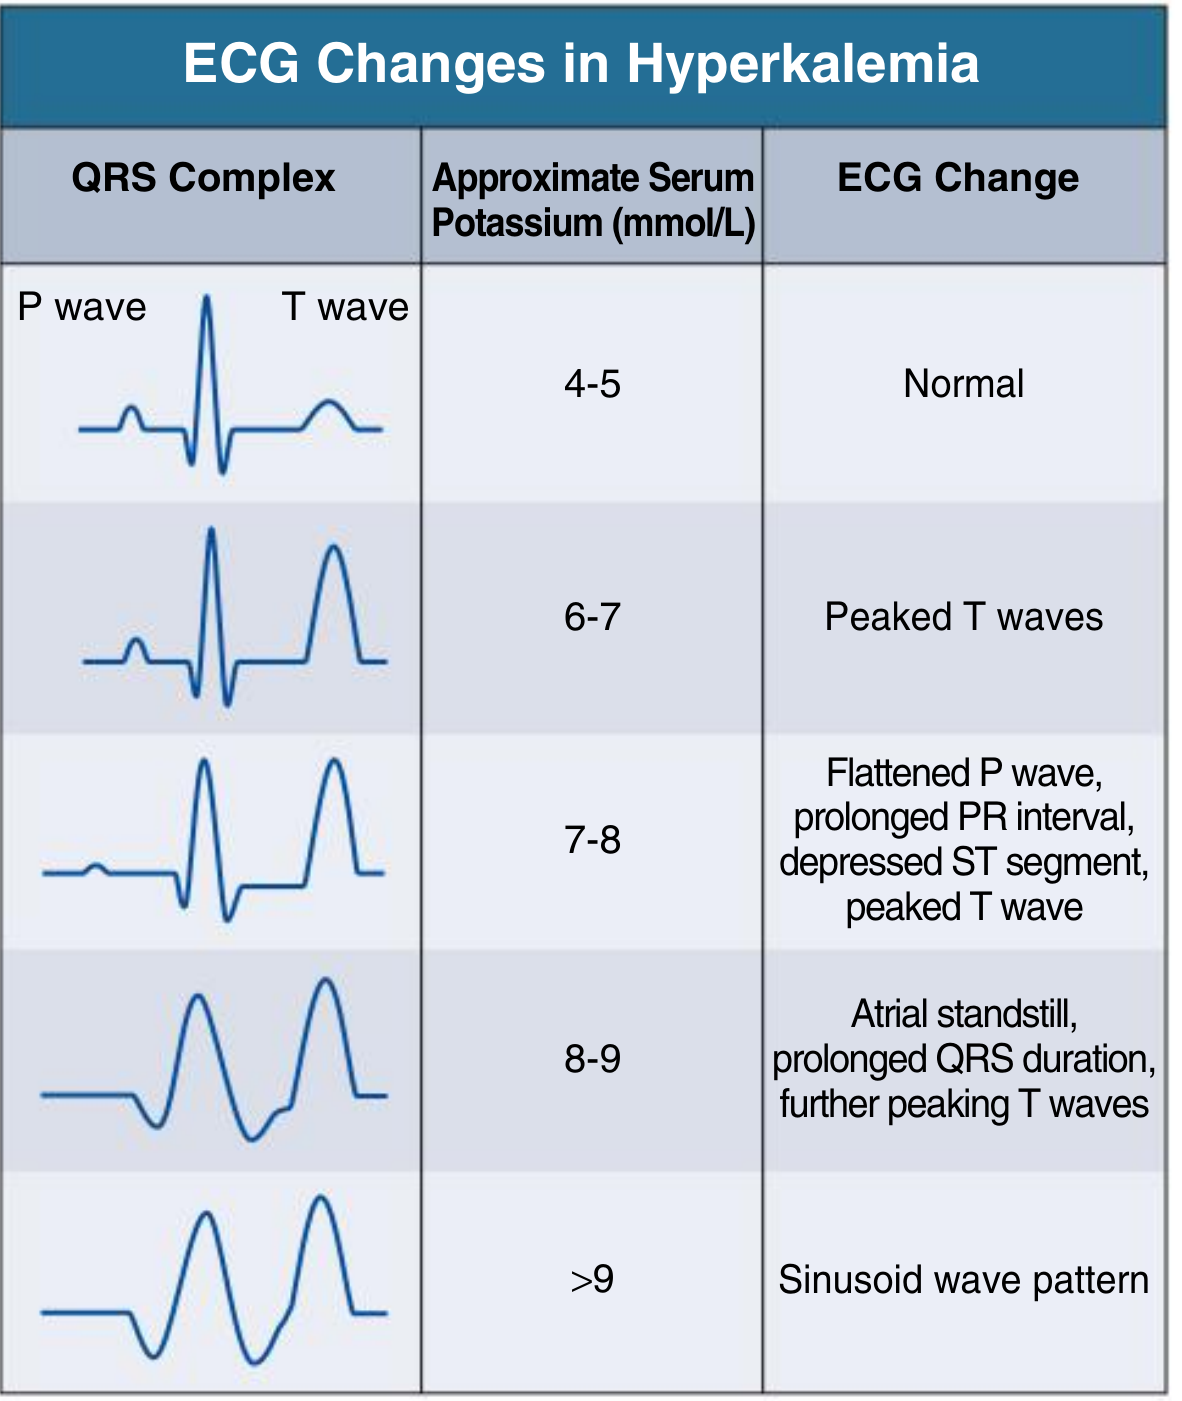
| K+ Level | ECG Change |
|---|---|
| 4-5 mmol/L | Normal |
| 6-7 mmol/L | Peaked/tented T waves (precordial leads most prominent) |
| 7-8 mmol/L | Flattened P waves, prolonged PR, depressed ST |
| 8-9 mmol/L | P wave disappears (atrial standstill), QRS widens |
| >9 mmol/L | Sine wave pattern → VF imminent |
ICU Pearl: The ECG does NOT always correlate perfectly with the K+ level. Any new ECG change + suspected hyperkalemia = treat immediately with calcium gluconate (membrane stabilization), insulin + dextrose, and prepare for dialysis if severe.
Hypokalemia ECG Changes:
- Flattened T waves
- Prominent U waves (a positive deflection after T wave, best seen in V2-V3)
- ST depression
- Prolonged QT (risk of Torsades de Pointes)
- Arrhythmias (especially with digoxin co-administration)
Hypercalcemia vs Hypocalcemia:
| Condition | QT/ST change |
|---|---|
| Hypercalcemia | Short QT interval |
| Hypocalcemia | Prolonged QT (due to prolonged ST segment) |
Hypomagnesemia:
- Prolonged QT
- Predisposes to Torsades de Pointes (treat with IV Magnesium sulfate 2g IV)
3D. OTHER CRITICAL ICU PATTERNS
Pulmonary Embolism - S1Q3T3 Pattern:
- S wave in lead I (deep)
- Q wave in lead III
- T wave inversion in lead III
- Right heart strain: T wave inversions V1-V4, new RBBB, sinus tachycardia
- Right axis deviation
Pericarditis:
- Saddle-shaped (concave) ST elevation in multiple leads (not fitting a coronary territory)
- PR segment depression (highly specific)
- No reciprocal ST depression (unlike STEMI)
- Diffuse involvement across many leads
Digoxin Toxicity:
- Reverse tick / Salvador Dali moustache sign - down-sloping ST depression
- Bradyarrhythmias, heart blocks
- Bidirectional VT (pathognomonic of severe toxicity)
Brugada Pattern (ICU alert - risk of sudden death):
- RBBB pattern in V1-V2
- ST elevation in V1-V3 with coved (Type 1) morphology
- Can cause VF/sudden death - needs electrophysiology referral
Hypothermia ECG Changes:
- Osborn (J) waves - positive deflection at the J point, most prominent in V3-V6
- Bradycardia, prolonged all intervals
- Atrial and ventricular arrhythmias
Pulmonary Hypertension / Cor Pulmonale:
- Right axis deviation (>+90)
- P pulmonale: tall, peaked P waves in lead II (>2.5 mm)
- Right ventricular hypertrophy (RVH): tall R in V1, deep S in V6
- T wave inversions V1-V3 (right heart strain)
PART 4 - ICU MONITORING ARTIFACTS
The ICU monitoring strip in Braunwald's (Fig. 61.11 above) illustrates a critical teaching point: not every "abnormal" pattern on continuous monitoring is a real arrhythmia. Before acting:
- Check the patient first (pulse, BP, clinical status)
- Check lead placement (loose leads = pseudo-arrhythmias)
- Compare with a simultaneous BP tracing - if the BP contour shows normal pulses, the heart is beating normally regardless of ECG appearance
- Get a proper 12-lead ECG to confirm any suspected arrhythmia
PART 5 - QUICK ICU ECG CHECKLIST
When you pick up an ECG in the ICU, go through this in 60 seconds:
1. Rate → <60 (brady) / 60-100 (normal) / >100 (tachy)
2. Rhythm → Regular? P before every QRS? QRS after every P?
3. PR interval → Normal 120-200ms? Prolonged = AV block?
4. QRS width → Narrow (<120ms) or wide (>120ms = BBB or VT)
5. ST segment → Elevation? Depression? Which leads?
6. T waves → Peaked? Inverted? Flat? U waves?
7. QT interval → Prolonged? (QTc > 440ms men, > 460ms women)
8. Overall → Ischemia / Electrolyte / Arrhythmia / Device
Sources:
- Costanzo Physiology, 7th Ed - ECG waveform physiology
- Rosen's Emergency Medicine - STEMI localization, ECG differential
- Braunwald's Heart Disease, 2-Vol Set - Arrhythmia ECG monitoring
- Comprehensive Clinical Nephrology, 7th Ed - Electrolyte ECG changes
---This covers everything you need for ECG interpretation in the ICU. Here's a quick summary of what was covered:
What's in this guide:
-
ECG Basics - The P-QRS-T waveform with a real textbook diagram, normal values for every interval, and how to calculate heart rate
-
Systematic Reading - The RRATE checklist so you never miss anything when reading an ICU ECG
-
STEMI Localization - A complete lead-to-territory-to-artery table with actual 12-lead ECG images showing anterior STEMI, anterolateral STEMI, and the critical left main occlusion pattern (aVR elevation + widespread depression)
-
Arrhythmias - AF, flutter, VT, VF, and all 4 degrees of AV block in a quick comparison table; plus a real monitor strip showing how to distinguish true arrhythmias from ICU artifacts
-
Electrolyte changes - The hyperkalemia progression chart (from peaked T waves at K 6-7 to sine wave at K >9) with the actual image, plus hypokalemia U waves, hypocalcemia long QT, and hypomagnesemia Torsades risk
-
Other ICU patterns - PE (S1Q3T3), pericarditis (saddle-shaped STE + PR depression), Brugada, hypothermia Osborn waves, digoxin toxicity
-
Artifact recognition - Why you should always check the patient before treating a monitor alarm
Let me know if you want me to expand on any specific section - for example AV blocks with strip examples, bundle branch block criteria, or pacemaker ECGs.
This is a shared conversation. Sign in to Orris to start your own chat.