
How to give injection insulin 70/30?
insulin injection technique subcutaneous administration
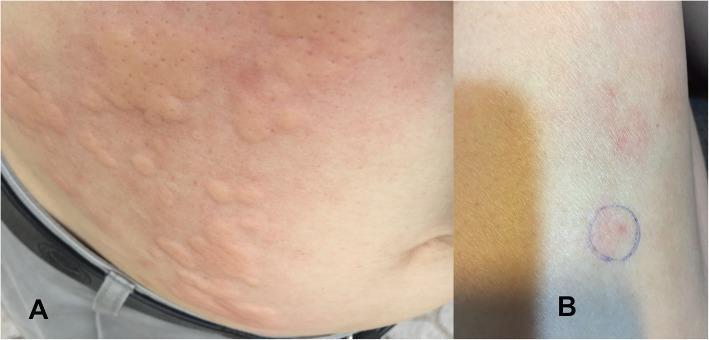
This composite clinical photograph illustrates two types of cutaneous allergic reactions to subcutaneous insulin administration in a patient with type 2 diabetes. Panel A shows a generalized urticarial reaction on the abdominal wall surrounding the umbilicus. Visually, this is characterized by multiple raised, pale-pink wheals of varying sizes and shapes, with some appearing confluent, surrounded by diffuse erythema (flares). The morphology is typical of a Type I hypersensitivity reaction. Panel B demonstrates a localized cutaneous reaction on the upper right thigh at an injection site. This milder presentation consists of localized erythema and slight edema; a specific point of interest is demarcated with a blue ink circle to highlight the injection site reaction. These images serve as educational visual aids for identifying common dermatological manifestations of insulin allergy, ranging from widespread urticaria to localized injection-site swelling and erythema.
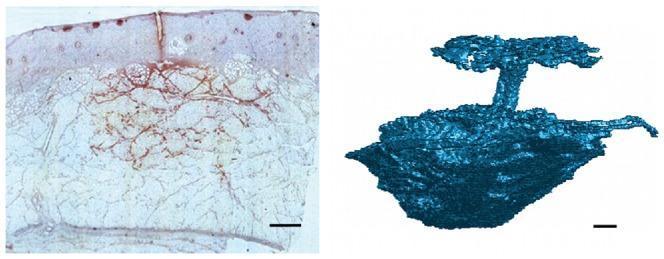
A multi-modal educational visual comparing the subcutaneous distribution of injected insulin. The left panel shows a histological cross-section (light microscopy/immunohistochemistry) of adipose tissue. The dermis is visible as the superior layer, while the injected insulin is stained red, demonstrating its distribution within the fat lobules and the formation of a localized depot. The right panel displays a segmented 3D tomographic reconstruction from an X-ray CT scan of a similar injection. This 3D model illustrates the irregular, somewhat spherical morphology of the injection depot, the vertical injection channel created by the needle, and backflow at the skin surface. The contrast in the CT scan is achieved using an iodine-based agent mixed with the drug. Scale bars of 1 mm are present in both images. This comparison is used to study tissue mechanics, drug delivery patterns, and the localized pressure effects of subcutaneous injections in pharmaceutical research.
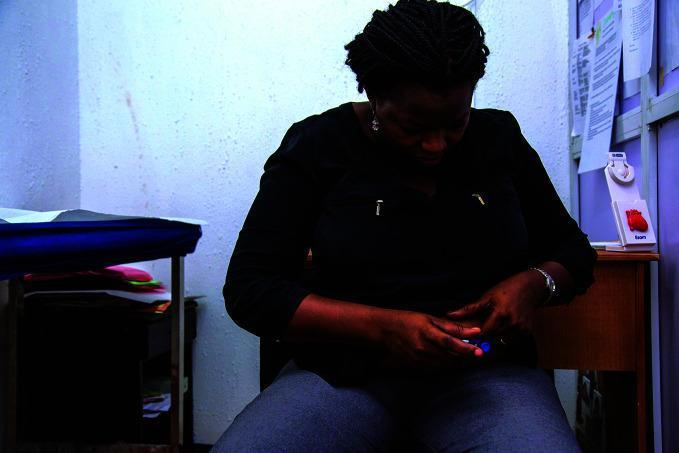
This clinical photograph illustrates a patient self-administering medication, specifically an insulin injection, using an insulin pen device. The image shows a woman in a clinical setting at the Rainbow Specialist Medical Center, focusing on the manual dexterity and technique required for subcutaneous injection in the abdominal region. The patient is holding a blue-capped insulin delivery device with both hands, positioned against the abdomen. The clinical environment is evidenced by the presence of a medical examination table with blue draping, anatomical models (a heart model), and clinical documents in the background. This visual serves as an educational example of diabetes self-management, patient education, and the use of medical devices in a real-world primary care or specialist setting. The photograph emphasizes the practical aspect of chronic disease management and the importance of patient autonomy in endocrinology and metabolic health.
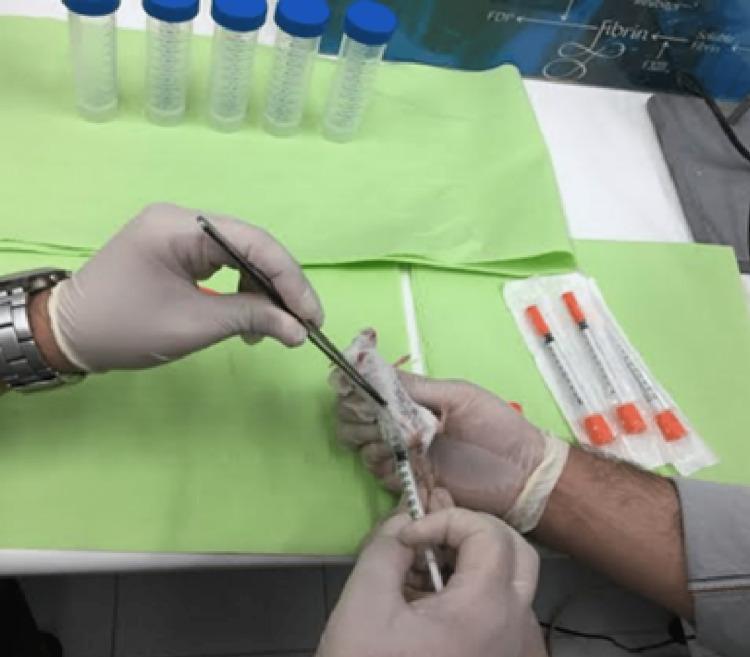
A clinical photograph depicting a laboratory setup for an in vivo cancer research procedure. The image shows an operator performing a subcutaneous injection into the mammary fat pad of a light-colored laboratory mouse. The mouse is positioned on its back on a green surgical drape, held securely by a gloved hand and specialized forceps for precision. A 1 ml insulin syringe with a fine-gauge needle is visible at the injection site. The procedural environment includes five blue-capped centrifuge tubes arranged in a row and three sterile, individually wrapped insulin syringes with orange caps to the right. This visual demonstrates the methodology for tumor cell inoculation, specifically Triple-Negative Breast Cancer (TNBC) cell lines like MDA-MB 231, to establish animal models for oncological study. The use of aseptic technique, including gloves and drapes, is evident, highlighting the standard protocol for laboratory animal interventions in biomedical research.
insulin injection site rotation diagram abdomen thigh arm
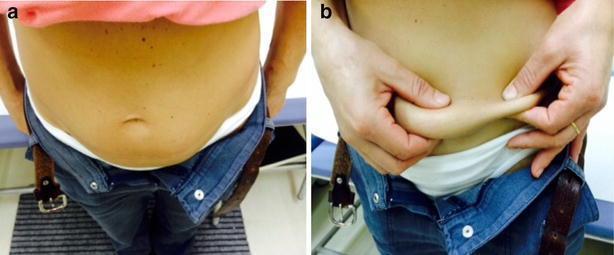
This clinical photograph displays a side-by-side comparison of insulin-induced lipohypertrophy on the abdominal wall of a patient with diabetes. Panel (a) illustrates the macroscopic appearance of the abdomen, showing moderate, generalized swelling and a rounded contour below the umbilicus, consistent with a localized accumulation of subcutaneous fat ('skin plate') at a frequent insulin injection site. Panel (b) demonstrates the clinical 'pinch test' for diagnostic assessment. The left side shows a significantly thicker, denser fold of tissue when the lipohypertrophic area is squeezed, while the contralateral side, where injections are avoided, results in a normal, markedly thinner skin fold. These visual findings emphasize the importance of injection site rotation to prevent abnormal adipose tissue proliferation. The images serve as an educational tool for healthcare professionals and patients to identify lipohypertrophy through inspection and palpation, highlighting the morphological differences between pathological and healthy subcutaneous tissue.
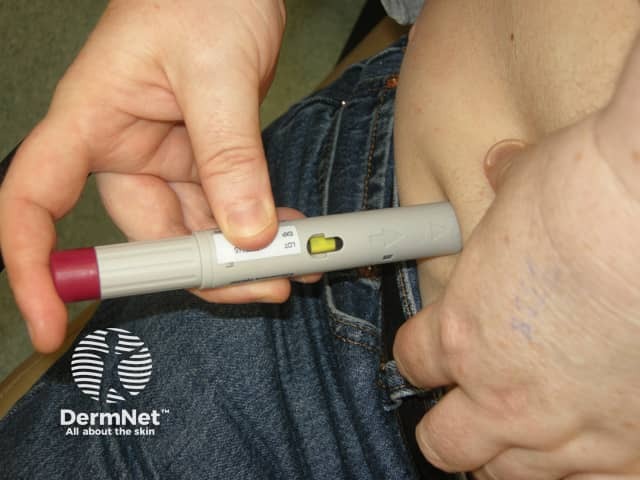
This image depicts a clinical photography of a subcutaneous injection being administered with a disposable pen-type injector. The device features a dose dial and a plunger, with a yellow indicator visible near the advance mechanism. A clinician or patient stabilizes the skin with the non-dominant hand by pinching subcutaneous tissue, while the dominant hand positions and depresses the plunger to deliver medication into the adipose layer. The needle enters the skin at a near perpendicular angle (approximately 90 degrees) to deposit the drug into subcutaneous fat for slower absorption. The abdomen is a common site for injections, but other practical regions include the outer thigh or upper arm; site rotation is advised to minimize lipohypertrophy and ensure consistent pharmacokinetics. After needle insertion and dose delivery, the device is withdrawn and the skin is gently blotted to reduce bleeding. The procedure emphasizes correct technique, avoiding intramuscular injection, excessive tissue compression, or needle bending. This image is a useful educational resource for medical trainees, diabetic patients, and healthcare professionals to practice safe subcutaneous administration, review needle depth and angle, and reinforce dose accuracy and device function. The DermNet watermark indicates dermatology education and skin-focused clinical documentation.
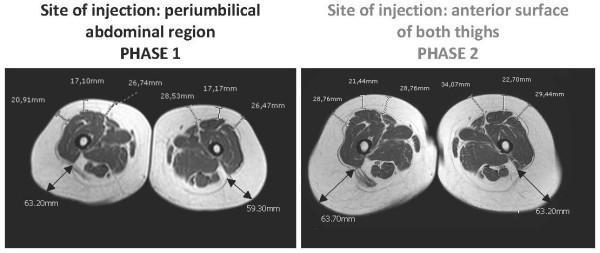
This diagnostic image consists of axial T1-weighted MRI cross-sections of the bilateral thighs, illustrating medication-induced lipohypertrophy. The image is divided into two comparative panels: Phase 1 (injection site: abdomen) and Phase 2 (injection site: anterior thighs), demonstrating the local adipose tissue response to Pegvisomant therapy. Quantitative annotations show measurements of subcutaneous fat thickness and overall thigh circumference. In Phase 1, subcutaneous fat thickness ranges from 17.10 mm to 28.53 mm. In Phase 2, following the change of the injection site to the thighs, there is a visible and measurable increase in subcutaneous fat, with values reaching up to 34.07 mm. Total thigh circumference also demonstrates an increase, with Phase 2 measurements (63.20 mm - 63.70 mm) exceeding those in Phase 1 (59.30 mm - 63.20 mm). The central muscle mass and femoral cortical bone remain largely unchanged, emphasizing that the hypertrophy is localized to the subcutaneous adipose layer. This comparison illustrates the reversibility and site-specific recurrence of lipohypertrophy associated with growth hormone receptor antagonist injections.
How to Give Insulin 70/30 Injection
What Is Insulin 70/30?
- 70% NPH (intermediate-acting, basal coverage)
- 30% Regular insulin (short-acting, mealtime coverage)
Step-by-Step Injection Technique
Step 1: Gather Supplies
- Insulin vial or pen
- Insulin syringe (if using vial) - U-100, 28-31 gauge
- Alcohol swabs
- Sharps disposal container
Step 2: Prepare the Insulin
- Gently roll the vial between your palms 10 times, or tip the pen back and forth 10-20 times to re-suspend the NPH component - it settles and appears cloudy/milky.
- Do NOT shake vigorously - this creates bubbles and can damage the insulin.
- Inspect: the insulin should look uniformly milky/white with no clumps or particles.
- Wipe the rubber stopper with an alcohol swab.
Step 3: Draw Up the Dose (if using a vial + syringe)
- Draw air into the syringe equal to your prescribed dose.
- Insert the needle into the vial and inject the air.
- Turn the vial upside down and draw out your dose.
- Tap the syringe to bring any bubbles to the top, then push them out.
Step 4: Choose and Prepare the Injection Site
| Site | Absorption | Recommended Use |
|---|---|---|
| Abdomen (2 inches from navel) | Fastest (20-30% faster than arm) | Morning dose (preferred) |
| Outer thigh | Moderate | Afternoon/evening dose |
| Outer upper arm | Moderate | Alternate site |
| Buttocks | Slowest | Less common |
- Rotate sites within the same area to prevent lipohypertrophy (fat buildup) or lipoatrophy.
- Avoid injecting into lumpy, scarred, or bruised skin.
- Clean the area with an alcohol swab and let it dry.
Step 5: Inject
- Pinch a fold of skin between thumb and index finger (especially if lean, to avoid intramuscular injection).
- Insert the needle at 90 degrees (or 45 degrees in very thin patients) into the fold.
- Push the plunger slowly and steadily until the full dose is delivered.
- If using a pen, hold for 10 seconds after injecting before withdrawing - this prevents insulin from leaking back out.
- Release the skin fold, then withdraw the needle.
- Do NOT rub the injection site (rubbing speeds absorption unpredictably).
Timing of Injection
| Insulin Type | When to Inject |
|---|---|
| Human 70/30 (Humulin/Novolin) | 30 minutes BEFORE the meal |
| Analog 70/30 (Novolog Mix) | 15 minutes BEFORE the meal |
Dosing Schedule
Important Safety Points
- Never skip a meal after injecting 70/30 - the regular component will cause hypoglycemia if food is not eaten.
- Store unopened vials/pens in the refrigerator (2-8°C). The in-use vial/pen can be kept at room temperature for up to 28 days.
- Never freeze insulin.
- Check blood glucose before each injection.
- Recognize signs of hypoglycemia: shakiness, sweating, dizziness, confusion - treat with 15g fast-acting carbohydrates (glucose tablets, juice).
- Do not mix 70/30 with other insulins in the same syringe.
- Use a new needle for every injection.
Common Mistakes to Avoid
- Skipping the rolling/mixing step (NPH settles to the bottom)
- Injecting too close to the previous site
- Injecting into lipohypertrophic (lumpy) areas - insulin absorbs erratically there
- Not waiting the full 30 minutes before eating (for human 70/30)
- Reusing needles (increases pain and infection risk)
Note: Always follow the specific instructions given by your healthcare provider, as doses and timing may be adjusted based on your individual blood glucose patterns.
Basal Bolus regime
basal bolus insulin regimen diagram physiological secretion
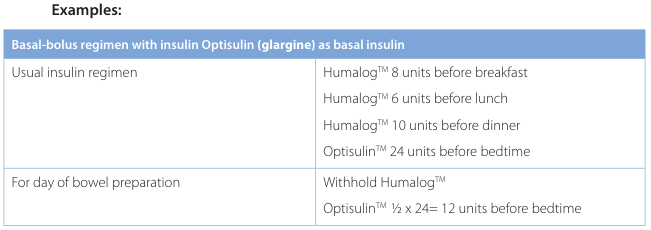
Examples: <table><thead><tr><th colspan="2">Basal-bolus regimen with insulin Optisulin (glargine) as basal insulin</th></tr></thead><tbody><tr><td>Usual insulin regimen</td><td>Humalog™ 8 units before breakfast<br>Humalog™ 6 units before lunch<br>Humalog™ 10 units before dinner<br>Optisulin™ 24 units before bedtime</td></tr><tr><td>For day of bowel preparation</td><td>Withhold Humalog™<br>Optisulin™ ½ x 24= 12 units before bedtime</td></tr></tbody></table>
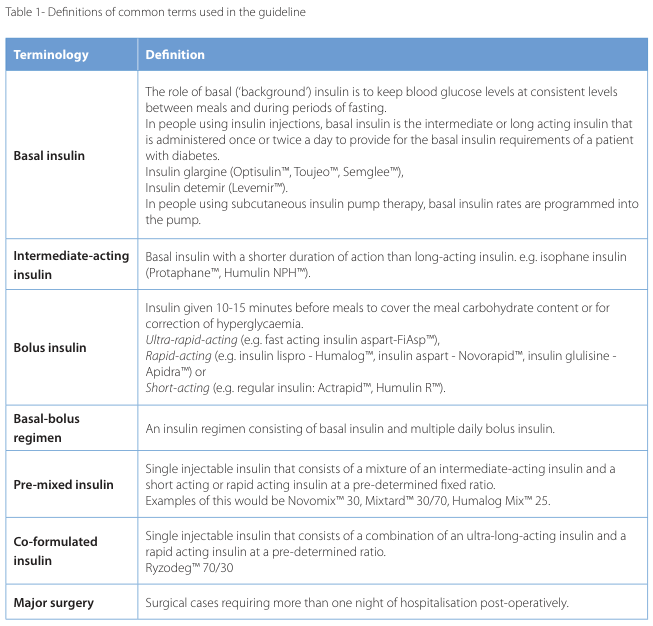
Table 1- Definitions of common terms used in the guideline <table><thead><tr><th>Terminology</th><th>Definition</th></tr></thead><tbody><tr><td>Basal insulin</td><td>The role of basal ('background') insulin is to keep blood glucose levels at consistent levels between meals and during periods of fasting.<br>In people using insulin injections, basal insulin is the intermediate or long acting insulin that is administered once or twice a day to provide for the basal insulin requirements of a patient with diabetes.<br>Insulin glargine (Optisulim™, Toujeo™, Semglee™),<br>Insulin detemir (Levemir™).<br>In people using subcutaneous insulin pump therapy, basal insulin rates are programmed into the pump.</td></tr><tr><td>Intermediate-acting insulin</td><td>Basal insulin with a shorter duration of action than long-acting insulin, e.g. isophane insulin (Protaphane™, Humulin NPH™).</td></tr><tr><td>Bolus insulin</td><td>Insulin given 10-15 minutes before meals to cover the meal carbohydrate content or for correction of hyperglycaemia.<br>Ultra-rapid-acting (e.g. fast acting insulin aspart-FiAsp™),<br>Rapid-acting (e.g. insulin lispro - Humalog™, insulin aspart - Novorapid™, insulin glulisine - Apidra™) or<br>Short-acting (e.g. regular insulin: Actrapid™, Humulin R™).</td></tr><tr><td>Basal-bolus regimen</td><td>An insulin regimen consisting of basal insulin and multiple daily bolus insulin.</td></tr><tr><td>Pre-mixed insulin</td><td>Single injectable insulin that consists of a mixture of an intermediate-acting insulin and a short acting or rapid acting insulin at a pre-determined fixed ratio.<br>Examples of this would be Novomix™ 30, Mixtard™ 30/70, Humalog Mix™ 25.</td></tr><tr><td>Co-formulated insulin</td><td>Single injectable insulin that consists of a combination of an ultra-long-acting insulin and a rapid acting insulin at a pre-determined ratio.<br>Ryzodeg™ 70/30</td></tr><tr><td>Major surgery</td><td>Surgical cases requiring more than one night of hospitalisation post-operatively.</td></tr></tbody></table>
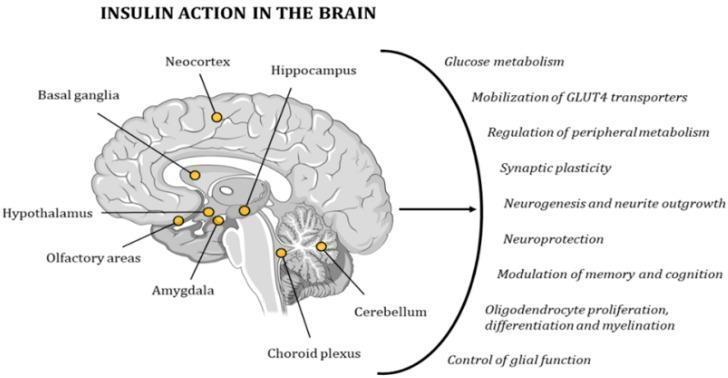
An anatomical diagram titled 'INSULIN ACTION IN THE BRAIN' illustrating the distribution of insulin receptors (IRs) and the physiological effects of insulin in the human central nervous system. The left side of the diagram features a sagittal section of the brain with yellow points indicating regions of high IR concentration, including the neocortex, hippocampus, basal ganglia, hypothalamus, olfactory areas, amygdala, choroid plexus, and cerebellum. An arrow points from this anatomical model to a list on the right, which outlines the multi-faceted roles of central insulin action. Key functions identified include the modulation of glucose metabolism, mobilization of GLUT4 transporters, and regulation of peripheral metabolism. The diagram also highlights insulin's impact on neuroplasticity and maintenance, specifically synaptic plasticity, neurogenesis, neurite outgrowth, neuroprotection, and the modulation of memory and cognition. Additionally, it notes insulin's role in oligodendrocyte health (proliferation, differentiation, and myelination) and the control of glial function. This educational infographic is designed to demonstrate the critical importance of insulin signaling for cognitive activity and neurological homeostasis.
Basal-Bolus Insulin Regime
The Concept
- Basal insulin = background secretion that suppresses hepatic glucose output and maintains fasting glucose between meals and overnight
- Bolus insulin = mealtime surge to handle carbohydrate influx from food

Insulin Types Used
Basal Insulin (Long-Acting)
| Insulin | Onset | Peak | Duration |
|---|---|---|---|
| Glargine (Lantus/Toujeo) U100 | 1.5-2 hrs | Peakless | 16-20 hrs |
| Glargine U300 (Toujeo) | 1.5-2 hrs | Peakless | 30-36 hrs |
| Detemir (Levemir) | 1.5-2 hrs | Peakless | 16-20 hrs |
| Degludec (Tresiba) U100/U200 | 1.5-2 hrs | Peakless | 36-40 hrs |
| NPH (intermediate) | 2-4 hrs | 6-10 hrs | 16-20 hrs |
Bolus Insulin (Rapid-Acting)
| Insulin | Onset | Peak | Duration |
|---|---|---|---|
| Lispro (Humalog), Aspart (NovoRapid), Glulisine (Apidra) | 15-30 min | 30-90 min | 3-4 hrs |
| Regular insulin (short-acting) | ~30 min | 2-4 hrs | 5-8 hrs |
How to Calculate the Regime (Step-by-Step)
Step 1: Total Daily Dose (TDD)
TDD = Weight (kg) × 0.5 to 0.7 units/kg/day
- In Type 1 DM: typically 0.3-1.0 unit/kg/day
- Example: 70 kg patient → TDD = 70 × 0.7 = 49 units/day
Step 2: Divide TDD Between Basal and Bolus
| Component | Proportion | Example (TDD 50 units) |
|---|---|---|
| Basal insulin | 50% of TDD | 25 units (once daily at night) |
| Bolus insulin | 50% of TDD | 25 units total |
| Per meal bolus (÷3 meals) | ~0.1 units/kg/meal | ~8 units before each meal |
- Some patients may need a 40% basal / 60% bolus split, especially with high carbohydrate intake.
- Basal insulin is given at a consistent time each day (usually bedtime or morning).
- Titrate basal by +1 unit/day until fasting blood glucose < 100 mg/dL.
Step 3: Mealtime Bolus Dosing
Bolus = 0.1 units/kg/meal
1 unit for every 10-15 g of carbohydrate
- Give bolus 15 minutes before a meal (rapid-acting analogue)
- If pre-meal glucose < 80 mg/dL, give at the onset of the meal
- Regular insulin: give 30 minutes before the meal
| Meal Size | Dose Adjustment |
|---|---|
| Standard meal | No change |
| Very large meal with dessert | +3 units |
| Large meal without dessert | +1 to +2 units |
| Smaller than usual meal | -1 to -2 units |
Step 4: Correction (Supplemental) Dose
ISF = 1800 ÷ TDD
- TDD = 70 units → ISF = 1800/70 = 25 mg/dL per unit
- Pre-meal glucose = 250 mg/dL; target = 150 mg/dL
- Correction dose = (250 - 150) ÷ 25 = 4 units
- Give this in addition to the mealtime bolus
Step 5: Fine-Tuning with Structured SMBG
| Δ (post-meal - pre-meal) | Interpretation | Action |
|---|---|---|
| 0 to +50 mg/dL | Target range | No change |
| > +50 mg/dL consistently | Under-dosed bolus | Increase by 1-2 units |
| Negative Δ (e.g. -25 mg/dL) | Hypoglycemia risk | Decrease by 1-2 units, recheck in 1 hr |
Typical Daily Schedule
| Time | Action |
|---|---|
| Before breakfast | Check BG; give breakfast bolus (± correction) |
| Before lunch | Check BG; give lunch bolus (± correction) |
| Before dinner | Check BG; give dinner bolus (± correction) |
| Bedtime | Check BG; give basal insulin (glargine/detemir) |
Advantages Over Premixed Insulins
- Greater flexibility - dose can be adjusted for each meal independently
- Better postprandial glucose control
- Can accommodate variable meal sizes and timing
- Allows exercise adjustments
- Achieves lower HbA1c with less hypoglycemia when properly managed
Special Considerations
- Sick day rules: Reduce bolus if eating less; do NOT stop basal insulin (risk of DKA)
- Exercise: Reduce bolus before anticipated exercise; carry fast-acting carbohydrates
- Pregnancy: Bolus component increases progressively - up to 75% of TDD at 36 weeks gestation (vs 50% pre-conception)
- Renal impairment: Reduce TDD; insulin clearance is reduced
- Insulin pens are preferred over vials/syringes for multiple daily injections (accuracy, portability, ease of use)
- Goldman-Cecil Medicine, 26e (Insulin Therapy, Type 1 DM, Table 210-4)
- Textbook of Family Medicine, 9e (Initiating and Intensifying Physiological Insulin Therapy, Steps 1-5)
- Creasy & Resnik's Maternal-Fetal Medicine (Typical Insulin Regimens in Pregnancy)
A 50 year old patient present in emergency with lower limb weakness bilaterally, planter upgoing, diarrhoea for past 5 days. Voiding dysfunction. BP and RBS are normal. What could be the possibile diagnosis?
transverse myelitis spinal cord MRI lesion
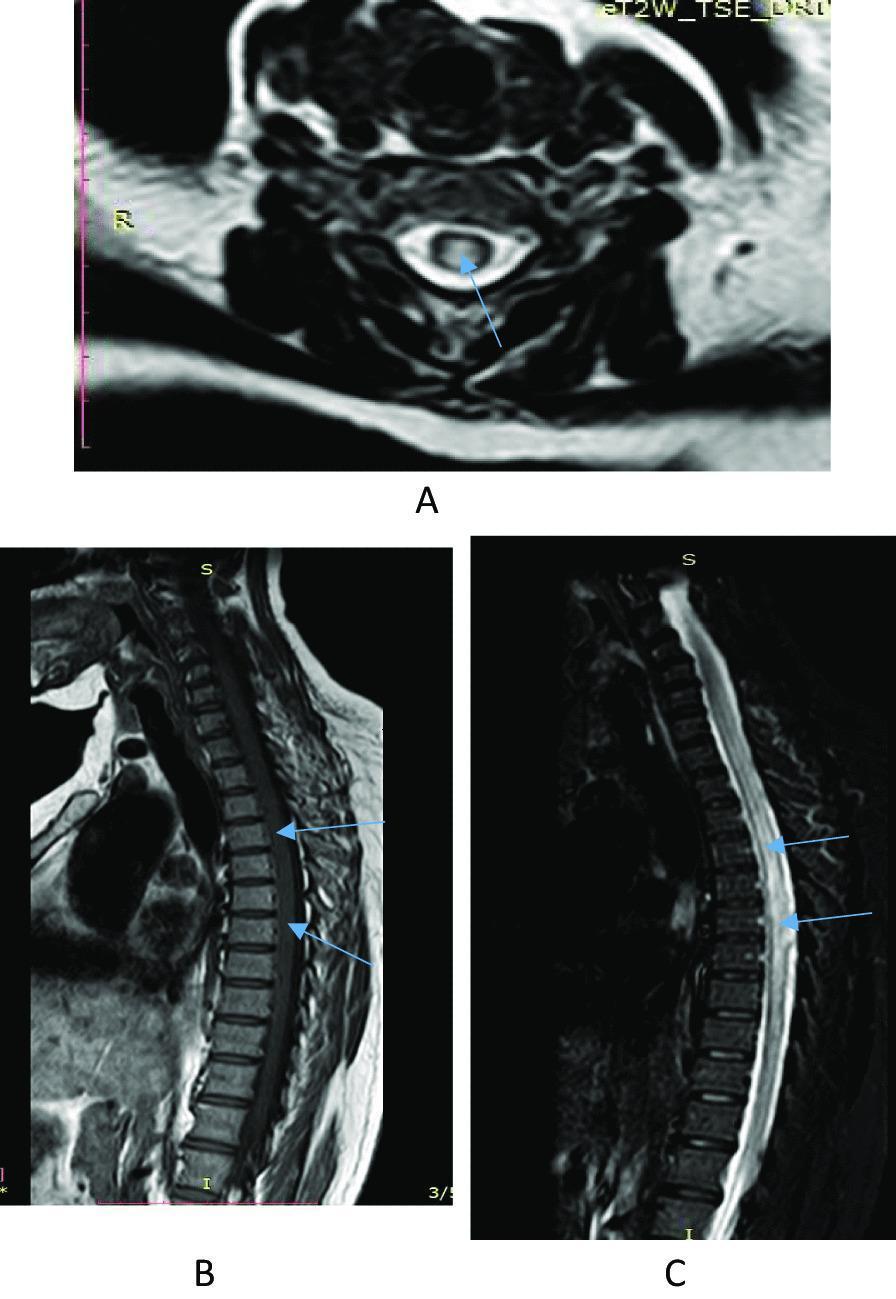
Diagnostic Magnetic Resonance Imaging (MRI) of the cervicothoracic spine demonstrating a longitudinally extensive transverse myelitis (LETM). Panel A (axial T2-weighted image) shows a central hyperintense lesion within the spinal cord parenchyma, occupying more than 50% of the cross-sectional area. Panel B (sagittal T1-weighted image) reveals an expansible, hypointense lesion extending along a long segment of the spinal cord from the cervical (C3) to the lower thoracic (T12) levels. Panel C (sagittal STIR/T2-weighted image) highlights the heterogeneously hyperintense signal within the same segment, indicating significant intramedullary edema or inflammation. The extensive nature of the lesion, spanning more than three vertebral segments, is characteristic of Neuromyelitis Optica Spectrum Disorder (NMOSD) or acute transverse myelitis. This imaging illustrates key diagnostic features for neuroinflammatory demyelinating conditions of the central nervous system.
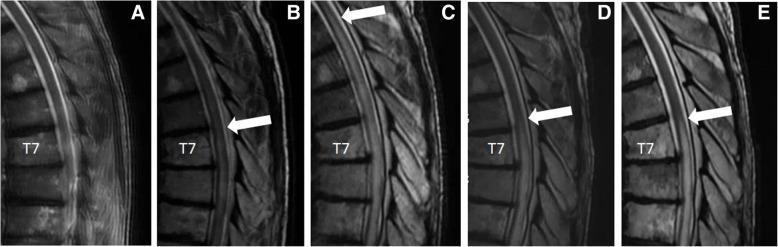
This series of five T2-weighted sagittal MRI images (labeled A through E) illustrates the longitudinal progression and treatment response of transverse myelitis in the thoracic spine. Image A serves as a baseline, showing normal spinal cord signal intensity without lesions. Image B demonstrates the emergence of increased intramedullary T2 signal intensity (hyperintensity) localized near the T7 vertebral level, indicative of early cord changes. Image C reveals significant cephalad extension (ascending) of the lesion, with a white arrow marking the superior border of the transverse myelitis, which now spans multiple vertebral segments. Images D and E show sequential follow-up after the initiation of immunotherapy (infliximab). Image D displays a marked reduction in the longitudinal extent and intensity of the T2 signal abnormality, suggesting a positive therapeutic response. Image E demonstrates a stable but persistent area of mild hyperintensity near T7, reflecting residual cord changes. This radiographic series is a classic educational example of immune-mediated or radiation-induced myelopathy and its monitoring through MRI imaging.
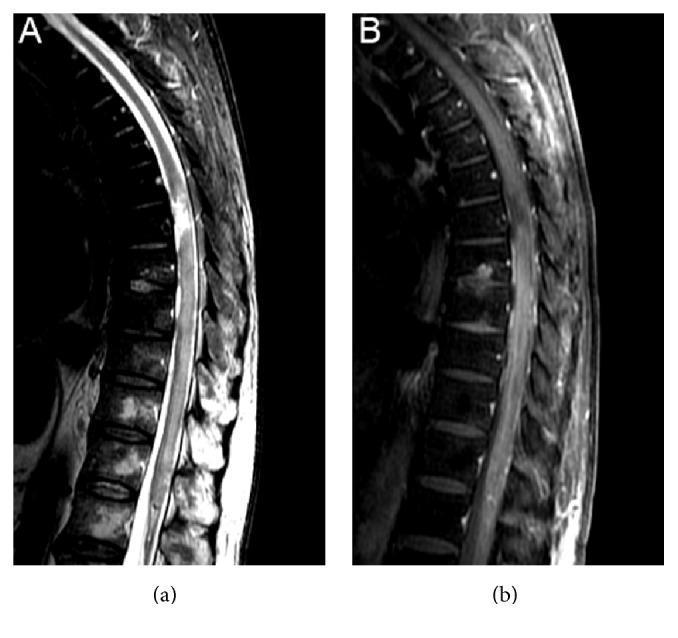
This diagnostic image pair displays sagittal MRI views of the thoracic and lumbar spinal cord, illustrating a case of longitudinally extensive transverse myelitis (LETM). Image A is a T2-weighted sagittal scan revealing a high signal intensity, hyperintense lesion within the cord. The lesion is tumefactive (swollen) and extends from the T6 vertebral level inferiorly to the medullary cone, with a more focal high-intensity signal noted specifically at the T6-T7 levels. Image B represents a post-contrast T1-weighted sagittal sequence of the same region. It demonstrates pathologic gadolinium enhancement within the previously identified T2-hyperintense areas, indicating active inflammation and a breakdown of the blood-spinal cord barrier. The visual findings are characteristic of extensive inflammatory or demyelinating processes of the central nervous system, such as those seen in neuromyelitis optica spectrum disorder (NMOSD) or post-infectious/post-vaccination myelitis.
Clinical Analysis: 50-Year-Old with Bilateral Lower Limb Weakness + Upgoing Plantars + Diarrhoea + Voiding Dysfunction
Key Neurological Localisation First
| Finding | Localisation |
|---|---|
| Bilateral lower limb weakness | Spinal cord or bilateral cortical (less likely) |
| Upgoing plantars (Babinski +ve) | Upper Motor Neurone (UMN) lesion - spinal cord or brain |
| Voiding dysfunction (neurogenic bladder) | Spinal cord (conus/supraconal) |
| Preceding diarrhoea (5 days) | Trigger - post-infectious / para-infectious |
| Normal BP and RBS | Rules out hypertensive myelopathy, diabetic myelopathy |
Most Likely Diagnosis
🔴 1. Acute Transverse Myelitis (ATM) - TOP DIAGNOSIS
- Rapidly evolving (hours to days) symmetrical or asymmetrical paraparesis
- Bilateral Babinski signs (UMN)
- Sphincteric (bladder) dysfunction - hallmark
- Preceding infectious illness (diarrhoea) in the weeks/days before - reported in up to one-third of ATM patients
- Sensory level on the trunk (may need to elicit)
- Ascending paresthesias often present
| Category | Specific Causes |
|---|---|
| Post-infectious (commonest) | Post-viral/bacterial - fits the diarrhoea history |
| Multiple Sclerosis (MS) | First demyelinating episode; check brain MRI |
| Neuromyelitis Optica Spectrum Disorder (NMOSD) | Anti-AQP4 antibody; longitudinally extensive cord lesion (≥3 segments) |
| Autoimmune | Lupus, Sjogren's, sarcoidosis, antiphospholipid Ab syndrome |
| Vasculitis | Spinal cord ischemia |
| Infectious | TB, syphilis, Lyme, HSV, CMV, varicella |
"As many as one-third of patients report an infectious illness in the weeks preceding the onset of neurologic symptoms, in which case a monophasic post-infectious demyelinating disease rather than MS is the likely cause of the myelitis." - Adams & Victor's Principles of Neurology, 12e
Important Differential Diagnoses
🟠 2. Neuromyelitis Optica Spectrum Disorder (NMOSD / Devic Disease)
- Autoimmune disorder - antibodies against aquaporin-4 (AQP4) water channel on astrocytes
- Causes longitudinally extensive transverse myelitis (LETM - ≥3 vertebral segments on MRI)
- Classic triad: optic neuritis + extensive myelitis + positive AQP4-IgG
- Ask about visual symptoms (blurring, pain on eye movement)
- More common in women; can occur at any age
- Requires specific immunotherapy - distinct from MS management
🟠 3. Multiple Sclerosis (MS) - First Presentation
- ATM is a common initial presentation of MS
- In MS, cord signs are typically asymmetric and incomplete (not full transverse)
- Brain MRI showing periventricular plaques (Dawson's fingers) or other demyelinating lesions would confirm dissemination in space
- CSF: oligoclonal bands, elevated IgG index
🟡 4. Spinal Cord Compression (Structural)
- Disc prolapse, cord tumour, epidural abscess, or haematoma at thoracic or cervicothoracic level
- Would give UMN signs + bladder dysfunction
- Against it: usually has pain, and would not be explained by preceding diarrhoea
- Must be urgently excluded by MRI spine regardless
🟡 5. Spinal Cord Infarction / Anterior Spinal Artery Syndrome
- Sudden onset bilateral weakness + sphincter dysfunction + pain at onset
- Causes: aortic surgery, vasculitis, cocaine, hypotension
- Normal BP argues against vascular cause here
- MRI shows "owl-eye" or "snake-eye" sign on axial cuts
🟡 6. Subacute Combined Degeneration (Vitamin B12 Deficiency)
- Posterior and lateral column demyelination
- UMN signs (upgoing plantars, spasticity) + sensory ataxia
- Diarrhoea can cause malabsorption of B12 (or may indicate GI pathology)
- Usually subacute (weeks-months), but can present acutely
- Check serum B12, MBC
🟢 7. Guillain-Barré Syndrome (GBS) - Less Likely
- Post-infectious (typically Campylobacter after diarrhoea - the same trigger)
- Ascending weakness, areflexia, LMN signs
- Does NOT cause upgoing plantars - this is the key distinguishing feature
- Bladder involvement is less common, usually late
- GBS is excluded by the UMN signs (upgoing plantars) in this case
Summary Table
| Diagnosis | For | Against |
|---|---|---|
| Acute Transverse Myelitis | UMN signs, bladder dysfunction, post-infectious | - |
| NMOSD | Extensive cord lesion possible, post-infectious | No optic involvement mentioned |
| MS | First demyelinating event | Signs may be incomplete |
| Spinal cord compression | UMN signs, bladder | No pain, no trauma |
| Subacute combined degeneration | Diarrhoea→B12 loss, UMN signs | Usually slower onset |
| GBS | Post-diarrhoea | Upgoing plantars exclude LMN disease |
Immediate Investigations to Order in ED
| Investigation | Purpose |
|---|---|
| MRI spine (full) with + without gadolinium | First and most urgent - confirm/exclude cord compression or infarction; look for T2 signal change in cord |
| MRI brain | Demyelinating plaques (MS), NMOSD lesions |
| CSF analysis (after ruling out raised ICP) | Cells, protein, oligoclonal bands, viral PCR |
| AQP4-IgG (anti-NMO antibody) | NMOSD |
| Anti-MOG antibody | MOG-IgG associated myelitis |
| Serum B12, folate, MMA | Subacute combined degeneration |
| ANA, dsDNA, ANCA, complement | Autoimmune/vasculitic myelopathy |
| Stool culture | Identify causative organism (Campylobacter, Salmonella, etc.) |
| Blood cultures | Infectious/septic aetiology |
| HIV, VDRL, Lyme serology | Infectious myelitis |
Emergency Management Principles
- Urgent MRI spine - this is a neurological emergency; cord compression must be excluded immediately
- If post-infectious ATM confirmed: IV Methylprednisolone 1g/day × 3-5 days (high-dose steroids)
- Urinary catheterisation for neurogenic bladder retention
- DVT prophylaxis (immobile patient)
- Neurology referral urgently
- If NMOSD confirmed: plasma exchange or rituximab may be needed
- Adams & Victor's Principles of Neurology, 12e (Acute Myelitis/Transverse Myelitis)
- Rosen's Emergency Medicine, 9e (Acute Transverse Myelitis)
- Grainger & Allison's Diagnostic Radiology (Neuromyelitis Optica Spectrum Disorders)
- Goldman-Cecil Medicine (Insulin Therapy & Spinal Cord Disorders)