
Hepatitis for exam
Which aspect of Hepatitis do you need for your exam? · What level is your exam?
hepatitis B serology markers timeline HBsAg HBeAg anti-HBc
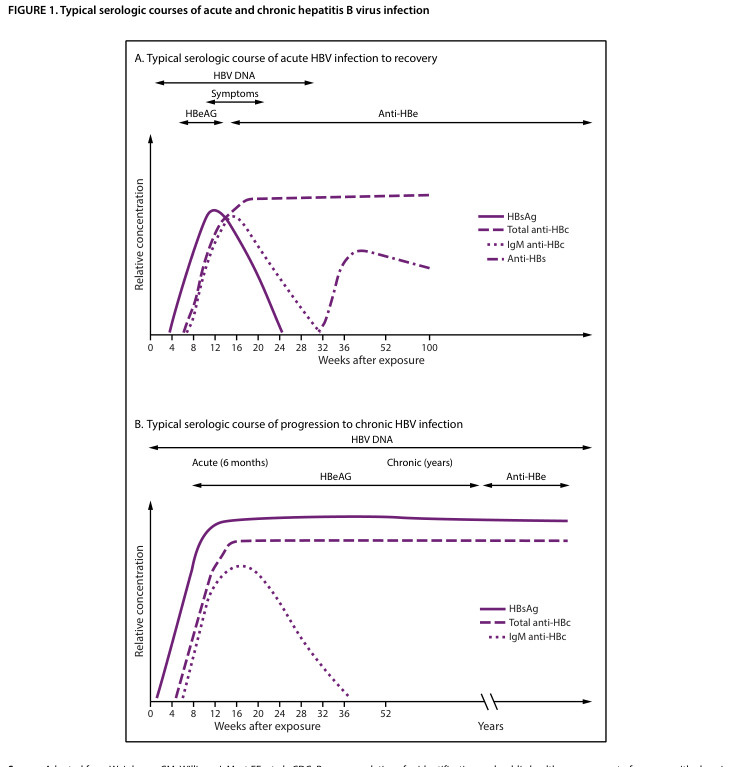
Summary : This figure presents two line plots showing the typical serologic courses of acute and chronic hepatitis B virus (HBV) infection, comparing the progression and recovery of serologic markers over time. line plot: # Panel A: Typical serologic course of acute HBV infection to recovery ## Title & Axes : • Title: "A. Typical serologic course of acute HBV infection to recovery" • X-axis: "Weeks after exposure" (tick labels: 0, 4, 8, 12, 16, 20, 24, 28, 32, 36, 52, 100) • Y-axis: "Relative concentration" (no explicit tick labels) • Additional timeline annotations: "HBV DNA", "Symptoms", "HBeAG", "Anti-HBe" (horizontal arrows above plot) ## Data Points : • HBsAg (solid line): Rises sharply after exposure, peaks around 8–12 weeks, then declines and disappears by ~24–28 weeks. • Total anti-HBc (dashed line): Rises after exposure, peaks around 16–20 weeks, remains elevated beyond 100 weeks. • IgM anti-HBc (dotted line): Rises after exposure, peaks around 12–16 weeks, declines and disappears by ~28–32 weeks. • Anti-HBs (long dashed line): Appears after ~24–28 weeks, rises and remains elevated beyond 100 weeks. ## Design Encodings : • HBsAg: solid purple line • Total anti-HBc: dashed purple line • IgM anti-HBc: dotted purple line • Anti-HBs: long dashed purple line • All lines plotted against the same axes; no log scale or error bars. ## Distribution & Trends : • HBsAg and IgM anti-HBc both show transient peaks and then decline. • Total anti-HBc and anti-HBs persist long-term after recovery. # Panel B: Typical serologic course of progression to chronic HBV infection ## Title & Axes : • Title: "B. Typical serologic course of progression to chronic HBV infection" • X-axis: "Weeks after exposure" (tick labels: 0, 4, 8, 12, 16, 20, 24, 28, 32, 36, 52), then "Years" (break in axis) • Y-axis: "Relative concentration" (no explicit tick labels) • Additional timeline annotations: "HBV DNA", "Acute (6 months)", "Chronic (years)", "HBeAG", "Anti-HBe" (horizontal arrows above plot) ## Data Points : • HBsAg (solid line): Rises after exposure, remains persistently elevated for years. • Total anti-HBc (dashed line): Rises after exposure, remains persistently elevated for years. • IgM anti-HBc (dotted line): Rises after exposure, peaks around 12–16 weeks, declines and disappears by ~28–32 weeks. ## Design Encodings : • HBsAg: solid purple line • Total anti-HBc: dashed purple line • IgM anti-HBc: dotted purple line • All lines plotted against the same axes; no log scale or error bars. ## Distribution & Trends : • HBsAg and total anti-HBc remain persistently elevated in chronic infection. • IgM anti-HBc is transient and disappears after the acute phase. # Analysis : • In acute HBV infection (Panel A), HBsAg and IgM anti-HBc are transient, while total anti-HBc and anti-HBs persist after recovery, indicating resolution and immunity. • In chronic HBV infection (Panel B), HBsAg and total anti-HBc remain persistently elevated for years, while IgM anti-HBc is only present during the acute phase, indicating ongoing infection without resolution. • The presence and duration of serologic markers distinguish acute recovery from progression to chronic infection.
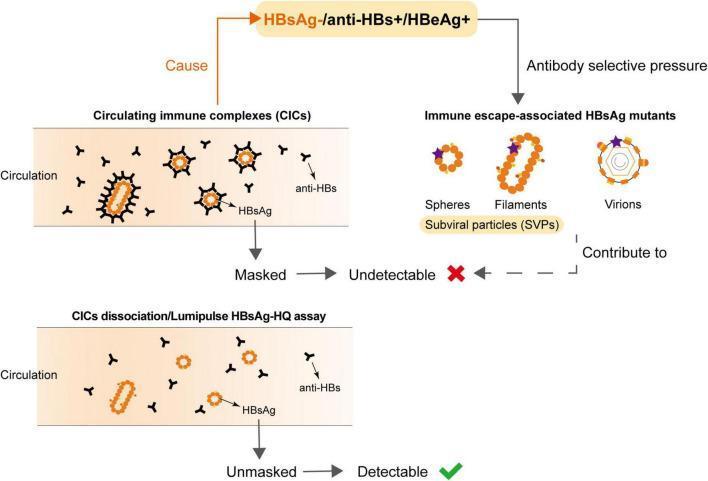
This pathophysiology diagram illustrates the mechanisms underlying undetectable Hepatitis B surface antigen (HBsAg) in patients who are HBeAg-positive and anti-HBs-positive. The diagram is divided into two primary pathways: the formation of Circulating Immune Complexes (CICs) and the emergence of HBsAg mutants. In the CIC pathway, HBsAg particles are shown in circulation bound by Y-shaped anti-HBs antibodies; this 'masking' of epitopes renders the antigen undetectable by standard assays. A lower panel demonstrates that chemical dissociation or specialized assays (e.g., Lumipulse HBsAg-HQ) can unmask these antigens, making them detectable. The second pathway shows 'Immune escape-associated HBsAg mutants' arising from antibody selective pressure. These are depicted as spheres, filaments (together termed subviral particles or SVPs), and complete virions with altered surface epitopes (marked by purple stars). Both CIC formation and mutant emergence contribute to the diagnostic challenge of occult Hepatitis B infection (OBI). This diagram is intended for intermediate to advanced medical education regarding HBV serology, diagnostic pitfalls, and immune escape mechanisms.
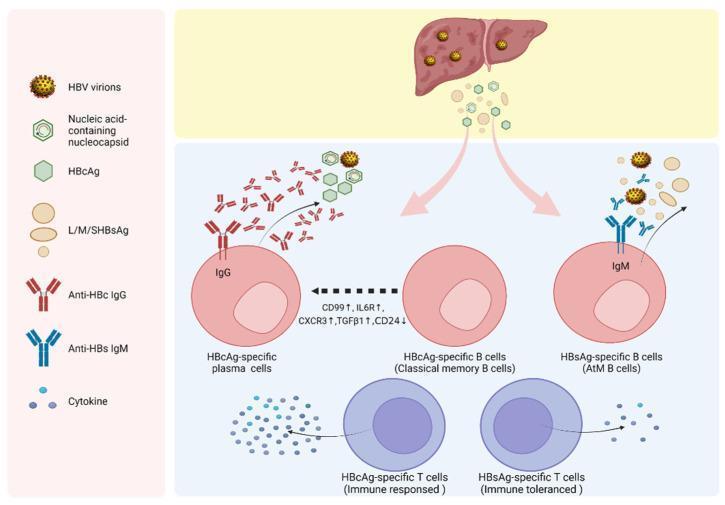
This pathophysiology diagram illustrates the differential immune responses to Hepatitis B core antigen (HBcAg) and surface antigen (HBsAg) in the context of chronic HBV infection. The diagram depicts a liver releasing HBV virions, nucleocapsids, and soluble antigens. The immune response is divided into two distinct pathways: the HBcAg-specific pathway and the HBsAg-specific pathway. In the HBcAg pathway, classical memory B cells differentiate into HBcAg-specific plasma cells, characterized by high expression of CD99, IL6R, CXCR3, and TGFB1, alongside low CD24. These cells actively secrete anti-HBc IgG and stimulate HBcAg-specific T cells, leading to a robust immune response. Conversely, the HBsAg pathway shows HBsAg-specific B cells exhibiting an atypical memory (AtM) phenotype. These cells produce anti-HBs IgM but are associated with HBsAg-specific T cells in a state of immune tolerance, characterized by reduced cytokine production. The visual highlights how high levels of surface antigens contribute to B-cell dysfunction and T-cell exhaustion compared to the more activated core-antigen response.
🦠 Hepatitis A–E: Complete MBBS Exam Guide
1. Overview at a Glance
| Feature | Hep A | Hep B | Hep C | Hep D | Hep E |
|---|---|---|---|---|---|
| Old name | "Infectious" | "Serum" | Non-A, Non-B (post-transfusion) | "Delta agent" | Enteric non-A, non-B |
| Virus family | Picornavirus | Hepadnavirus | Flavivirus | Viroid-like | Hepevirus |
| Genome | (+) ssRNA | Partial dsDNA | (+) ssRNA | Circular RNA | (+) ssRNA |
| Envelope | No | Yes | Yes | Yes | No |
| Transmission | Fecal-oral | Parenteral, sexual | Parenteral, sexual | Parenteral, sexual | Fecal-oral |
| Incubation | 15–50 days | 45–160 days | 14–180+ days | 15–64 days | 15–50 days |
| Onset | Abrupt | Insidious | Insidious | Abrupt | Abrupt |
| Chronicity | No | Yes (3–10% adults; 30–90% infants) | Yes (70%) | Yes | No |
| Mortality | <0.5% | 1–2% | ~4% | High-very high | 1–2%; 20% in pregnancy |
| HCC / Cirrhosis | No | Yes | Yes | Yes (cirrhosis, fulminant) | No |
Source: Medical Microbiology 9e, Table 55.1
2. Hepatitis A (HAV)
Virus
- Picornavirus; non-enveloped, (+)ssRNA, single serotype
- Stable to heat, acid, and detergent (unlike enveloped viruses)
Transmission & Epidemiology
- Fecal-oral route - contaminated food/water, shellfish
- Endemic in developing countries; 1.4 million cases/year globally (WHO)
- In high-endemicity areas, 90% of children infected before age 10 (usually subclinical)
- Epidemics in areas with intermediate endemicity (children escape early infection, remain susceptible as adolescents)
Clinical Features
- Prodrome: fever, chills, headache, fatigue, anorexia, nausea, vomiting
- Icteric phase: dark urine, pale stools, jaundice, hepatomegaly
- Benign, self-limiting; complete recovery in weeks
- Case fatality rate: <0.1% (mainly elderly with acute liver failure)
- No chronic disease, no carrier state
Diagnosis
- Anti-HAV IgM = acute infection
- Anti-HAV IgG = past infection / immunity
Treatment & Prevention
- Supportive only (no antiviral)
- Vaccine: 2 doses of inactivated vaccine (6–12 months apart); ~94% efficacy
- Live attenuated vaccine: single subcutaneous dose (used in China)
- Post-exposure prophylaxis: Immune globulin (0.02 ml/kg) within 14 days - 80–90% effective; duration only 1–2 months
3. Hepatitis B (HBV)
Virus
- Hepadnavirus; enveloped, partially double-stranded circular DNA, 3200 bp
- Virion = Dane particle (42 nm); encodes reverse transcriptase - replicates via RNA intermediate
- Extremely stable: resists ether, low pH, freezing, moderate heat
Key Antigens & Antibodies (HIGH YIELD for MCQs)
| Marker | Meaning |
|---|---|
| HBsAg | Surface antigen - first marker to appear; presence >6 months = chronic infection |
| Anti-HBs | Protective antibody; appears after recovery or vaccination |
| HBcAg | Core antigen - NOT detectable in serum (only in liver tissue) |
| Anti-HBc IgM | Acute infection marker; also seen in "window period" |
| Anti-HBc IgG | Past infection (persists lifelong) |
| HBeAg | Envelope antigen - marker of active viral replication, high infectivity |
| Anti-HBe | Seroconversion; reduced infectivity |
| HBV DNA | Most sensitive marker of viral replication |
Serological Patterns
- Acute resolving: HBsAg positive → HBeAg positive → Anti-HBe → Anti-HBs → recovery
- Window period: HBsAg gone, Anti-HBs not yet detectable; only anti-HBc IgM is positive
- Chronic: HBsAg persists >6 months
- Vaccinated: Only anti-HBs positive (no anti-HBc)
- Past infection + recovered: Anti-HBs + Anti-HBc IgG positive; HBsAg negative
Chronicity Risk
- Adults: 3–10% progress to chronic
- Children: 30–90% (immature immune system; vertical transmission very high risk)
Complications
- Chronic hepatitis → Cirrhosis → Hepatocellular carcinoma (HCC)
- Fulminant hepatitis (rare)
Treatment
- Acute: supportive
- Chronic: Tenofovir or Entecavir (first-line antivirals); Pegylated IFN-alfa
Vaccine
- 3-dose recombinant vaccine (0, 1, 6 months)
- Newborns of HBsAg-positive mothers: vaccine + HBIg within 12 hours of birth
- Healthcare workers, IV drug users, dialysis patients - high priority
4. Hepatitis C (HCV)
Virus
- Flavivirus; enveloped, (+)ssRNA
- Highly mutable - envelope protein variability leads to 6 genotypes (genotype 1 most common globally, hardest to treat)
- NO vaccine available
Transmission
- Predominantly parenteral: IV drug use (major route), blood transfusions, needlestick injuries
- Sexual transmission (lower risk than HBV)
- Mother-to-child (5–6%)
Clinical Features
- Usually subclinical/asymptomatic at acute stage
- 70% progress to chronic - highest chronicity of all hepatitis viruses
- Chronic HCV → cirrhosis → HCC
- Extra-hepatic: mixed cryoglobulinemia, membranoproliferative glomerulonephritis, lichen planus
Diagnosis
- Anti-HCV ELISA - screening test
- HCV RNA (PCR) - confirmatory, most sensitive, detects active infection
- Genotyping to guide treatment duration
Treatment
- Direct-Acting Antivirals (DAAs) - >95% cure rate
- Sofosbuvir-based regimens (pangenotypic)
- Glecaprevir/pibrentasvir
- Treatment duration: 8–12 weeks (genotype-dependent)
- No vaccine; prevention by harm reduction (sterile needles, blood screening)
5. Hepatitis D (HDV)
Virus
- Defective viroid-like agent - circular RNA genome; needs HBsAg as its envelope
- CANNOT infect without HBV - obligate satellite virus
Two Modes of Infection
| Co-infection | Superinfection | |
|---|---|---|
| Definition | HAV + HDV simultaneously | HDV infects existing HBV carrier |
| Severity | Usually self-limiting (both clear together) | Often severe / fulminant |
| Chronic risk | Low | High (>70%) |
Key Points
- Highest mortality among hepatitis viruses in superinfection
- Prevented by HBV vaccination (HBV vaccine also prevents HDV!)
- Diagnosis: anti-HDV ELISA
6. Hepatitis E (HEV)
Virus
- Hepevirus; non-enveloped, (+)ssRNA
- Similar to HAV (enteric route, no chronic state)
Transmission & Epidemiology
- Fecal-oral - contaminated water
- Large waterborne outbreaks in developing countries (India, South/SE Asia, Africa)
- Zoonotic reservoir in pigs (genotype 3 & 4)
Clinical Features
- Usually self-limiting
- Pregnant women: Case fatality up to 20% (highest of all hepatitis viruses in this group)
- Fulminant hepatic failure
- Causes DIC, pre-term labour, vertical transmission
- No chronic disease in immunocompetent patients (exception: immunosuppressed patients with genotype 3)
Diagnosis
- Anti-HEV IgM (acute)
- HEV RNA (in serum/stool)
Prevention
- Sanitation, safe water
- HEV 239 vaccine (Hecolin) - licensed in China; NOT yet widely available globally
7. High-Yield Summary for MCQs
| Question Type | Answer |
|---|---|
| Highest chronicity | HCV (70%) |
| Causes chronic infection | HBV, HCV, HDV |
| Does NOT cause chronic infection | HAV, HEV |
| Highest mortality in pregnancy | HEV (20%) |
| Only DNA hepatitis virus | HBV |
| Replicates via reverse transcriptase | HBV |
| Requires HBV to replicate | HDV |
| Window period marker | Anti-HBc IgM |
| Vaccination immunity only (no anti-HBc) | Anti-HBs alone |
| First marker of acute HBV | HBsAg |
| High infectivity marker in HBV | HBeAg |
| Most common cause of post-transfusion hepatitis | HCV |
| Most common cause of viral hepatitis worldwide | HBV |
| Enteric transmission | HAV, HEV |
| Parenteral transmission | HBV, HCV, HDV |
| No vaccine available | HCV |
| Prevented by HBV vaccine | HBV + HDV |
| Dane particle | HBV virion (42 nm) |
| HBsAg originally called | Australia antigen |
8. Clinical Course of Acute Viral Hepatitis
- Prodromal/preicteric phase: fever, malaise, nausea, arthralgia, urticaria (immune complex deposition)
- Icteric phase: jaundice, dark urine (bilirubinuria), pale stools, hepatomegaly
- Recovery phase: gradual normalization of LFTs
- ALT/AST > 10x upper limit of normal
- Elevated bilirubin (total + direct)
- Elevated alkaline phosphatase (especially in cholestatic pattern)
- Elevated PT/INR in severe cases
Sources: Medical Microbiology 9e, Table 55.1 & Ch. 55 | Park's Textbook of Preventive & Social Medicine | Goldman-Cecil Medicine