
from Guyton and Hall textbook of medical physiology, 4th South Asia edition write a 5 mark short note on .ECG Trace inLead II -draw, label,mark interval
Reading File
Finding Sources
Finding Sources
Finding Sources
Finding Sources
Reading File
Reading File
Reading File
Reading File
Reading File
Reading File
Loading Image
Reading File
Loading Image
Reading File
I now have all the information needed from Guyton and Hall. Let me compile the comprehensive 5-mark short note.
ECG Trace in Lead II - Draw, Label, Mark Intervals
(From Guyton and Hall Textbook of Medical Physiology)
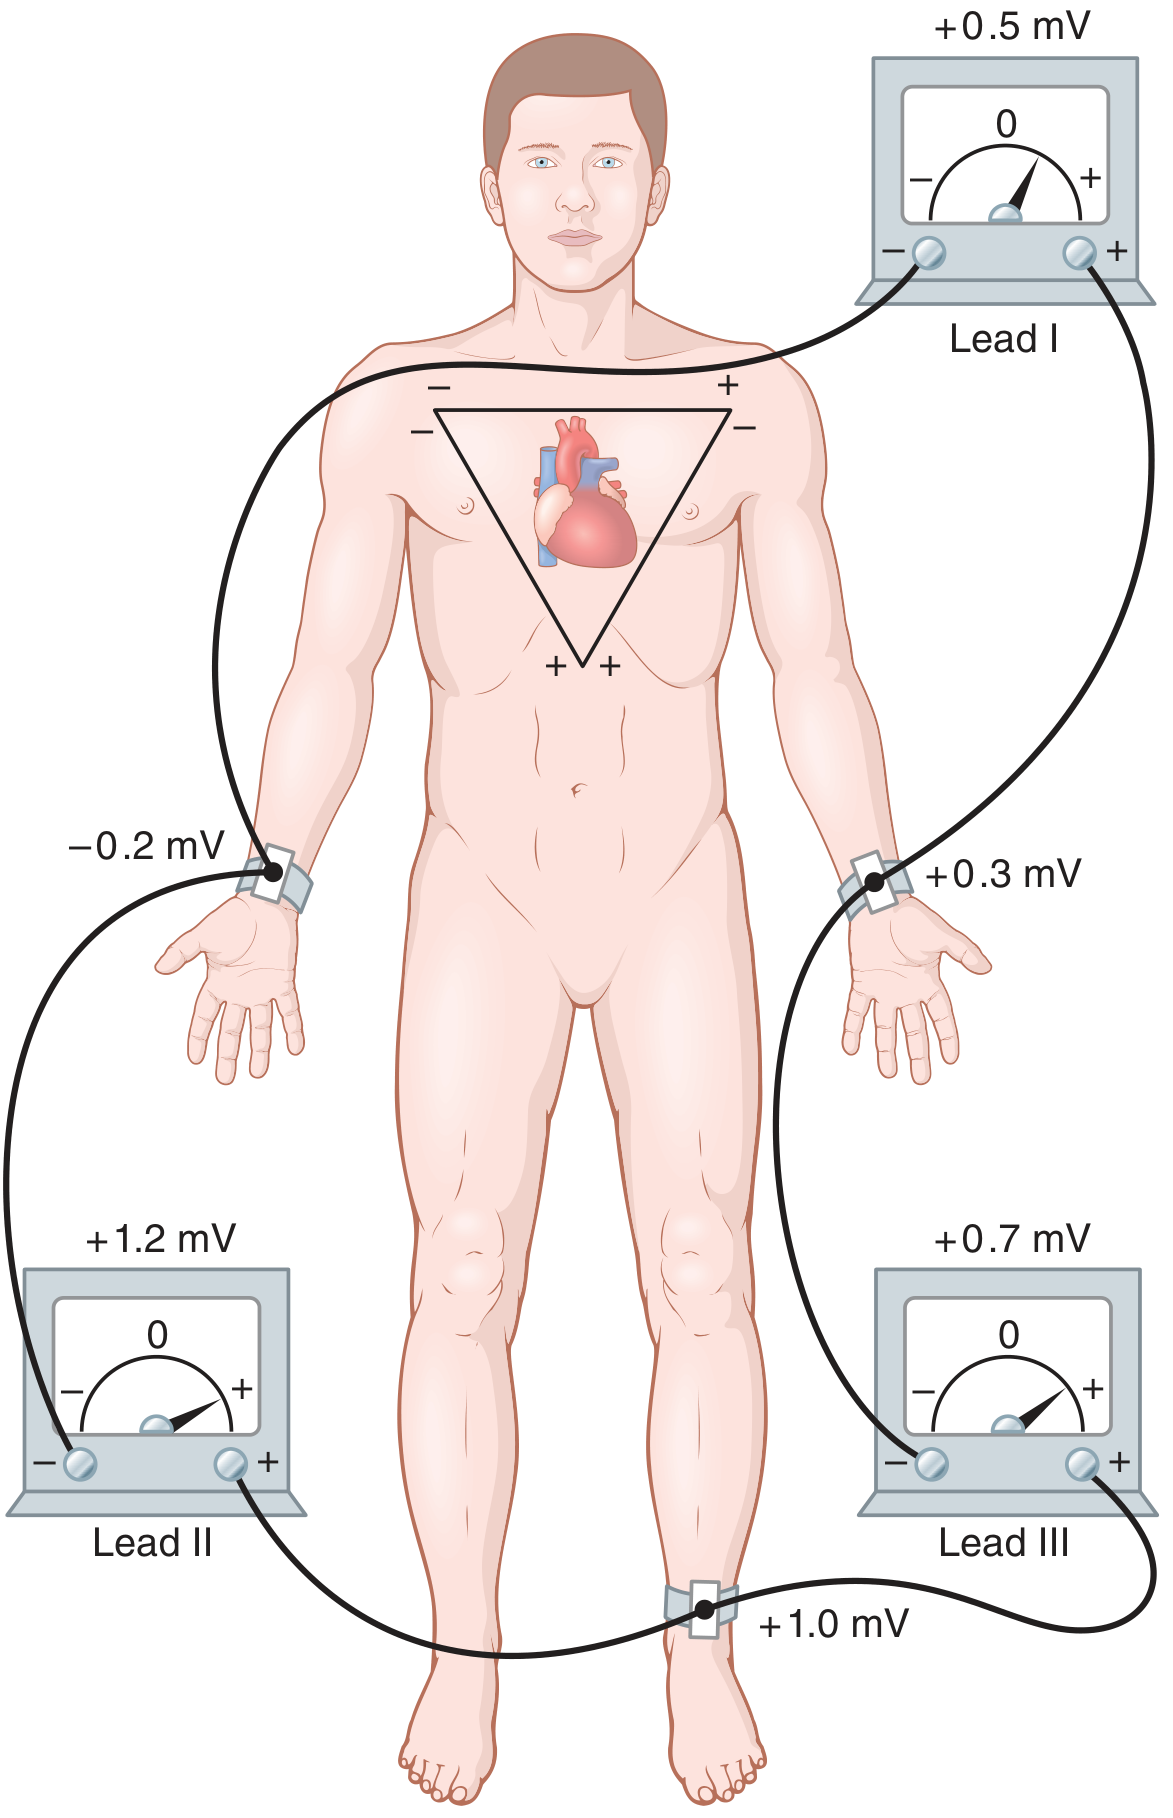
Lead II - Electrode Placement
Lead II is one of the three standard bipolar limb leads (Einthoven's triangle). The negative terminal of the electrocardiograph is connected to the right arm, and the positive terminal is connected to the left leg. The electrocardiograph records positively when the right arm is electronegative with respect to the left leg.
Because the axis of Lead II runs roughly parallel to the mean electrical axis of the heart (directed downward and to the left, from base to apex), Lead II typically shows the tallest and most upright deflections of all limb leads and is the most commonly used lead for monitoring cardiac rhythm.
(Guyton and Hall, Fig. 11.6 - Einthoven's Triangle)
The Normal ECG Trace in Lead II
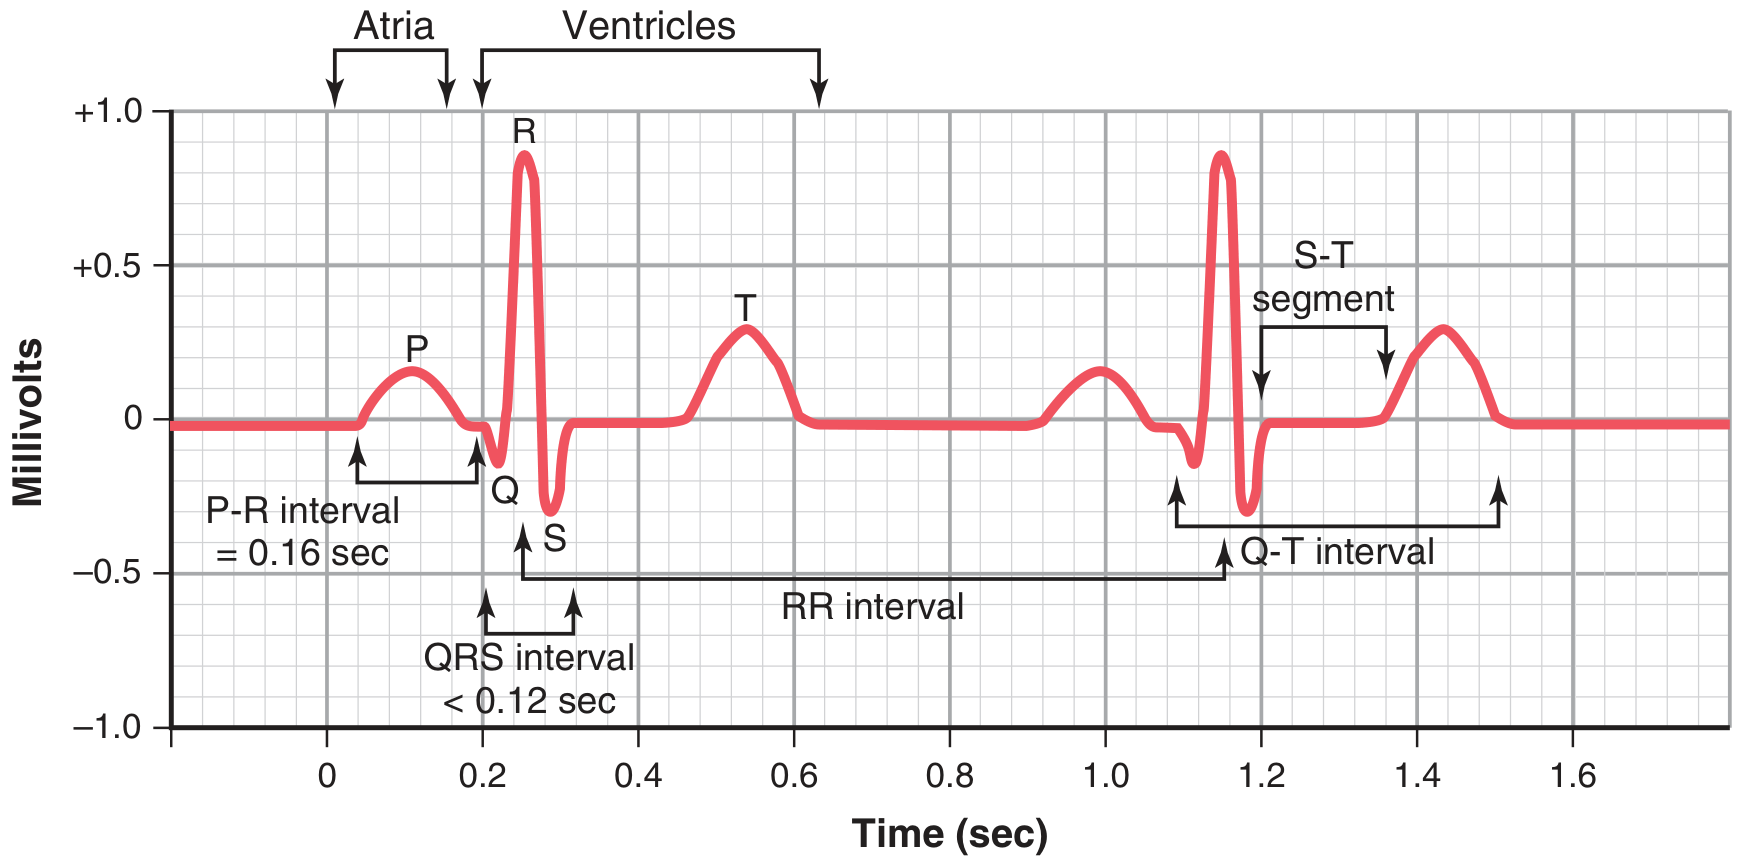
The normal ECG in Lead II consists of the following labeled waveforms and intervals:
Labeled Waveforms
| Wave | Origin | Polarity in Lead II | Normal Amplitude |
|---|---|---|---|
| P wave | Atrial depolarization | Upright (positive) | 0.1 - 0.3 mV |
| Q wave | Septal depolarization (initial) | Small negative deflection | < 0.04 sec; < 25% of R |
| R wave | Ventricular depolarization (main) | Tall positive deflection | 1.0 - 1.5 mV (QRS total) |
| S wave | Late ventricular depolarization | Negative deflection after R | Variable |
| T wave | Ventricular repolarization | Upright (positive) | 0.2 - 0.3 mV |
| U wave | (sometimes present) Late Purkinje/M-cell repolarization | Small positive | < T wave amplitude |
Labeled Intervals and Segments
1. P-R Interval (P-Q Interval)
- Definition: From the beginning of the P wave to the beginning of the QRS complex
- Represents: Time for atrial depolarization + conduction through the AV node and His-Purkinje system
- Normal value: ~0.16 second (range: 0.12-0.20 sec)
- Clinical note: Lengthens with increased parasympathetic tone or at slower heart rates; shortens with sympathetic activation
2. QRS Interval (QRS Duration)
- Definition: From the beginning of the Q wave to the end of the S wave
- Represents: Duration of ventricular depolarization
- Normal value: ~0.08 second (< 0.10 sec = normal; > 0.12 sec = abnormal/bundle branch block)
3. Q-T Interval
- Definition: From the beginning of the Q wave (or R wave if Q is absent) to the end of the T wave
- Represents: Total duration of ventricular systole - both depolarization and repolarization
- Normal value: ~0.35 second at normal heart rates (rate-dependent; use corrected QTc)
4. S-T Segment
- Definition: From the end of the S wave to the beginning of the T wave
- Represents: Period when ventricles are completely depolarized - isoelectric (no potential difference)
- Normal: At the isoelectric baseline (elevation or depression is pathological)
5. R-R Interval
- Definition: Time between two successive R waves
- Represents: Duration of one complete cardiac cycle
- Normal value: ~0.83 second (= heart rate of ~72 beats/min)
- Heart rate formula: HR = 60 / R-R interval (in seconds)
Paper Speed and Calibration
- Standard paper speed: 25 mm/second
- Each small square (1 mm) = 0.04 second horizontally; 0.1 mV vertically
- Each large square (5 mm) = 0.20 second horizontally; 0.5 mV vertically
- 10 small vertical divisions = 1 millivolt
Key Summary Table
| Interval/Segment | From | To | Normal Duration |
|---|---|---|---|
| P-R interval | Start of P | Start of QRS | 0.12 - 0.20 sec (~0.16 sec) |
| QRS complex | Start of Q | End of S | < 0.12 sec (~0.08 sec) |
| S-T segment | End of S | Start of T | Isoelectric |
| Q-T interval | Start of Q | End of T | ~0.35 sec |
| R-R interval | Peak of R | Peak of next R | ~0.83 sec (at 72 bpm) |
Source: Guyton and Hall Textbook of Medical Physiology, Chapters 11 and 12 - "Waveforms of the Normal Electrocardiogram," "Electrocardiographic Voltage and Time Calibration," and "Relationship of Atrial and Ventricular Contraction to the Electrocardiogram Waves."
This is a shared conversation. Sign in to Orris to start your own chat.