
Ecg
Asking for Preferences
What would you like to know about ECG?
A standard 12-lead ECG is read in a systematic order: rate, rhythm, axis, intervals (PR, QRS, QT), then waveform morphology (P waves, QRS complexes, ST segments, T waves). Each lead views the heart from a different angle, so changes in specific leads localize pathology.
Searching sources...
Reading File
Finding Sources
Finding Sources
Finding Sources
Reading File
Finding Sources
Reading File
Reading File
Finding Sources
Reading File
Reading File
Loading Image
Loading Image
Reading File
Now I have rich textbook content and diagrams from Harrison's Principles of Internal Medicine (2025). Here is the complete guide:
ECG Basic Interpretation Guide
What Is an ECG?
An electrocardiogram (ECG/EKG) is a graphical record of electrical activity generated by the heart. Metallic electrodes on the limbs and chest wall detect signals that are amplified and displayed as waveforms. It is noninvasive, inexpensive, and immediately available - used to detect arrhythmias, conduction disturbances, ischemia/infarction, electrolyte disturbances, and drug toxicity.
1. The Cardiac Conduction System
Before reading an ECG, understand what generates the signals:
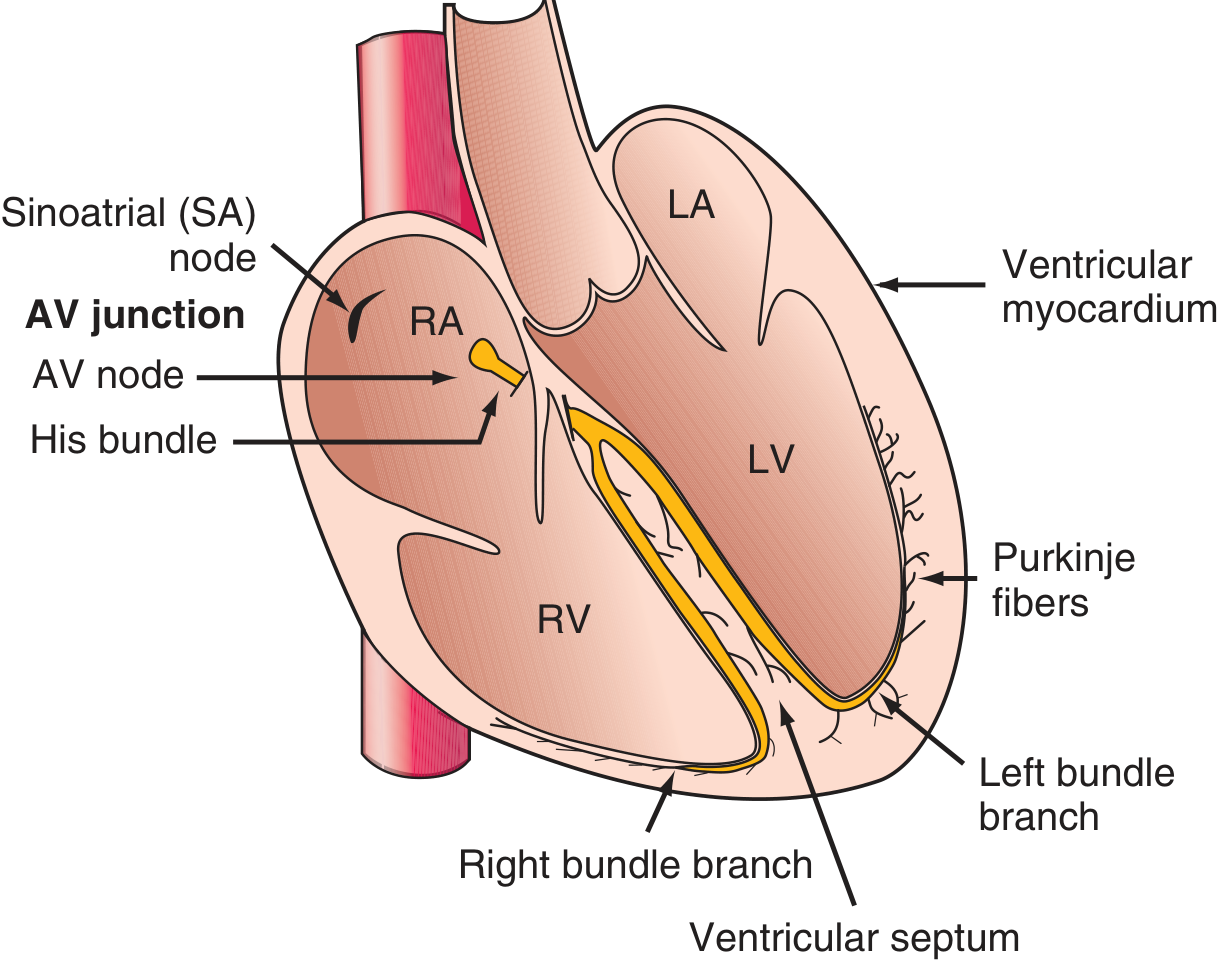
The normal heartbeat starts in the SA node (right atrium) → spreads across both atria → reaches the AV node (physiologic delay) → travels down the Bundle of His → splits into right and left bundle branches → spreads through Purkinje fibers to ventricular muscle (endocardium to epicardium).
2. ECG Waveforms and Intervals
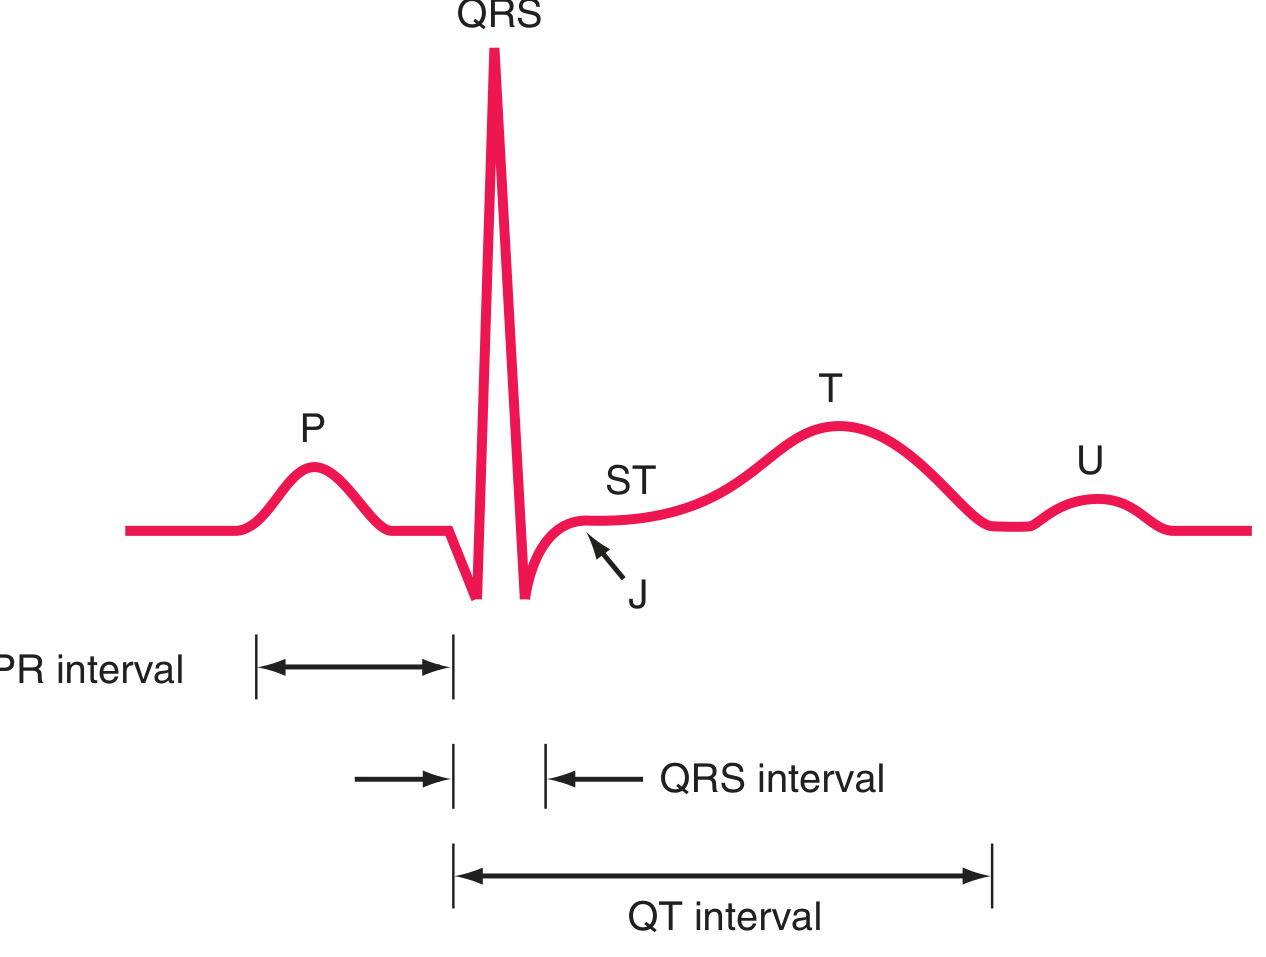
| Waveform/Interval | Represents | Normal Value |
|---|---|---|
| P wave | Atrial depolarization | Upright in I, II; <120 ms wide |
| PR interval | Atrial-to-ventricular conduction (includes AV nodal delay) | 120-200 ms (3-5 small boxes) |
| QRS complex | Ventricular depolarization | <100-110 ms (≤2.5 small boxes) |
| ST segment | Isoelectric phase of ventricular action potential (plateau) | At baseline (isoelectric) |
| T wave | Ventricular repolarization | Upright in most leads |
| U wave | Slow repolarization (Purkinje fibers) | Small, same direction as T |
| QT interval | Total ventricular depolarization + repolarization | QTc ≤450 ms (men), ≤460 ms (women) |
| J point | Junction of QRS end and ST segment start | At isoelectric line |
ECG paper: At 25 mm/s, each small box = 40 ms (0.04 s); each large box = 200 ms (0.20 s). Vertically, 1 mV = 10 mm (standard calibration).
3. The 12 Leads
The 12 leads view the heart from different angles, like cameras:
Limb leads (frontal plane):
- I, II, III - standard bipolar limb leads
- aVR, aVL, aVF - augmented unipolar limb leads
Chest (precordial) leads (horizontal plane):
- V1-V6 - placed across the chest from right to left
Lead groupings and what they "see":
| Territory | Leads |
|---|---|
| Inferior wall | II, III, aVF |
| Lateral wall | I, aVL, V5, V6 |
| Anterior wall | V1-V4 |
| Septal | V1, V2 |
| Right ventricle | V1, V3R-V6R (right-sided leads) |
4. Systematic Approach (14-Step Checklist)
Harrison's recommends checking all of these on every ECG to avoid errors of omission:
- Standardization and technical quality - Is calibration 1 mV = 10 mm? Correct lead placement? Artifacts?
- Rhythm - Regular or irregular? What is the pacemaker?
- Heart rate - Count R-R intervals. Rate = 300 ÷ large boxes between R waves (or 1500 ÷ small boxes)
- PR interval - Normal 120-200 ms? Short (pre-excitation), long (heart block)?
- QRS interval - Normal <110 ms? Wide = bundle branch block or pre-excitation
- QT/QTc interval - Prolonged or short?
- Mean QRS axis - Normal -30° to +90°. Axis deviation suggests ventricular or fascicular problems
- P waves - Present, upright in II? Morphology (peaked = right atrial enlargement; notched/broad = left)
- QRS voltages - High (hypertrophy) or low (effusion, obesity, COPD)?
- Precordial R-wave progression - R waves should grow from V1 to V5/V6 (transition zone)
- Abnormal Q waves - Pathological Q waves (>40 ms wide, >1/4 R-wave height) = prior infarction
- ST segments - Elevation (STEMI, pericarditis) or depression (ischemia, NSTEMI)?
- T waves - Inversions, peaked (hyperkalemia), or flattened?
- U waves - Prominent (hypokalemia, bradycardia, certain drugs)?
Always compare with previous ECGs when available.
5. How to Calculate Heart Rate
- Regular rhythm: Count large boxes between two R waves. Rate = 300 ÷ number of large boxes.
- 1 box = 300 bpm | 2 = 150 | 3 = 100 | 4 = 75 | 5 = 60 | 6 = 50
- Irregular rhythm (e.g. AF): Count the number of QRS complexes in a 6-second strip (30 large boxes) and multiply by 10.
6. Common Findings and Their Significance
| Finding | Meaning |
|---|---|
| No P waves + irregular RR | Atrial fibrillation |
| Sawtooth baseline ~300/min | Atrial flutter |
| Long PR (>200 ms) | 1st degree AV block |
| Dropped beats, progressive PR lengthening | 2nd degree AV block (Mobitz I/II) |
| No relationship between P and QRS | 3rd degree (complete) heart block |
| Wide QRS + RSR' in V1 | Right bundle branch block |
| Wide QRS + broad R in V5-6, no septal Q | Left bundle branch block |
| ST elevation in contiguous leads | STEMI (acute MI) |
| ST depression + T-wave inversion | Subendocardial ischemia |
| Pathological Q waves | Prior transmural infarction |
| Peaked P in II | Right atrial enlargement |
| Broad/notched P in II | Left atrial enlargement |
| Tall R in V5/S in V1 >35 mm | Left ventricular hypertrophy |
| Short PR + delta wave | WPW (Wolff-Parkinson-White) |
| Diffuse saddle-shaped ST elevation | Pericarditis |
| Sinus tachycardia + low voltages + electrical alternans | Pericardial tamponade |
7. QTc Correction Formulas
The QT interval shortens at faster heart rates, so it must be corrected:
- Bazett formula (most common): QTc = QT / √RR (RR in seconds)
- Framingham formula: QT_corrected = QT + 0.154 × (1000 - RR) [in ms]
- Upper limits: ≤450 ms in men, ≤460 ms in women
Long QT increases risk of torsades de pointes (polymorphic VT).
Source: Harrison's Principles of Internal Medicine, 22nd Edition (2025), Chapter 247 - Electrocardiography (Ary L. Goldberger)
This covers the full framework for reading any ECG. Want me to go deeper on a specific part - axis calculation, bundle branch blocks, MI localization, or arrhythmia recognition?
This is a shared conversation. Sign in to Orris to start your own chat.