
Prepare100 ml stock solution of adrenaline nonadrenaline propranolol and atropine for their dose 10mg/kg report their effect in isolated heart tissu on kymograph paper
isolated heart preparation kymograph adrenaline noradrenaline propranolol atropine pharmacology practical 10mg/kg stock solution
https://drnaitiktrivedi.com/wp-content/uploads/2022/10/2.-Ef…
kymograph tracing isolated frog heart adrenaline noradrenaline propranolol atropine pharmacology
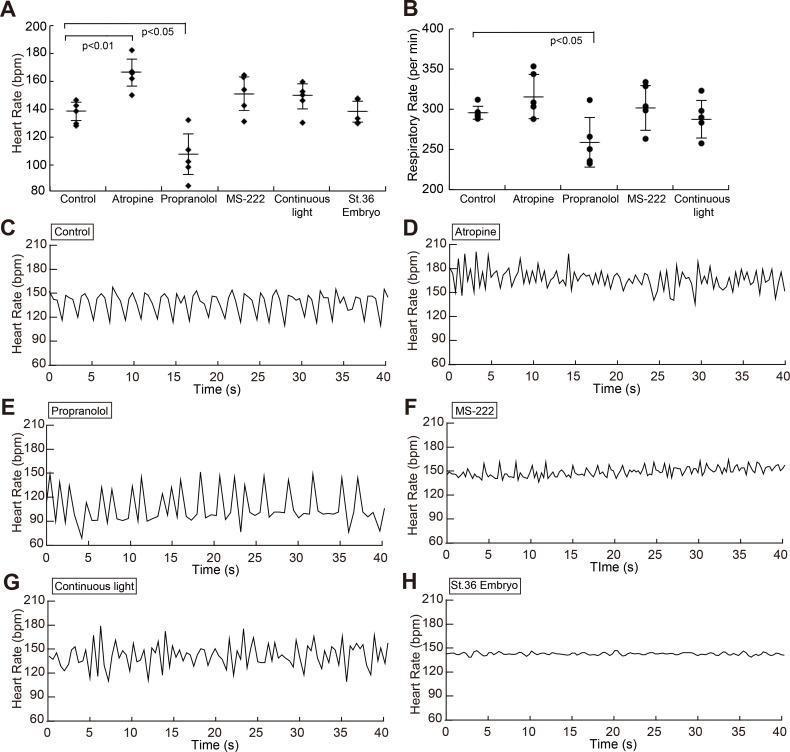
This physiological data figure analyzes heart rate variability (HRV) and respiratory rates in a medaka fish model under various pharmacological and environmental conditions. Panels A and B are dot plots showing group-averaged steady-state heart rates (bpm) and respiratory rates (per min), with error bars representing standard deviation across conditions: control, atropine (muscarinic antagonist), propranolol (beta-blocker), MS-222 (anesthesia), and continuous light. Panels C through H provide time-series line graphs of beat-by-beat heart rate fluctuations over 40 seconds. Key findings include: atropine increases mean heart rate (tachycardia) and fluctuation intensity; propranolol decreases mean heart rate (bradycardia) with marked variability; MS-222 anesthesia and St. 36 embryo stages show significantly reduced heart rate fluctuations, indicating lower autonomic nervous system (ANS) modulation. The data illustrates how sympathetic and parasympathetic influences regulate cardiac and respiratory rhythms, serving as a comparative model for autonomic pharmacology and developmental physiology.
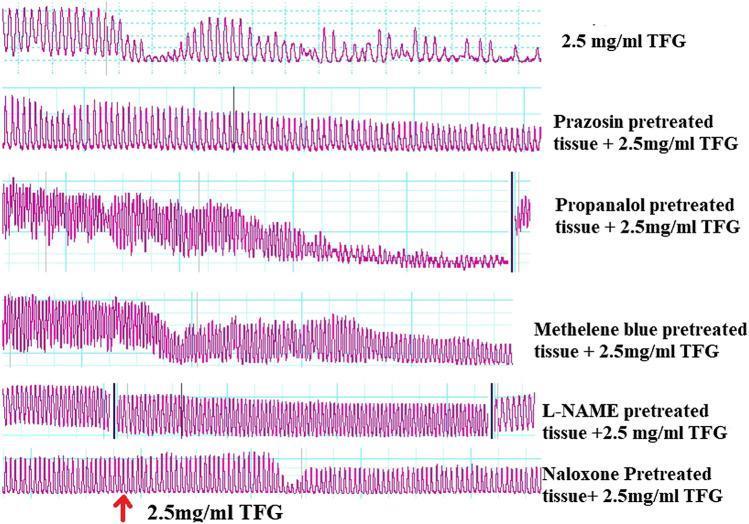
A multi-panel physiological recording (PowerLab tracing) demonstrating the effect of Tylosema fassoglense (TFG) extract on the spontaneous contractility of isolated smooth muscle tissue (jejunal segments). The tracings represent pharmacodynamic responses under various pretreatment conditions including an alpha-adrenergic antagonist (prazosin), a beta-adrenergic antagonist (propranolol), a guanylyl cyclase inhibitor (methylene blue), a nitric oxide synthase inhibitor (L-NAME), and an opioid antagonist (naloxone). The first tracing (2.5 mg/ml TFG) shows a reduction in contraction amplitude over time. The propranolol-pretreated panel exhibits a marked progressive decrease in both frequency and amplitude. Prazosin-pretreated tissue maintains high-frequency oscillations, while L-NAME pretreatment results in sustained oscillations of lower amplitude compared to the control. These comparative tracings are used to evaluate the mechanism of action of the plant extract, specifically its spasmolytic activity and interactions with different autonomic and biochemical signaling pathways.

Two side-by-side myographic tracings (a and b) demonstrating the vasomotor activity of isolated rat aortic rings in a cardiovascular pharmacology study. The y-axis represents isometric tension (0.5 g scale), and the x-axis represents time (10 min scale). Both tracings illustrate an initial rapid upward deflection following the administration of Phenylephrine (PE), signifying smooth muscle contraction. This is followed by a plateau phase. Subsequently, a series of downward-pointing arrows indicate the cumulative administration of p-cymene (10⁻⁶ to 10⁻³ M), which induces a concentration-dependent relaxation (vasodilation) of the pre-contracted rings. Tracing (a) represents an aortic ring with intact endothelium, showing a gradual relaxation response. Tracing (b) represents a ring without endothelium, exhibiting a more rapid and pronounced relaxation pattern. This comparison is used to study the endothelium-dependent versus endothelium-independent mechanisms of vasodilatory compounds. Key educational concepts include vascular smooth muscle contraction, dose-response relationships, and the role of the endothelium in vascular tone regulation.
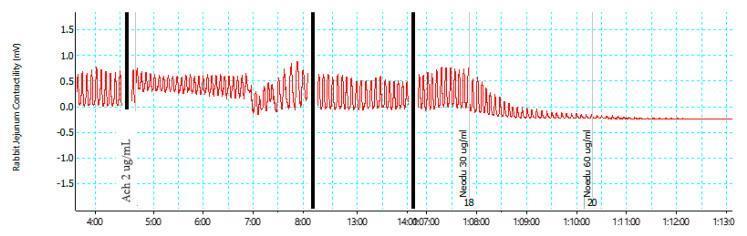
This physiological tracing illustrates a pharmacological study of gastrointestinal motility, specifically measuring the contractility of an isolated rabbit jejunum over time. The graph, plotted as millivolts (mV) against time, demonstrates the effects of different pharmacological agents on smooth muscle activity. The baseline displays regular, rhythmic spontaneous contractions with consistent amplitude. Following the administration of Acetylcholine (Ach) at 2 µg/mL, a muscarinic agonist, the contractile pattern is modulated. Subsequent administration of 'Neodu' (neodulin), an isolated compound from N. mitis, shows a concentration-dependent inhibitory effect. At 30 µg/mL, there is a visible reduction in both the amplitude and frequency of the rhythmic contractions. Following the administration of a higher dose (60 µg/mL), the tracing shows a near-complete abolition of motility, with the line flattening toward a baseline level, indicating profound smooth muscle relaxation. This diagnostic-style tracing is used in pharmacology and physiology education to demonstrate concentration-response relationships and the mechanism of spasmolytic or antispasmodic agents on intestinal tissue.
Isolated Heart Tissue - Effect of Drugs on Kymograph Paper
Aim
Principle
Requirements
- Starling's heart lever with stylet
- Kymograph with smoked recording drum
- Reservoir, tubing, screw clips
- Heart cannula (Langendorff or Straub cannula)
- Clamp, boss head, pin hook, thread, syringe and needle, stand
- Perfusion solution (PSS): Frog Ringer's solution
- Temperature: 37°C
- Aeration: Carbogen (95% O2 + 5% CO2)
Stock Solution Preparation (100 ml, Dose = 10 mg/kg)
Formula
Stock concentration (mg/ml) = Dose (mg/kg) ÷ Injection volume (ml/kg) Standard injection volume = 10 ml/kg → Concentration = 10/10 = 1 mg/ml
| S.No. | Drug | Molecular Weight | Dose | Stock Concentration (100 ml) | Amount to Weigh | Solvent |
|---|---|---|---|---|---|---|
| 1 | Adrenaline (Epinephrine) | 183.2 g/mol | 10 mg/kg | 10 mcg/ml (working: 1:100 dilution of 1 mg/ml stock) | Weigh 0.1 mg dissolved in 10 ml, then dilute to 100 ml → 10 mcg/ml | Frog Ringer's solution (acidified, pH 4-5 to prevent oxidation) |
| 2 | Noradrenaline (Norepinephrine) | 169.2 g/mol | 10 mg/kg | 10 mcg/ml | Same as above: 1 mg in 100 ml Ringer's → dilute 1:100 for 10 mcg/ml working solution | Acidified Ringer's (0.1% ascorbic acid to prevent oxidation) |
| 3 | Propranolol HCl | 295.8 g/mol | 10 mg/kg | 1 mg/ml (1000 mcg/ml) | Weigh 100 mg, dissolve in small volume of distilled water, make up to 100 ml with Ringer's solution | Distilled water / Ringer's |
| 4 | Atropine Sulphate | 694.8 g/mol | 10 mg/kg | 1 mg/ml | Weigh 100 mg, dissolve and make up to 100 ml with Ringer's solution | Distilled water / Ringer's |
Step-by-step Preparation
- Weigh 1 mg of adrenaline hydrochloride accurately.
- Dissolve in 2-3 ml of 0.01N HCl (prevents oxidation).
- Make up to 100 ml with Frog Ringer's solution.
- This gives 10 mcg/ml stock. Store in amber bottle, use fresh.
- Weigh 1 mg noradrenaline bitartrate.
- Dissolve in acidified Ringer's (add 2-3 drops of 0.1% ascorbic acid).
- Make up to 100 ml. Final concentration: 10 mcg/ml.
- Weigh 100 mg propranolol hydrochloride.
- Dissolve in 5 ml distilled water, then make up to 100 ml with Ringer's solution.
- Concentration: 1 mg/ml (1000 mcg/ml). Inject 0.1-0.8 ml into heart.
- Weigh 100 mg atropine sulphate.
- Dissolve in 5 ml distilled water, make up to 100 ml with Ringer's.
- Concentration: 1 mg/ml. Inject 0.1-0.8 ml.
Procedure
- Pith the frog (spinal pithing) to destroy the CNS. Expose the heart without damaging it.
- Cannulate the heart via the aorta using the Straub cannula filled with Ringer's solution. Ligate the venous sinuses to prevent backflow.
- Mount the cannulated heart on the Langendorff apparatus. Perfuse with oxygenated Ringer's at 37°C.
- Attach Starling's heart lever to the apex of the heart using a thread and pin hook.
- Allow the stylus of the lever to rest on the smoked kymograph drum.
- Record normal baseline contractions for 2-3 cm on the drum (noting rate and amplitude).
- Apply each drug as small injections (0.1, 0.2, 0.3, 0.8 ml) into the perfusion cannula and record tracing.
- After each drug, wash with fresh Ringer's until the heart returns to baseline before applying the next drug.
- Record heart rate (beats/min), amplitude (mm), and tone for each drug.
- Normal PSS (baseline) → 2. Adrenaline → (wash) → 3. Noradrenaline → (wash) → 4. Propranolol → (wash) → 5. Adrenaline after Propranolol (to demonstrate blockade) → (wash) → 6. Atropine
Observation Table
| S.No. | Drug & Dose | Heart Rate (beats/min) | Amplitude | Tone | Effect |
|---|---|---|---|---|---|
| 1 | PSS (baseline) | ~65 | Normal | Normal | - |
| 2 | Adrenaline 0.1 ml | Increased | Increased | Normal | + chronotropic, + inotropic |
| 3 | Adrenaline 0.2 ml | More increased | More increased | Normal | Dose-dependent increase |
| 4 | Noradrenaline 0.1 ml | Mildly increased | Increased | Normal | + inotropic > chronotropic |
| 5 | Noradrenaline 0.2 ml | Mildly increased | More increased | Normal | - |
| 6 | Propranolol 0.1 ml | Slight decrease or no change | Slight decrease or no change | Normal | Minimal alone |
| 7 | Propranolol 0.8 ml | Slight decrease | Slight decrease | Normal | Mild - chronotropic |
| 8 | Adrenaline after Propranolol | No increase (blocked) | No increase (blocked) | Normal | Beta blockade demonstrated |
| 9 | Atropine 0.1 ml | Slight increase or no change | Slight increase or no change | Normal | Minimal alone |
Effects on Kymograph Tracings
1. Adrenaline (Epinephrine)
- Receptor: Acts on both α and β1 adrenergic receptors on the heart.
- Chronotropic effect: Positive - increases heart rate. Beats appear closer together on the tracing.
- Inotropic effect: Positive - increases force of contraction. Amplitude of the tracing increases.
- Kymograph appearance: Tracing shows increased height of each wave AND compressed spacing between waves (more beats per unit time).
- Mechanism: Stimulates β1 receptors → increases cAMP → activates protein kinase A → phosphorylates L-type Ca²+ channels → increased intracellular Ca²+ → increased contraction force and SA node firing rate.
2. Noradrenaline (Norepinephrine)
- Receptor: Primarily β1 and α1; weaker β2 action than adrenaline.
- Chronotropic effect: Mildly positive (or sometimes reflex bradycardia due to baroreceptor activation from peripheral vasoconstriction via α1).
- Inotropic effect: Positive - increased force of contraction (similar to adrenaline).
- Kymograph appearance: Amplitude increases significantly. Heart rate increase is less pronounced than with adrenaline. In some preparations, a slight slowing due to reflex vagal activation may be seen.
- Key difference from Adrenaline: Noradrenaline produces a stronger vasopressor (peripheral) effect; its direct cardiac stimulation is similar but the net heart rate change is less pronounced.
3. Propranolol (Beta-blocker)
- Receptor: Competitive, non-selective β1 and β2 adrenergic receptor antagonist.
- Effect alone: Minimal change in heart rate or force at low doses. At high doses, slight negative chronotropy and inotropy.
- Effect after Adrenaline: Completely abolishes the tachycardia and increased amplitude caused by adrenaline - this is the key demonstration. After propranolol pretreatment, adrenaline fails to increase heart rate or force.
- Kymograph appearance alone: Tracing remains near baseline. After adrenaline + propranolol: the tracing shows the adrenaline response is blocked - rate and amplitude return toward baseline or are prevented from rising.
- Mechanism: Blocks β1 receptors on SA node and myocardium → prevents catecholamine-mediated cAMP increase.
4. Atropine (Muscarinic antagonist)
- Receptor: Competitive antagonist at M2 muscarinic receptors on the SA node and AV node.
- Effect alone: Slight increase in heart rate (unmasking of sympathetic tone by removing vagal tone). May show slight positive chronotropy.
- Effect after ACh (if tested): Completely abolishes bradycardia and cardiac arrest produced by acetylcholine.
- Kymograph appearance alone: Tracing shows small increase in rate and amplitude, or minimal change. The key demonstration is blocking ACh-induced cardiac depression.
- Mechanism: Blocks vagal (parasympathetic) M2 receptors → prevents Gi-mediated decrease in cAMP and IKACh channel opening → removes parasympathetic brake → slight tachycardia.
Kymograph Tracing Diagram (Schematic)
Normal PSS:       __/‾\_/‾\_/‾\_/‾\_      (regular amplitude, regular rate)

Adrenaline:       __/‾‾\./‾‾\./‾‾\./‾‾\.  (↑ amplitude, ↑ rate - waves closer + taller)

Noradrenaline:    __/‾‾\_/‾‾\_/‾‾\_       (↑ amplitude, slight ↑ or same rate)

Propranolol       __/‾\_/‾\_/‾\_          (minimal change or slight ↓)
(alone):

After Propranolol + Adrenaline:
                  __/‾\_/‾\_/‾\_          (no increase - blockade demonstrated)

Atropine          __/‾\_/‾‾\_/‾‾\         (slight ↑ amplitude and/or rate)
(alone):
Summary Table - Pharmacological Effects
| Drug | Receptor Acted On | Heart Rate | Force of Contraction | Tone | Classification |
|---|---|---|---|---|---|
| Adrenaline | β1, β2, α1 | ↑↑ (positive chronotropic) | ↑↑ (positive inotropic) | Normal | Sympathomimetic |
| Noradrenaline | β1, α1 > β2 | ↑ (mild; may show reflex ↓) | ↑↑ (positive inotropic) | Normal | Sympathomimetic |
| Propranolol | β1, β2 (blocker) | ↔ (alone); blocks Adr effect | ↔ (alone); blocks Adr effect | Normal | Beta-blocker / Sympatholytic |
| Atropine | M2 (blocker) | ↑ (slight, alone); blocks ACh bradycardia | ↑ (slight) | Normal | Anticholinergic / Parasympatholytic |
Discussion
-
Adrenaline and Noradrenaline both produce positive chronotropic (increased rate) and positive inotropic (increased force) actions. On the kymograph, this appears as taller waves that occur more frequently. Adrenaline has a more pronounced effect on heart rate than noradrenaline because of its greater β2 and β1 stimulation without the significant reflex vagal counteraction seen with noradrenaline's strong peripheral vasoconstriction.
-
Propranolol alone produces minimal visible effect at low doses, but its role is best demonstrated by prior administration of adrenaline: after propranolol, re-administration of adrenaline fails to produce any increase in rate or force - confirming β receptor blockade.
-
Atropine alone produces a slight increase in heart rate due to removal of resting vagal tone. Its main pharmacological demonstration is the prevention of acetylcholine-induced bradycardia/cardiac arrest.
-
The isolated heart model cleanly demonstrates the principle of pharmacological antagonism - both competitive (propranolol vs. adrenaline; atropine vs. ACh) and allows dose-response relationships to be visualized directly on kymograph paper.
Precautions
- Use fresh Ringer's solution at 37°C throughout.
- Wash the heart thoroughly between drug applications to allow recovery.
- Do not over-stretch the heart lever thread.
- Prepare catecholamine solutions fresh and protect from light and oxidation.
- Record the smoked paper carefully; fix with lacquer after recording.
- Apply drugs at regular intervals, only after complete recovery from the previous drug.