
Give me image for bicillary dysentery with medicines give me hamdwritten notes and diagrams included
Shigella bacillary dysentery pathology diagram
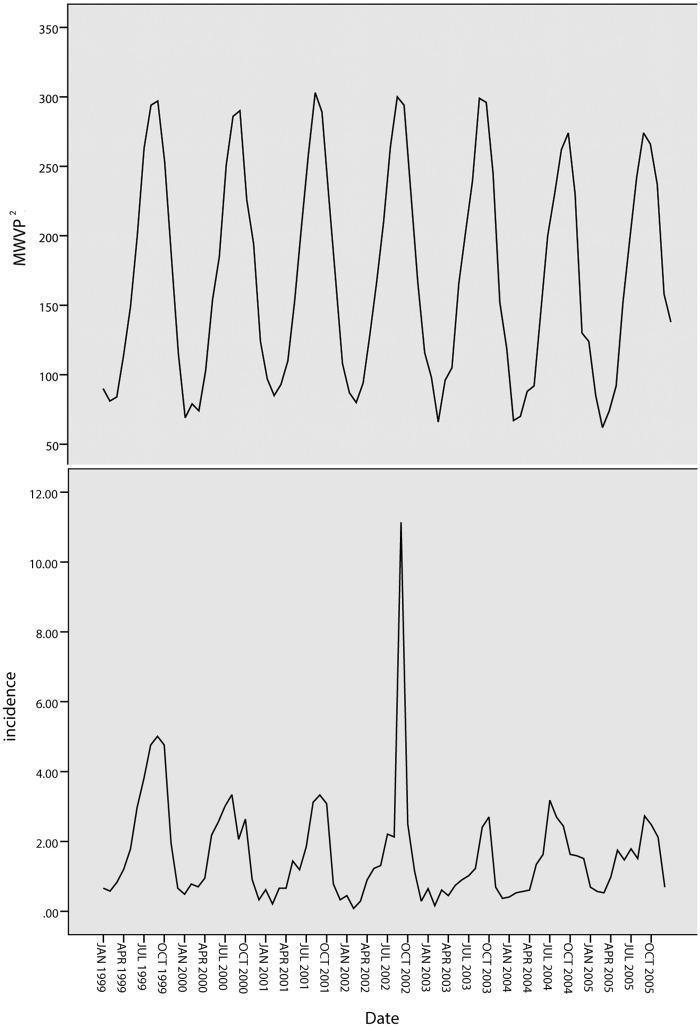
This dual-panel line graph illustrates the temporal relationship between climate factors and disease incidence in Quzhou, China, specifically focusing on Bacillary Dysentery (BD). The x-axis represents a timeline from January 1999 to October 2005. The upper panel tracks MWVP2 (Mean Weekly Vapor Pressure squared), showing a highly regular, cyclical, sinusoidal pattern with annual peaks approaching 300 and troughs near 50. The lower panel displays the incidence rates of Bacillary Dysentery per 100,000 residents. The incidence data exhibits a seasonal trend that correlates with the MWVP2 cycles, peaking in the summer and autumn months (June to October). A significant outlier is visible in late 2002, where a sharp spike in incidence exceeds 10.00, contrasting with typical annual peaks between 2.00 and 5.00. This visualization serves as an epidemiological tool for studying the influence of environmental vapor pressure on the transmission and seasonal outbreaks of enteric infections.
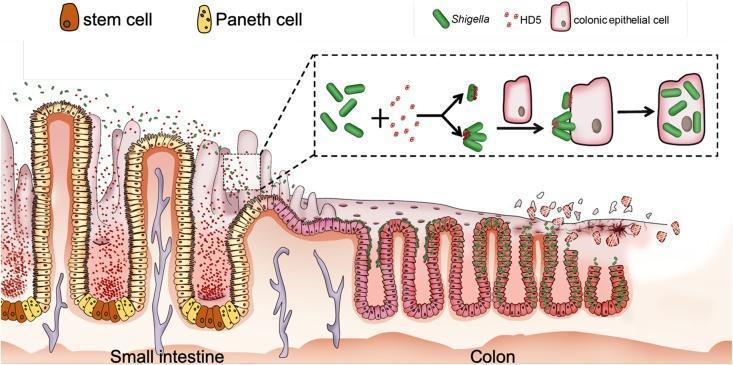
This pathophysiology diagram illustrates the proposed mechanism by which human alpha-defensin 5 (HD5) promotes Shigella infection in the colonic epithelium. The visual is divided into two main sections: the small intestine and the colon. In the small intestine section, the epithelium is characterized by long villi containing stem cells (brown) and Paneth cells (yellow) at the crypt bases. Paneth cells are shown secreting HD5 (red dots) into the intestinal lumen, where they encounter rod-shaped Shigella bacteria (green). A detailed inset shows the molecular interaction: HD5 binds to the bacterial surface, acting as a molecular bridge or causing bacterial clustering to enhance adhesion. In the colon section, the epithelium transitions to a flatter structure with shorter crypts. The HD5-coated Shigella are depicted adhering to the apical surface of colonic epithelial cells (pink), followed by cellular invasion and intracellular replication. The rightmost portion of the diagram shows resulting tissue damage, epithelial sloughing, and loss of mucosal integrity, highlighting the clinical significance of defensins as unintended facilitators of bacterial pathogenicity in certain gastrointestinal infections.
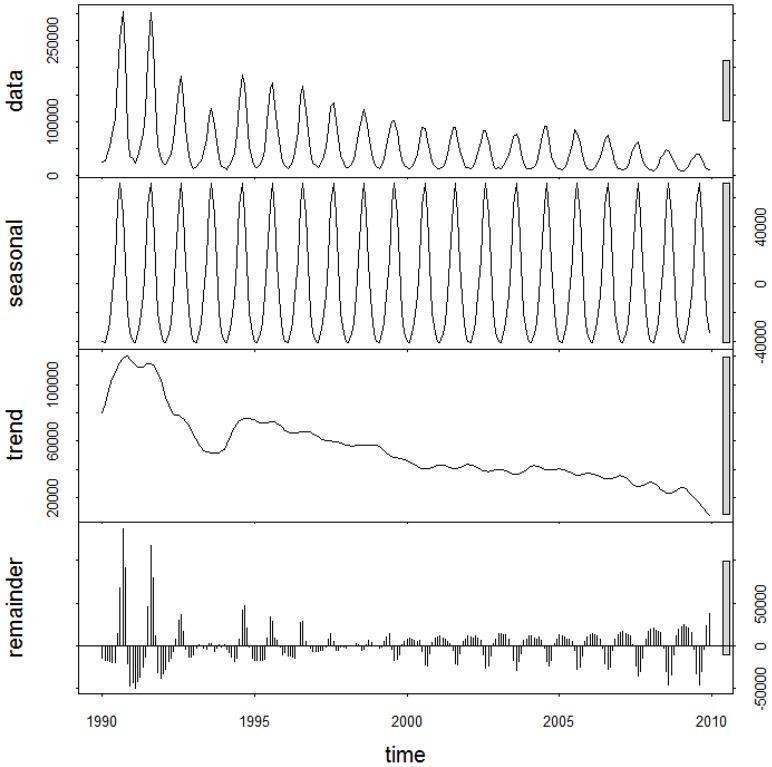
This infographic displays a decomposed time series analysis of monthly bacillary dysentery (BD) morbidity in China from 1990 to 2009. The figure is divided into four stacked panels representing the components of the time series: 'data', 'seasonal', 'trend', and 'remainder'. The top 'data' panel shows the raw monthly case counts, illustrating high-amplitude peaks initially exceeding 250,000 cases that gradually diminish over the two-decade span. The 'seasonal' panel reveals a highly consistent, periodic oscillation with stable amplitude (ranging from -40,000 to 40,000), indicating a regular annual peak in summer and autumn. The 'trend' panel demonstrates a clear, long-term decline in disease burden, showing a significant reduction in overall morbidity from approximately 100,000 baseline cases in the early 1990s to nearly 20,000 by 2009. The bottom 'remainder' panel illustrates stochastic noise or irregular fluctuations not captured by the seasonal or trend components. This epidemiological visualization is used to analyze the effectiveness of public health interventions and environmental influences on infectious disease transmission patterns over time.
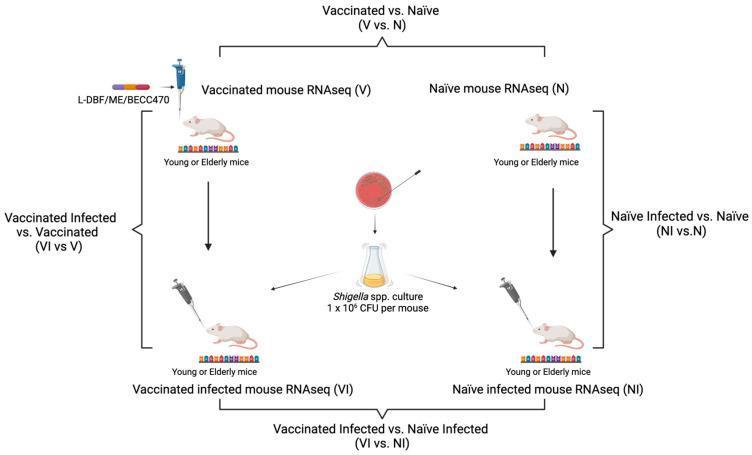
An experimental workflow diagram illustrating a murine study design for bulk RNA-seq analysis of vaccine efficacy against Shigella infection. The layout identifies four primary experimental groups involving young and elderly mice: Vaccinated (V), Naïve (N), Vaccinated Infected (VI), and Naïve Infected (NI). The immunization step involves the administration of a 'L-DBF/ME/BECC470' vaccine formulation via pipette. The infection challenge is represented by a 'Shigella spp. culture' at a concentration of 1 x 10⁶ CFU per mouse, administered to both the vaccinated and naïve cohorts. Brackets indicate four critical comparative analyses for transcriptomic profiling: (1) Vaccinated vs. Naïve (V vs. N) to assess the baseline vaccine response; (2) Naïve Infected vs. Naïve (NI vs. N) to define the host response to infection; (3) Vaccinated Infected vs. Vaccinated (VI vs. V) to identify infection-induced changes in vaccinated subjects; and (4) Vaccinated Infected vs. Naïve Infected (VI vs. NI) to determine the mechanism of vaccine-mediated protection. This diagram serves as a methodological framework for immunology and vaccine development research.
Handwritten medical student notes on "Bacillary Dysentery (Shigellosis)" with diagrams. Include: Title "BACILLARY DYSENTERY (Shigellosis)" underlined. Section: CAUSATIVE AGENT - Shigella spp. (S. dysenteriae, S. flexneri, S. sonnei, S. boydii), Gram-negative rod, non-motile. Section: PATHOGENESIS diagram showing fecal-oral route arrow to mouth, then Shigella invading colonic epithelium, intracellular spread, mucosal ulceration. Section: CLINICAL FEATURES - incubation 1-4 days, watery diarrhea then bloody mucoid stools, fever, tenesmus, abdominal cramps, complications: HUS, Reiter syndrome. Section: TREATMENT box with medicines: 1st line - Ciprofloxacin 500mg BD x 3-5 days; Children - Azithromycin 10mg/kg/day x 3 days; Alternatives - Ceftriaxone, Pivmecillinam; Avoid: Antidiarrheals (loperamide). Section: SUPPORTIVE CARE - ORS, adequate hydration. Hand-drawn arrows, underlining, star bullets, colorful highlights in blue, red, green ink on white lined paper background. Looks like authentic medical student handwritten notes.
Error calling model 'gemini-3-pro-image' (RESOURCE_EXHAUSTED): 429 RESOURCE_EXHAUSTED. {'error': {'code': 429, 'message': 'Resource has been exhausted (e.g. check quota).', 'status': 'RESOURCE_EXHAUSTED'}}
We encountered an error while processing your request. Please try again or reach out to us for help.