
Hyperkalemia correction
"hyperkalemia"[MeSH Terms] AND "treatment"[MeSH Terms]
hyperkalemia ECG changes treatment
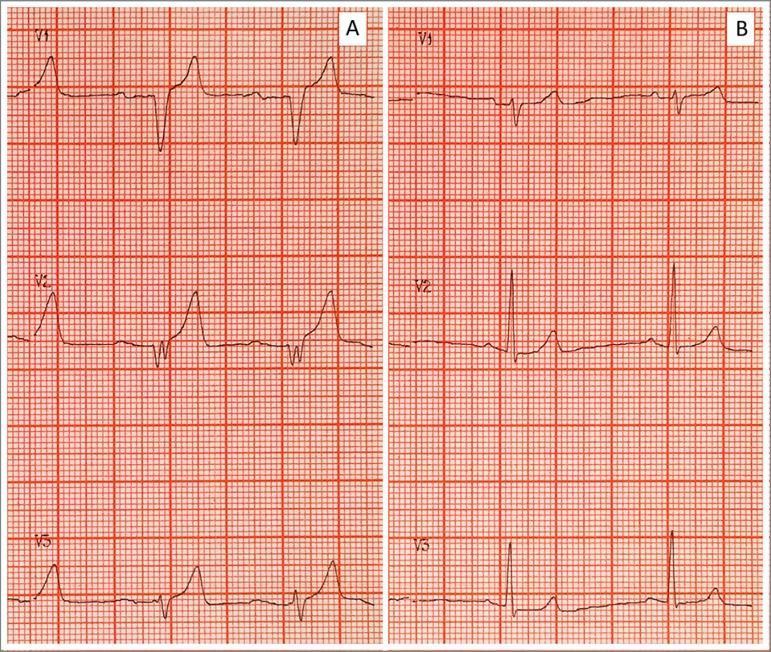
Side-by-side comparison of two electrocardiogram (ECG) tracings (A and B) demonstrating the classic cardiotoxic evolution and subsequent resolution of severe hyperkalemia. Panel A (Pretreatment) displays several pathognomonic findings including prominent, tall, tented, or 'peaked' T-waves; significant flattening and widening of the P-waves; a prolonged PR interval; and a widened QRS complex with a 'sine-wave' appearance in certain leads. These features reflect impaired atrial and ventricular conduction and delayed repolarization associated with elevated serum potassium (e.g., 9.25 mEq/L). Panel B (Post-treatment) shows the results of medical intervention (such as calcium gluconate, insulin/glucose, and bicarbonate), characterized by the normalization of the ECG morphology. Key changes in Panel B include the return of distinct P-waves, narrowing of the QRS complex to normal duration, and a reduction in T-wave amplitude to a typical physiological morphology. The images are shown on standard ECG grid paper, facilitating the assessment of interval and complex durations.
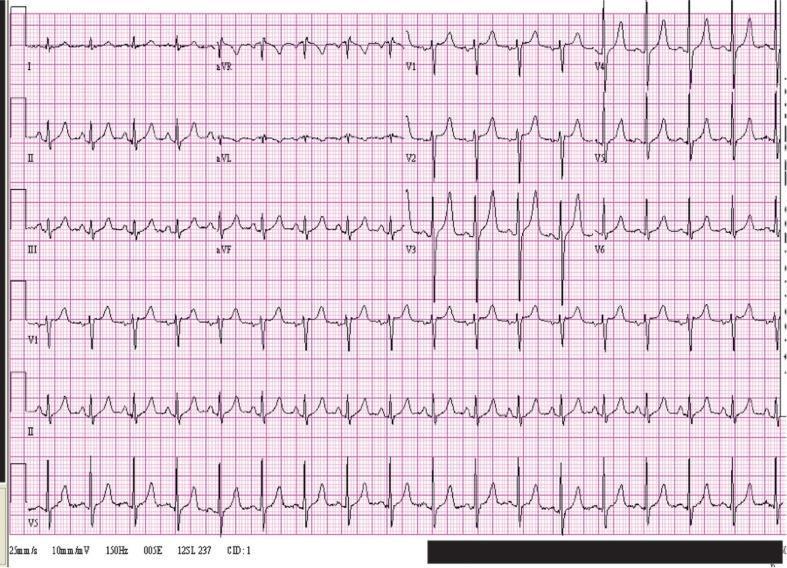
A standard 12-lead electrocardiogram (ECG) demonstrating findings characteristic of moderate hyperkalemia. The diagnostic tracing shows all standard leads (I, II, III, aVR, aVL, aVF) and precordial leads (V1-V6). Key findings include prominent, symmetrical, peaked T waves most evident in the precordial leads V2 through V4, though they appear less extreme than in severe hyperkalemia cases. The QRS complexes are relatively narrow, approximately 80 msec in duration, following clinical intervention for an elevated potassium level (noted as 5.9 mEq/L). The rhythm appears sinus, though P-wave amplitude may be subtly diminished. This diagnostic image serves as an educational example of the dynamic evolution of ECG changes during the treatment of electrolyte imbalances, specifically showing the narrowing of the QRS complex and the residual prominence of T waves as hyperkalemia begins to resolve.
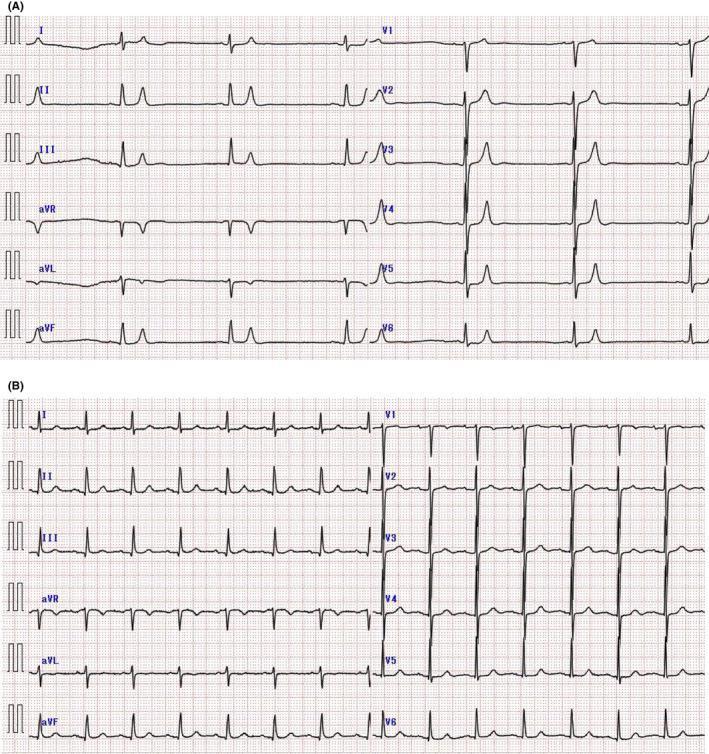
This comparison chart consists of two 12-lead electrocardiograms (ECGs) demonstrating the classic visual progression and resolution of severe hyperkalemia. Panel A shows an ECG from a patient with a serum potassium level of 9.2 mEq/L, characterized by profound bradycardia (37 bpm), diminished P-wave amplitude (atrial standstill precursor), and tall, narrow, 'tented' T-waves most prominent in the precordial leads V1-V6. Panel B displays the follow-up ECG after treatment (serum potassium 4.5 mEq/L), showing a return to normal sinus rhythm with a faster heart rate, clearly defined P-waves, and normalized T-wave morphology. The visual comparison serves as an educational tool for identifying life-threatening electrolyte imbalances, specifically the early to mid-stage ECG manifestations of hyperkalemia. Key clinical markers highlighted include T-wave tenting and the impact of hyperkalemia on cardiac conduction and rhythm stability.
Hyperkalemia Correction
Step 0: First Actions
- Stop all potassium infusions immediately.
- Obtain an ECG - do not wait for lab results if clinical suspicion is high.
- Exclude pseudohyperkalemia (hemolysis, fist-clenching, thrombocytosis, leukocytosis).
ECG Progression in Hyperkalemia
| K⁺ level | ECG findings |
|---|---|
| ~5.5-6.0 | Tall, narrow, peaked (tented) T-waves, shortened QT |
| ~6.0-7.0 | Prolonged PR interval, P-wave flattening/loss |
| ~7.0-8.0 | Wide QRS complex, loss of R-wave amplitude |
| >8.0 | Sine-wave pattern → VF or asystole |
STEP 1 - Stabilize the Myocardium (Membrane Protection)
| Agent | Dose | Notes |
|---|---|---|
| 10% Calcium gluconate | 10 mL IV over 1-3 minutes | Preferred for peripheral IV (safer if infiltrates) |
| 10% Calcium chloride | 3-5 mL (or 10 mL) IV over 5-10 min | More elemental Ca²⁺ per ampule; risk of skin necrosis if extravasates - use central line |
- Effect is almost immediate but short-lived (30-60 min).
- If no ECG improvement in 3-5 minutes, repeat the dose.
- Caution with digoxin: calcium potentiates digoxin toxicity ("stone heart").
STEP 2 - Shift K⁺ Into Cells (Redistribution)
A. Insulin + Dextrose (fastest and most reliable)
- Insulin: 10 units regular insulin IV
- Dextrose: 50 mL of 50% dextrose (D50W, 1 ampule) as bolus, then 5% dextrose at 100 mL/hr to prevent late hypoglycemia
- K⁺ starts falling within 15 minutes, peak effect at ~60 min, lowers K⁺ by ~0.5-1.5 mEq/L
- Never give dextrose alone without insulin in patients with inadequate endogenous insulin - hyperglycemia worsens hyperkalemia by osmotic shift
- If glucose >300 mg/dL (diabetics), insulin can be given without dextrose
- Monitor glucose closely - hypoglycemia is common, especially in CKD (prolonged insulin half-life)
B. Inhaled Beta-2 Agonist (albuterol)
- Albuterol 20 mg nebulized over 10 minutes (much higher dose than for asthma)
- Onset ~30 minutes; lowers K⁺ by ~0.5-1.5 mEq/L
- Effect is additive to insulin
- Use the concentrated 5 mg/mL solution to minimize inhalation volume
- Caution in ischemic heart disease (tachycardia); up to 40% of patients are "non-responders"
C. Sodium Bicarbonate
- Useful only when metabolic acidosis is present (especially serum HCO₃⁻ <10 mmol/L)
- 50-100 mEq IV over 10-20 minutes
- Lowers K⁺ by enhancing renal excretion in patients with residual kidney function
- Not recommended as routine emergency treatment in ESKD/anuric patients - bicarbonate does not enhance the effect of insulin or albuterol
- Benefit is proportional to the severity of pretherapy acidemia
STEP 3 - Remove K⁺ from the Body
A. Loop Diuretics (furosemide)
- Effective if the patient has adequate residual kidney function
- Promotes kaliuresis; can be combined with IV saline to augment flow
B. Dialysis (Definitive)
- Indicated for ESKD, severe AKI, or refractory hyperkalemia
- Hemodialysis is the most effective and fastest method (removes ~25-50 mEq/hr)
- Cannot usually be initiated quickly enough to replace the emergency measures above - always do Steps 1 and 2 first
C. Potassium-Binding Resins (GI removal)
| Agent | Dose | Onset | Mechanism | Key Adverse Effects |
|---|---|---|---|---|
| Sodium polystyrene sulfonate (SPS, Kayexalate) | 50 g PO or retention enema in sorbitol | Hours to days | Na⁺-K⁺ exchange resin (colon) | Colonic necrosis (rare, FDA black-box warning, especially with sorbitol), hypernatremia, metabolic alkalosis |
| Patiromer (Veltassa) | 8.4 g once daily PO, titrate weekly | ~7 hours | Binds K⁺ in exchange for Ca²⁺ (colon) | Constipation, hypomagnesemia, GI upset. Separate from other oral meds by 3 hours |
| Sodium zirconium cyclosilicate (Lokelma) | 10 g three times daily x 48 hours, then 5-10 g once daily | ~1 hour | K⁺/H⁺/Na⁺ exchanger (entire GI tract) | Constipation, edema, can raise gastric pH (may affect pH-dependent drugs) |
NKF Treatment Flowchart
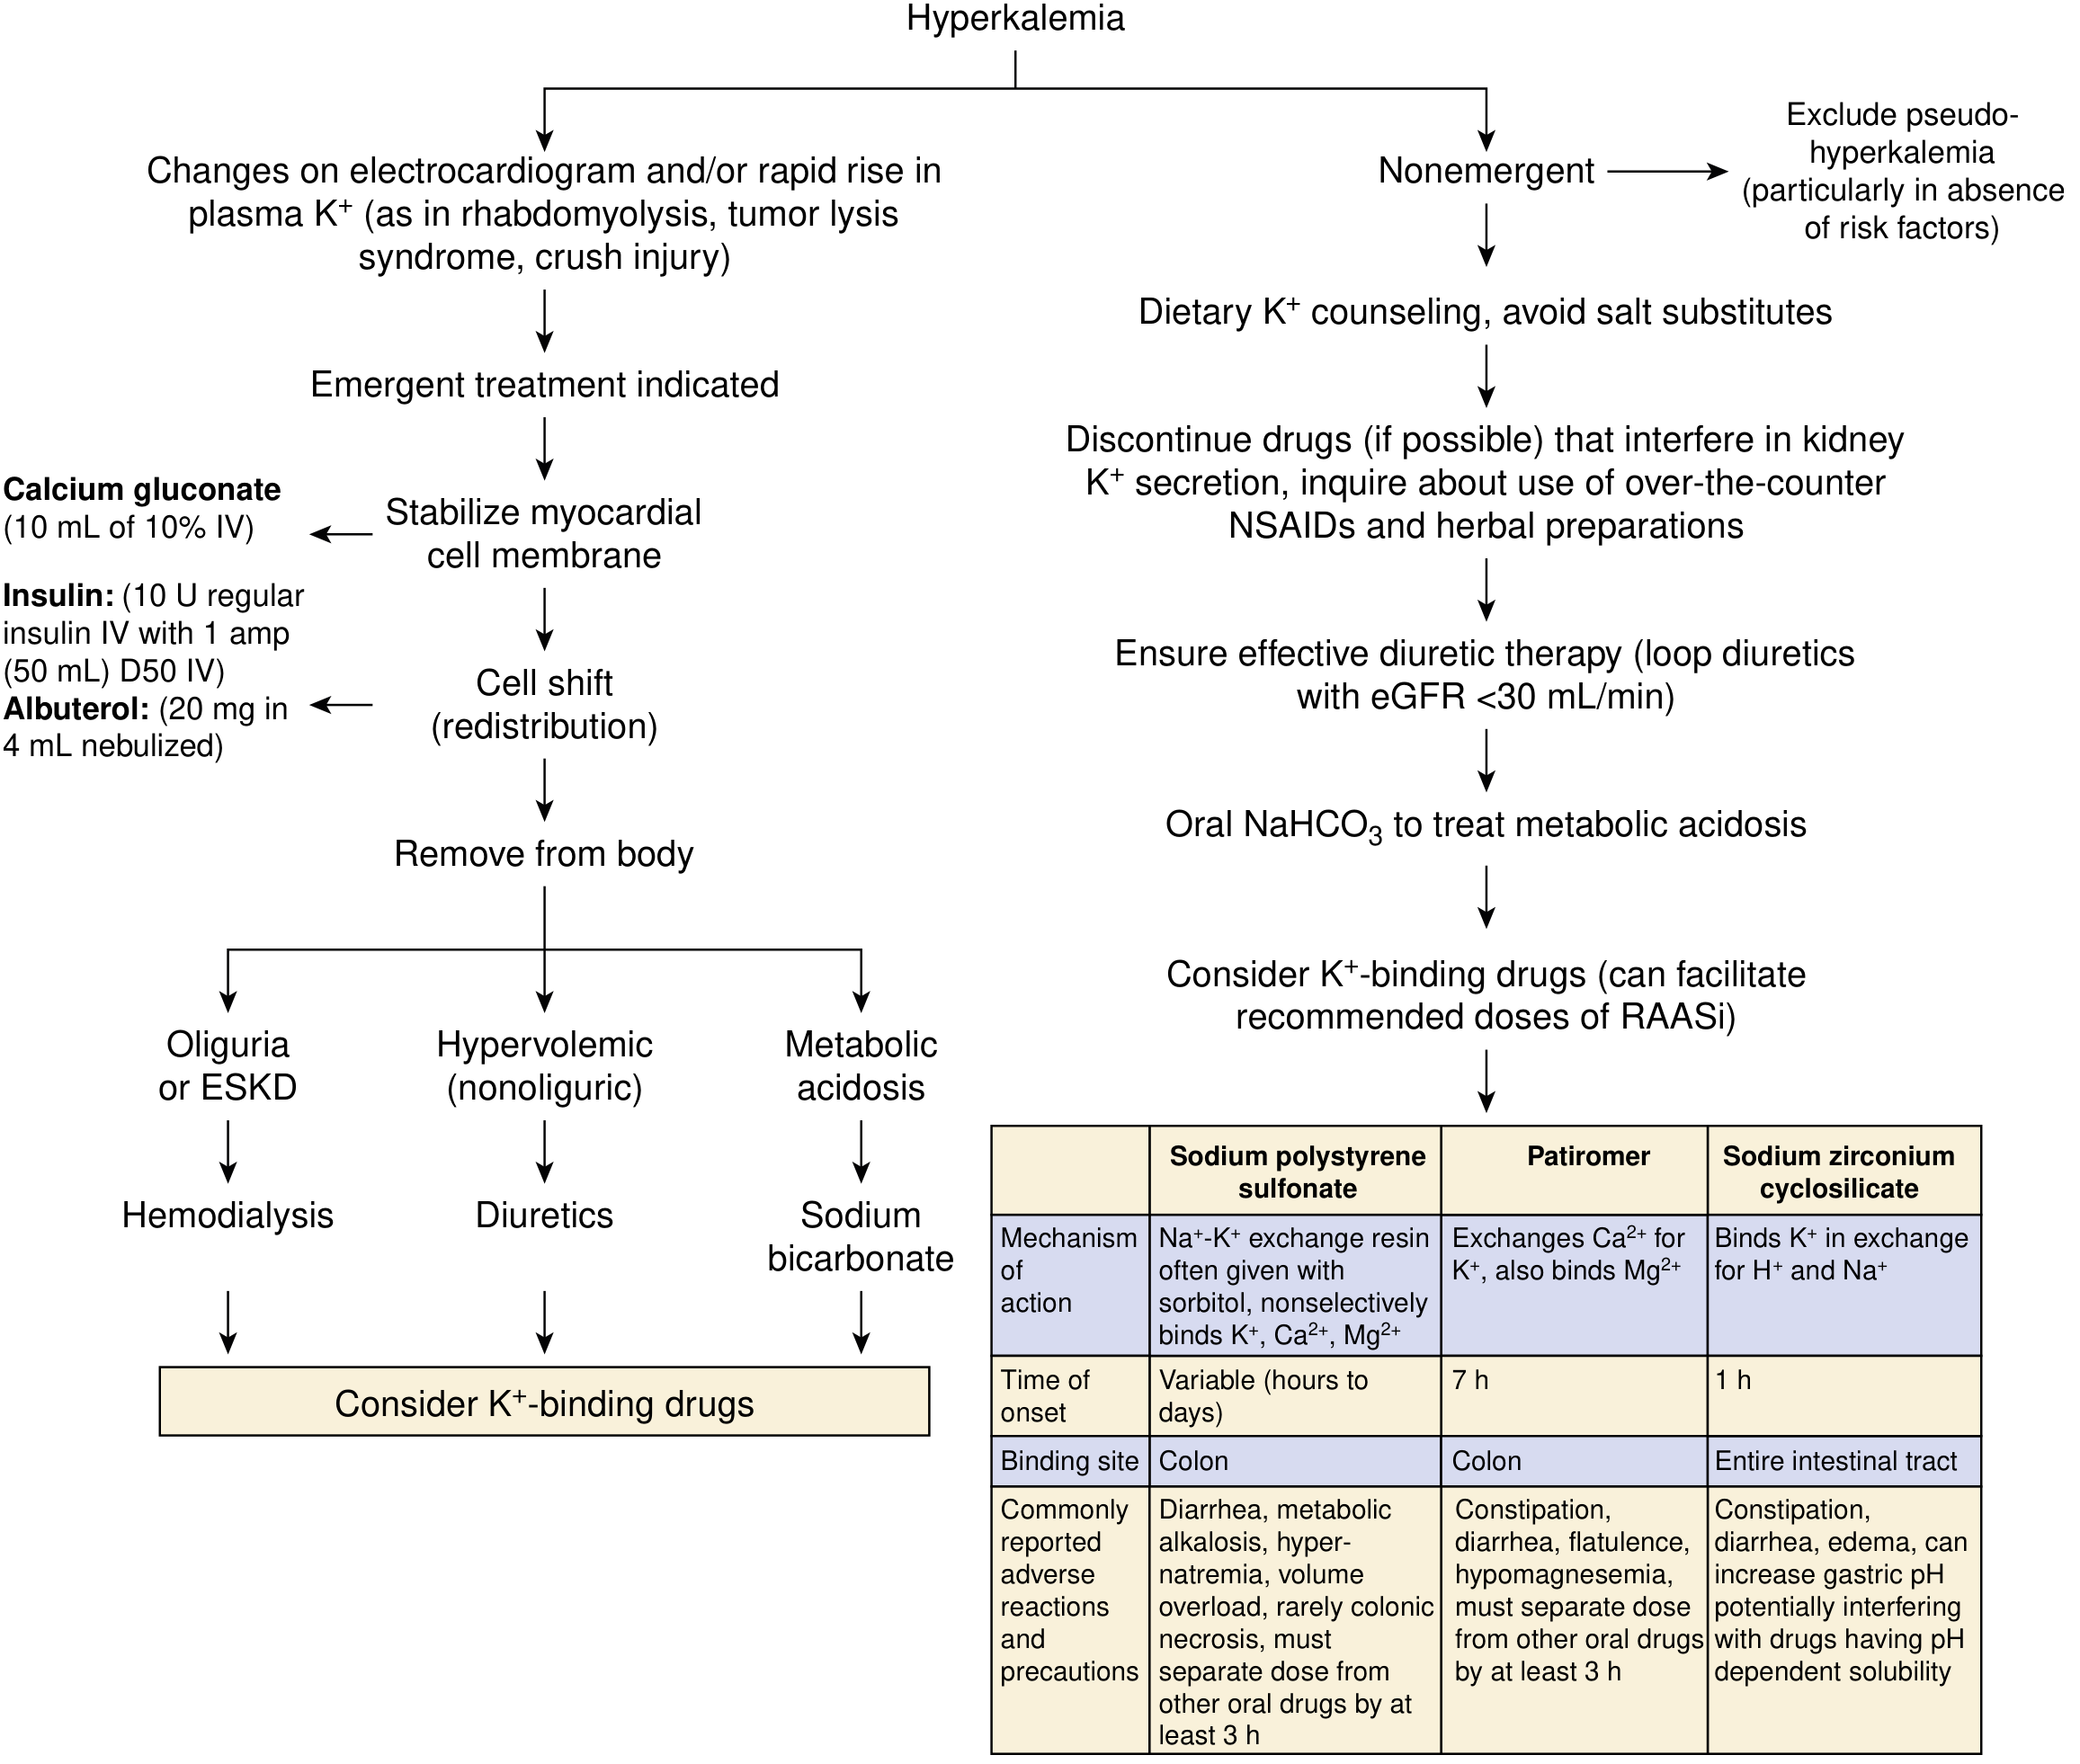
Non-Emergent / Chronic Hyperkalemia Management
- Dietary counseling - low-K⁺ diet, avoid salt substitutes (KCl)
- Discontinue or reduce offending drugs (ACEi, ARBs, NSAIDs, potassium-sparing diuretics, trimethoprim, heparin, beta-blockers)
- Treat metabolic acidosis - oral NaHCO₃
- Optimize diuretics - loop diuretics with eGFR <30 mL/min
- K⁺-binding drugs - patiromer or SZC to enable continued RAASi use
- Fludrocortisone for patients with hypoaldosteronism/mineralocorticoid deficiency
Special Scenarios
| Scenario | Key Consideration |
|---|---|
| CKD/ESKD | Even modest K⁺ loads are dangerous; succinylcholine relatively contraindicated (can cause acute K⁺ rise) |
| Digoxin toxicity | Avoid calcium IV (potentiates toxicity) - use magnesium sulfate instead |
| DKA | K⁺ may appear normal/high but total body K⁺ is depleted - replace K⁺ once insulin is started and K⁺ <5.0 |
| Cardiac arrest with suspected hyperkalemia | Treat empirically per ALS protocol |
| Pre-operative | Elective surgery contraindicated; succinylcholine contraindicated; avoid K⁺-containing IVF (LR) |
How fast should insulin in 25 D should be given
insulin 10 units dextrose 25g hyperkalemia administration rate IV bolus speed
Insulin + Dextrose for Hyperkalemia: Administration Rate
The Standard Regimen (10U Insulin + 25g Dextrose)
| Component | Dose | Rate |
|---|---|---|
| D50W (50% dextrose) | 50 mL = 25g | IV bolus over ~5 minutes |
| Regular insulin | 10 units | IV bolus over ~1-5 minutes, given after the dextrose |
Critical Sequencing Rule
Pre-treatment glucose guides the regimen:
| Glucose level | Action |
|---|---|
| <70 mg/dL | Do NOT give insulin. Treat hypoglycemia first |
| 70-140 mg/dL | Give dextrose 25g first, then 5 units insulin |
| 141-300 mg/dL | Give dextrose 25g first, then 10 units insulin |
| >300 mg/dL | Give 10 units insulin only - omit dextrose |
Why Not Give It Faster or Slower?
- A true bolus (under 1 min) achieves peak insulin effect fastest, but creates a prolonged hyperinsulinemic state - hypoglycemia in up to 75% of patients (especially CKD where insulin half-life is extended)
- A slower infusion over 15-30 min reduces peak insulin concentration while still achieving adequate K⁺ shift - this is the AHA preference for safety
- The PA Patient Safety Advisory specifically flags hypoglycemia after insulin-dextrose for hyperkalemia as a major preventable harm event
Post-Administration Monitoring
- Check blood glucose at 1 hour and 3 hours post-dose
- Follow with a continuous 5-10% dextrose drip at 50-100 mL/hr for several hours to prevent late hypoglycemia (especially in CKD/ESKD - insulin half-life is prolonged)
- Check K⁺ at 1-2 hours (expect a drop of 0.5-1.5 mEq/L)