
Diagram of anterior rhinoscopy
anterior rhinoscopy diagram anatomy nasal cavity
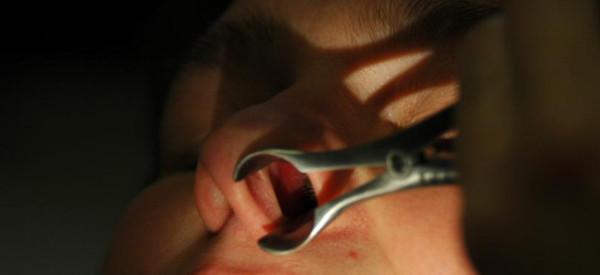
This clinical photograph demonstrates an anterior rhinoscopy procedure, a primary diagnostic technique in otorhinolaryngology. A metallic Killian or Thudichum-style nasal speculum is inserted into the left nostril (vestibulum nasi) and dilated to provide a clear view of the internal nasal structures. The image shows the application of a targeted light source, illuminating the anterior part of the nasal cavity. Visible landmarks include the nasal ala, the columella, and the internal mucosal lining. The procedure is used to evaluate the nasal septum for deviations, inspect the inferior turbinates for hypertrophy or inflammation, and assess the nasal mucosa for signs of allergic rhinitis, such as pallor, edema, or discharge. This procedural image is an essential teaching tool for medical students and residents learning the fundamental steps of a physical examination of the upper respiratory tract and the clinical workup for sino-nasal symptoms.
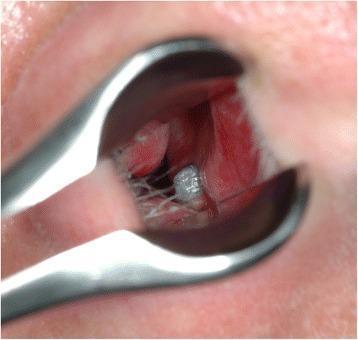
Clinical photograph of an anterior rhinoscopy demonstrating a foreign body in the right nasal cavity. A metallic, cylindrical, threaded titanium structure, representing the apical portion of a dental implant, is seen protruding through the nasal floor. The object is situated medially, adjacent to the nasal septum. The surrounding nasal mucosa appears erythematous and edematous, consistent with localized inflammatory response to the implant's perforation of the cortical bone of the maxilla. Thin, white fibrous or mucous strands are visible spanning the space between the implant and the lateral nasal wall. The image is captured through the blades of a nasal speculum, focusing on the interface between the oral surgical hardware and the respiratory epithelium. This finding illustrates a complication of dental implant placement where excessive vertical length leads to violation of the nasal cavity floor.
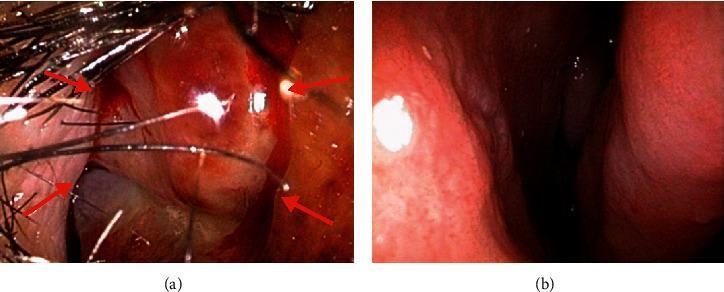
This diagnostic image consists of two side-by-side endoscopic views (a and b) of the nasal cavities, demonstrating a Comparison Chart format for clinical pathology. Panel (a) shows the right anterior nasal cavity, featuring a prominent, erythematous granulomatous mass with an irregular, cobblestone-like surface texture. Red arrows highlight the borders of the lesion, which appears highly vascularized. Nasal vibrissae (hairs) and specular reflections from the endoscope light source are visible in the foreground. In contrast, Panel (b) depicts the contralateral left nasal cavity, showing a healthy physiological state characterized by a smooth, uniform pinkish-red mucosal lining without masses or inflammation. This comparison is used in Otolaryngology to illustrate localized nasal pathology, such as infections (e.g., Mycobacterium marinum) or inflammatory conditions, and emphasizes the diagnostic utility of rhinoscopy in identifying abnormal tissue growth versus healthy anatomy.
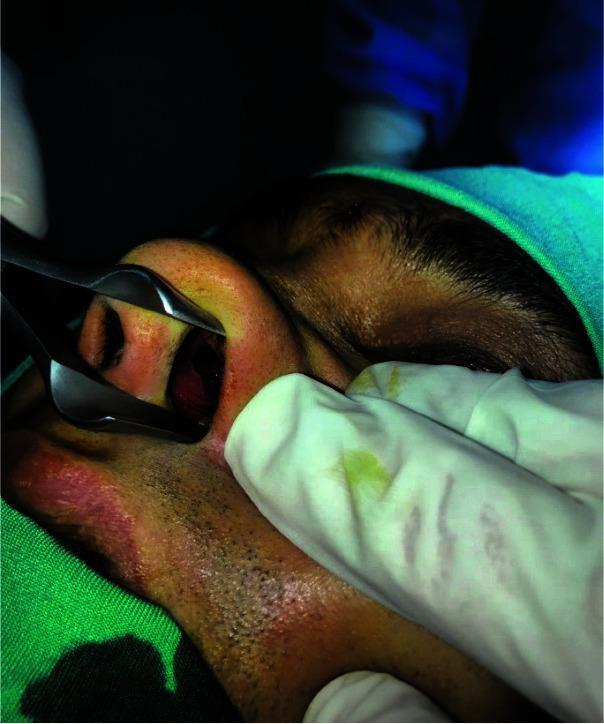
This intraoperative clinical photograph captures a preoperative nasal examination in a surgical setting. The image demonstrates the use of a metallic nasal speculum, with its blades spread to retract the right ala and dilate the nostril, providing visualization of the internal nasal anatomy. The focus is on the anterior nasal cavity, specifically intended for assessing a nasal septal perforation (NSP). The patient is draped in a sterile field with a green surgical cap visible. A clinician’s gloved hand is seen stabilizing the nasal area. The skin of the nose and cheek shows mild erythema and irritation. This visual is used in otorhinolaryngology and maxillofacial surgery to teach the technique of anterior rhinoscopy for diagnosing and measuring septal defects prior to surgical repair, such as a mucosal rotational flap procedure.
Anterior Rhinoscopy
- The speculum blades are inserted into the vestibule and gently opened vertically (superoinferiorly) - NOT laterally (to avoid pressure on the septum)
- A headlight or head mirror provides illumination
- Patient's head is positioned neutral first, then tilted back to see the middle meatus
| Position | Structures Seen |
|---|---|
| Head neutral | Nasal floor, inferior turbinate, inferior meatus, anterior septum |
| Head tilted back | Middle turbinate, middle meatus, attic area |
- Nasal septum - deviation, perforation, spurs, bleeding points
- Turbinates - hypertrophy, colour (pale = allergic, red = infective)
- Nasal mucosa - colour, discharge, polyps
- Nasal floor - foreign bodies, masses
Secondary otalgia
secondary otalgia referred ear pain nerve pathways diagram
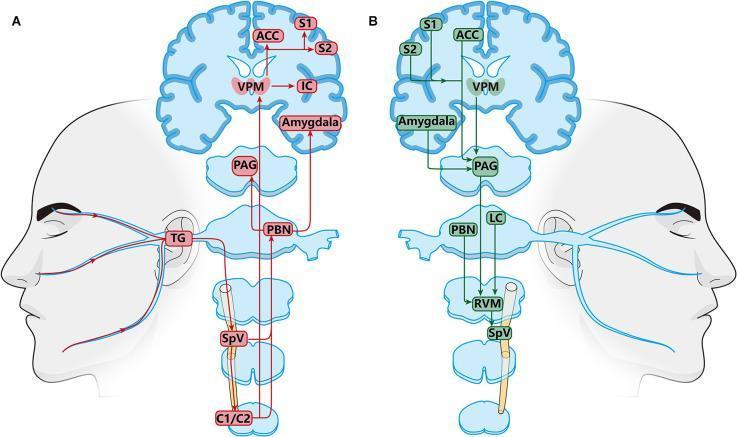
This medical schematic illustrates the neuroanatomical circuits involved in orofacial pain modulation, divided into ascending nociceptive pathways (Panel A) and descending modulatory pathways (Panel B). Panel A depicts the ascending pathway starting from the trigeminal nerve distribution on the face. Signals travel to the trigeminal ganglion (TG), then to the spinal trigeminal nucleus (SpV) and upper cervical spinal cord (C1/C2). From the brainstem, second-order neurons project to the parabrachial nucleus (PBN) and ventral posteromedial nucleus of the thalamus (VPM). These project to higher cortical and subcortical regions including the Amygdala, anterior cingulate cortex (ACC), insular cortex (IC), and primary/secondary somatosensory cortices (S1/S2). Panel B focuses on the descending regulation system, highlighting the periaqueductal gray (PAG) and rostral ventromedial medulla (RVM) as key relays. Feedback loops are shown from the ACC, S1, S2, and Amygdala back to the PAG and locus coeruleus (LC), which ultimately modulate nociceptive transmission at the level of the SpV. The diagram serves as a map for understanding the pathophysiology of chronic orofacial pain and central sensitization.
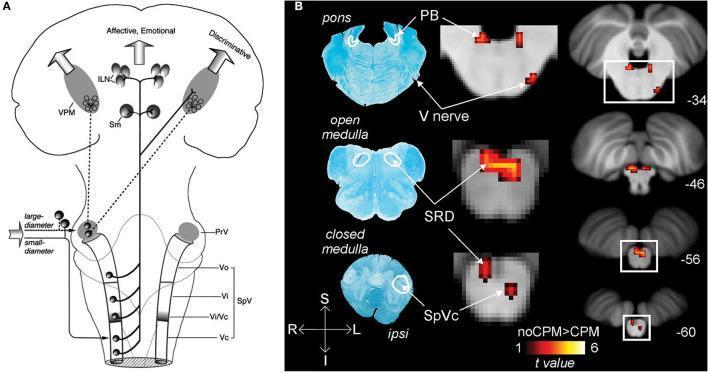
Educational medical graphic illustrating nociceptive pathways and brainstem fMRI activity related to pain modulation. Panel A is a neuroanatomical diagram showing the trigeminothalamic tract, tracing afferent signal transmission from the trigeminal nerve (V) through brainstem nuclei (PrV, SpV subnuclei) to the thalamus (VPM, ILN) and cortex. It differentiates between discriminative and affective-emotional pathways. Panel B presents histological and diagnostic data in axial sections across three levels: pons, open medulla, and closed medulla. On the left, myelin-stained sections identify key structures including the parabrachial nucleus (PB), subnucleus reticularis dorsalis (SRD), and spinal trigeminal nucleus caudalis (SpVc). In the center and right columns, corresponding fMRI activity maps demonstrate areas of decreased signal (red/yellow heat map) during conditioned pain modulation (CPM). These areas of inhibition correlate with the identified brainstem nuclei and the trigeminal nerve. The labels -34 to -60 indicate specific anatomical coordinates along the brainstem's superior-inferior axis.
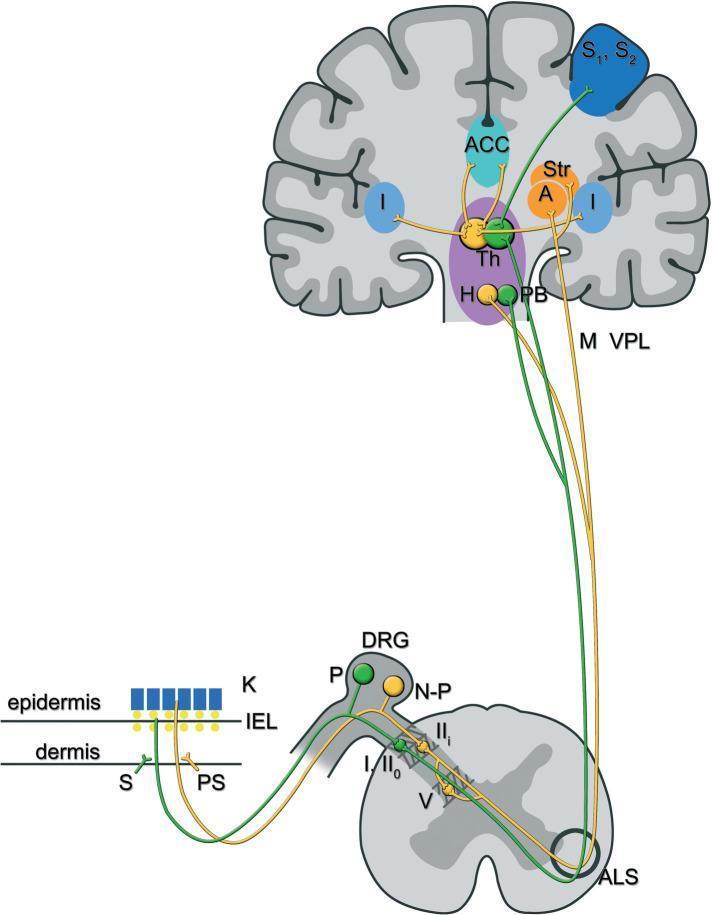
This pathophysiology diagram illustrates the lateral and medial ascending pain pathways, specifically focusing on peptidergic (green) and non-peptidergic (yellow) C-fibers involved in chemotherapy-induced peripheral neurotoxicity. The pathway begins in the skin layers (epidermis and dermis) where free nerve endings originate. Peptidergic fibers (P) and non-peptidergic fibers (N-P) have cell bodies in the dorsal root ganglion (DRG) and project to the spinal cord's dorsal horn. The peptidergic pathway synapses in laminae I and IIo, ascending via the anterolateral system (ALS) to the parabrachial nuclei (PB), thalamus (Th), and somatosensory cortex (S1, S2) and insula (I), mediating sensory-discriminative pain. The non-peptidergic pathway synapses in lamina IIi and V, ascending to the hypothalamus (H), amygdala (A), striatal nuclei (Str), and anterior cingulate cortex (ACC), mediating affective-emotional pain components. The diagram highlights anatomical structures including the keratinocytes (K), sympathetic (S) and parasympathetic (PS) fibers, and the Ventroposterolateral nucleus (VPL). This visual serves as an educational tool for understanding the neuroanatomical basis of different pain dimensions.
Secondary (Referred) Otalgia
Neuroanatomical Basis
| Nerve | Ear Supply | Remote Areas It Also Supplies |
|---|---|---|
| V - Trigeminal (auriculotemporal branch) | Anterior EAC, anterior auricle, TM | Teeth, TMJ, sinuses, oral cavity, nasopharynx |
| VII - Facial (nervus intermedius) | Posterior EAC | Salivary glands, palate |
| IX - Glossopharyngeal (Jacobson's / tympanic nerve) | Middle ear mucosa | Tonsil, tongue base, pharynx, epiglottis |
| X - Vagus (Arnold's nerve / auricular branch) | Posterior auricle, posterior EAC | Larynx, hypopharynx, oesophagus, heart |
| C2/C3 (greater auricular nerve) | Lower auricle, mastoid | Upper cervical spine, neck |
Causes by Site
1. Dental (Most Common)
- Dental caries / pulpitis - pain via V3 (mandibular division of trigeminal)
- Periapical abscess / acute apical periodontitis
- Pericoronitis from impacted/partially erupted wisdom teeth (chronic form = poorly localized jaw pain + referred otalgia)
- Temporomandibular joint (TMJ) dysfunction - otalgia reported in 64% of TMJ patients; bruxism is a major factor (>50% of cases); patients are more often female with elevated psychosocial stress
2. Pharyngeal / Tonsil
- Acute tonsillitis - referred via glossopharyngeal nerve (CN IX) - often obvious clinically
- Peritonsillar abscess
- Tonsillar malignancy - base of tongue, oropharyngeal SCC (often HPV-related in younger non-smokers)
3. Larynx / Hypopharynx
- Hypopharyngeal malignancy - otalgia + odynophagia are common presenting symptoms (via Arnold's nerve, CN X)
- Supraglottic carcinoma - otalgia may precede hoarseness
- Laryngopharyngeal reflux (LPR) - acid-sensitive upper airway mucosa; otalgia can occur without heartburn
4. Neck / Cervical Spine
- Cervical spondylosis / arthritis (C2/C3 via greater auricular nerve)
- Eagle syndrome - elongated styloid process irritating CN IX/X
- Cervical lymphadenopathy
5. Neuralgias
- Glossopharyngeal neuralgia - severe paroxysmal stabbing pain in ear/base of tongue/tonsil; triggered by swallowing, coughing, yawning; incidence 0.2-0.7/100,000/year; tympanic type (mainly ear) vs. oropharyngeal type; first-line: carbamazepine
- Geniculate neuralgia (nervus intermedius neuralgia)
- Post-herpetic neuralgia (following Herpes zoster oticus / Ramsay Hunt)
6. Malignancy (Always Consider)
- Otalgia may be the sole presenting symptom of upper aerodigestive tract malignancy
- Nasopharyngeal carcinoma: otalgia in 14% of cases as presenting symptom
- Infratemporal fossa tumours (adenoid cystic carcinoma most common) - via CN V, Arnold's, or Jacobson's nerve
- Temporal bone metastases (from breast, lung, kidney, stomach, prostate) - triad: otalgia + periauricular swelling + facial nerve weakness
7. Miscellaneous
- Cardiac - angina/MI can cause otalgia via vagal (CN X) pathways
- Nasal/sinus disease - posterior ethmoiditis or sphenoiditis via vidian nerve and greater superficial petrosal nerve
- Vestibular schwannoma - otalgia in 4-5% of cases; 25% have mastoid ache on direct questioning (compression of nervus intermedius or dural stretching)
- Cholesterol granuloma of petrous temporal bone
Clinical Approach
"Otalgia in the absence of discharge, hearing loss or otoscopic findings should be considered referred until proven otherwise." - Scott-Brown's Otorhinolaryngology
- Full otoscopy (to exclude primary otalgia)
- Oral cavity + oropharynx
- Flexible nasendoscopy (larynx, hypopharynx, nasopharynx)
- Neck palpation
- TMJ assessment (palpation, opening, crepitus)
- Dental examination
- MRI with gadolinium - if no cause found (rule out infratemporal fossa lesion, vestibular schwannoma)
- CT temporal bone - for suspected temporal bone malignancy
Glycerol test in ent
Glycerol Test in ENT (Glycerol Dehydration Test)
What It Is
Basis / Principle
Administration
| Parameter | Detail |
|---|---|
| Dose | Glycerol 1.2 mL/kg body weight |
| Diluent | Equal volume of physiological saline (to reduce GI side effects) |
| Route | Oral |
| Fasting | Patient should be fasted before the test |
Procedure
- Baseline audiogram (pure-tone audiogram - PTA) is recorded before glycerol administration
- Glycerol + saline mixture is given orally
- Serial audiograms are repeated at 1 hour, 2 hours, and 3 hours post-ingestion
- Some centres also measure speech discrimination score (SDS) and perform electrocochleography (ECoG)
Timeline of Effects
| Time Post-Ingestion | Expected Change |
|---|---|
| 1 hour | Patient begins to notice improvement in hearing, tinnitus, and ear fullness |
| 2-3 hours | Maximum effect - peak improvement in thresholds |
| After 3 hours | Symptoms gradually return to baseline |
Interpretation / Positive Test Criteria
- Improvement in pure-tone average (PTA) of ≥ 10 dB at two or more frequencies, OR
- Improvement in speech discrimination score (SDS) of ≥ 12%
Significance of a Positive Test
- Supports the diagnosis of endolymphatic hydrops (Ménière's disease)
- Suggests the patient may respond to dehydration therapy (low-sodium diet, diuretics such as acetazolamide or hydrochlorothiazide)
- Historically used to predict response to endolymphatic sac surgery
Limitations
| Limitation | Detail |
|---|---|
| Sensitivity | Approximately 40-60%; a negative result does NOT exclude Ménière's disease |
| Specificity | Not entirely specific; other causes of cochlear hydrops may also give positive results |
| False negatives | May occur in burnt-out or end-stage disease (no residual hair cells to recover) |
| False positives | Can occur in other causes of fluctuating SNHL |
| Side effects | Nausea, headache, diuresis, glycosuria, hypoglycaemia (rare) |
Clinical Context
- Electrocochleography (ECoG) - elevated summating potential/action potential (SP/AP) ratio >0.4 suggests hydrops
- Caloric testing - canal paresis on the affected side
- Audiogram - low-frequency SNHL, fluctuating
- Gadolinium-enhanced MRI - to rule out acoustic neuroma / CPA lesion
Malignant otitis externa