
Median nerve
median nerve anatomy course branches upper limb diagram
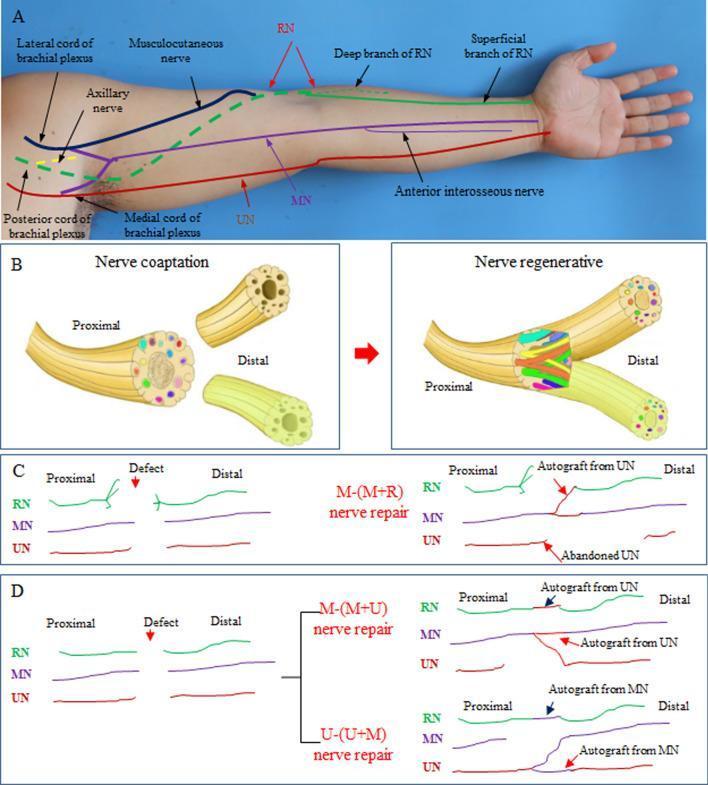
Educational medical illustration detailing upper limb nerve anatomy and surgical nerve merging repair techniques. Panel A is an anatomical diagram overlaid on a human arm showing the brachial plexus cords (lateral, posterior, medial) and the primary nerves: Musculocutaneous, Axillary, Radial (RN), Median (MN), and Ulnar (UN), including the deep and superficial RN branches and the anterior interosseous nerve. Panel B illustrates the concept of 'magnified nerve regeneration,' showing nerve coaptation where one proximal nerve trunk is sutured to two distal nerve segments to facilitate dual innervation. Panels C and D provide schematics of specific surgical protocols: M-(M+R) repair, where the proximal MN is connected to distal MN and RN segments while abandoning the UN; and M-(M+U) or U-(U+M) repairs, which utilize Y-shaped coaptations and autografts (often derived from sacrificed or donor segments) to bridge defects. The illustration serves as a clinical guide for repairing complex nerve avulsions or defects in the upper extremity by using fewer proximal donors to reinnervate multiple distal targets.
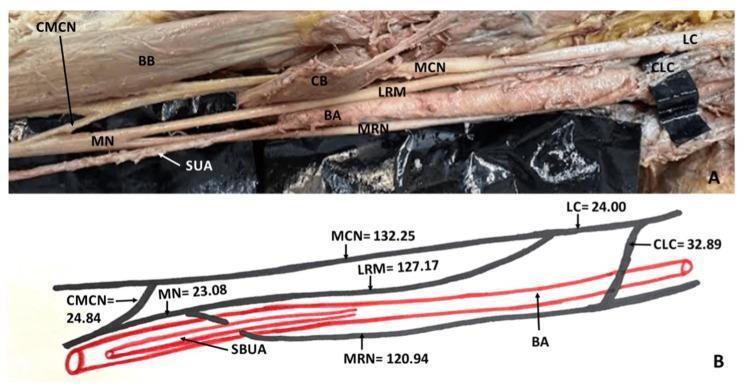
This educational composite presents a clinical photograph of a cadaveric dissection (A) and a corresponding schematic diagram (B) of the right upper limb, illustrating rare neurovascular variations in the arm. The content identifies a low formation of the median nerve (MN), occurring in the distal half of the arm by the union of the lateral root (LRM) and medial root (MRN). Anatomical highlights include a communicating branch (CMCN) between the musculocutaneous nerve (MCN) and the median nerve, and another communication (CLC) between the lateral cord (LC) and the medial root. A significant vascular anomaly is shown: a superficial brachioulnar artery (SBUA/SUA) originating high from the brachial artery (BA) and passing directly through the loop formed by the two roots of the median nerve. The schematic (B) provides precise morphometric measurements in millimeters for each neural segment. This material serves as a reference for anatomical variations in the brachial plexus and arterial supply of the upper extremity, relevant for surgical planning and gross anatomy education.
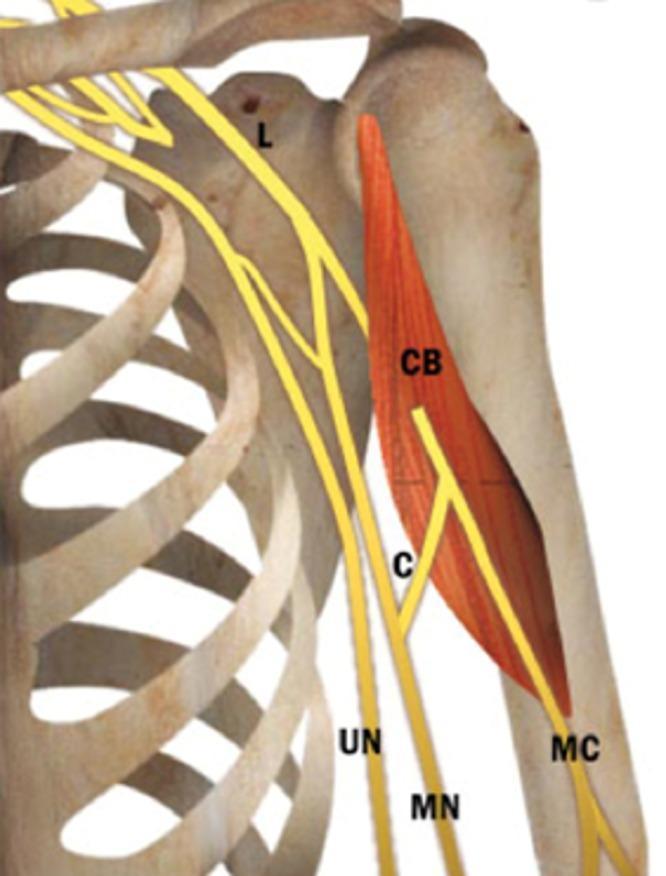
This anatomical diagram illustrates a common neuroanatomical variation of the brachial plexus in the upper limb, specifically the shoulder and proximal humerus region. The visual features the skeletal framework of the rib cage, clavicle, and humerus, with the coracobrachialis muscle (CB) highlighted in red. The neural structures are depicted in yellow, demonstrating the relationship between the musculocutaneous nerve (MC), median nerve (MN), and ulnar nerve (UN). A significant anatomical variant is shown: a communicating branch (C) originating from the musculocutaneous nerve distal to its exit from the coracobrachialis muscle. This branch travels medially and distally to join the median nerve. This illustration is an educational resource for medical students and clinicians to understand variations in peripheral nerve anatomy, which is critical for surgical planning in the axillary region and for interpreting unusual clinical presentations of peripheral nerve injuries.
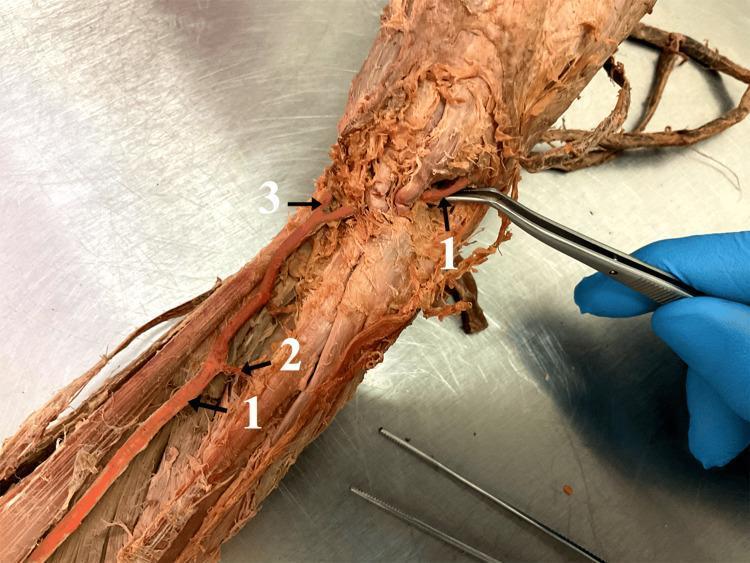
This clinical photograph displays a cadaveric dissection of a human right upper limb, focusing on an anatomical variation of the arterial supply in the forearm. The primary structure highlighted is a brachioradial artery (labeled '1'), which is shown being manipulated by surgical forceps at its proximal origin. The artery follows a superficial course along the anterior compartment of the forearm. During its descent, it gives off a small muscular branch (labeled '2'). Distally, near the wrist region, the vessel bifurcates into two distinct terminal branches (labeled '3'), which correspond to the ramus carpalis palmaris and the ramus palmaris superficialis. This image is an educational tool for gross anatomy and vascular surgery, illustrating a high-origin radial artery variation where the vessel arises from the brachial artery and descends superficially to the median nerve. Such variations are clinically significant for arterial cannulation, flap harvesting, and avoiding iatrogenic injury during orthopedic or plastic surgery procedures in the forearm and hand.
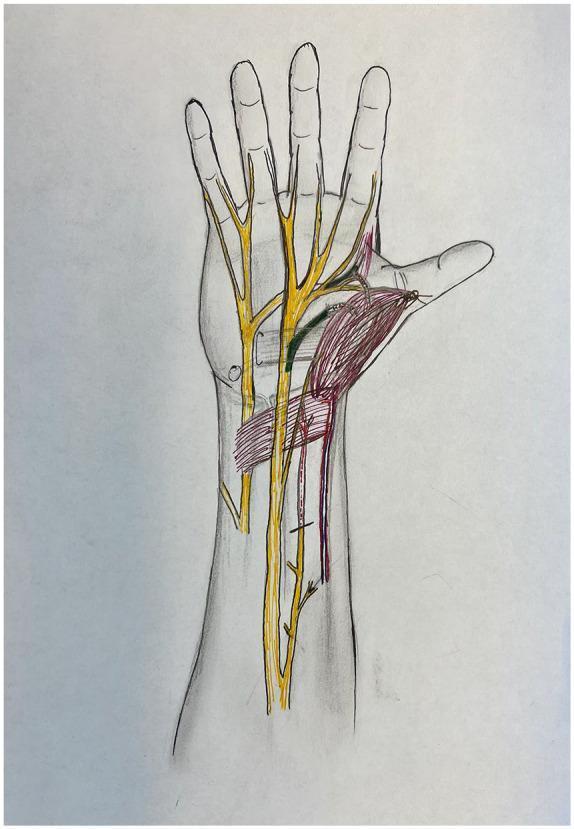
Anatomical diagram of the human hand and distal forearm in a palmar view, illustrating peripheral nerve anatomy and muscle transposition for pronator quadratus opponensplasty. The diagram features color-coded structures overlaid on a skeletal and soft tissue outline. Major peripheral nerves, including the median and ulnar nerves, are highlighted in yellow, showing their proximal courses and distal branching into digital nerves. The recipient anterior interosseous nerve (AIN) motor branch is highlighted in red, indicating its path toward the transposed muscle. The donor recurrent median nerve and donor deep ulnar nerve branches are highlighted in green, demonstrating potential donor sites for nerve coaptation to restore thenar function. The pronator quadratus muscle is shaded in red, shown in a transposed position toward the thumb (thenar eminence) to simulate its role as an opponens substitute. This illustration is designed for surgical planning in cases of chronic carpal tunnel syndrome or atrophic thenar muscle dysfunction, focusing on the spatial relationships required for effective nerve transfer and muscle mobilization.
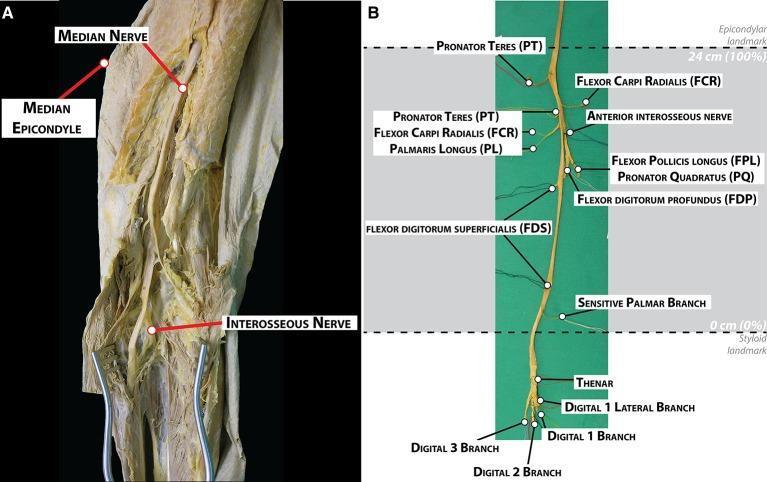
This educational image displays the gross anatomy and morphological branching pattern of the human median nerve through dissection. Image A is a clinical photograph showing the median nerve in situ within the medial aspect of the arm and elbow, with the median epicondyle and interosseous nerve labeled as landmarks. Image B presents the fully harvested median nerve against a green background, detailing its extensive branching hierarchy. Muscular branches are identified proximally to distally, including the pronator teres (PT), flexor carpi radialis (FCR), palmaris longus (PL), anterior interosseous nerve, flexor pollicis longus (FPL), pronator quadratus (PQ), flexor digitorum profundus (FDP), and flexor digitorum superficialis (FDS). Distal terminal branches are shown extending into the hand, including the sensitive palmar branch, thenar branches, and digital branches (1-3). The diagram includes a normalized distance scale, designating the epicondylar landmark at 24 cm (100%) and the styloid landmark at 0 cm (0%). This visual serves as a topographical guide for identifying nerve distribution during surgical procedures like electrode implantation or neurolysis.
The Median Nerve
Origin and Root Values
- Lateral cord contribution: C6, C7 (lateral root)
- Medial cord contribution: C8, T1 (medial root)
Course
In the Arm
- Proximally: lies lateral to the brachial artery
- Distally: crosses to the medial side of the brachial artery, lying anterior to the elbow joint
In the Forearm
- Enters the forearm by passing between the two heads of the pronator teres
- Then passes between the humero-ulnar and radial heads of flexor digitorum superficialis (FDS)
- Runs on the deep surface of FDS, in fascial planes
- Just proximal to the wrist it becomes more superficial, lying between the tendons of palmaris longus (medially) and flexor carpi radialis (laterally) - a key landmark
- Enters the palm by passing through the carpal tunnel, deep to the flexor retinaculum
At the Wrist and in the Hand
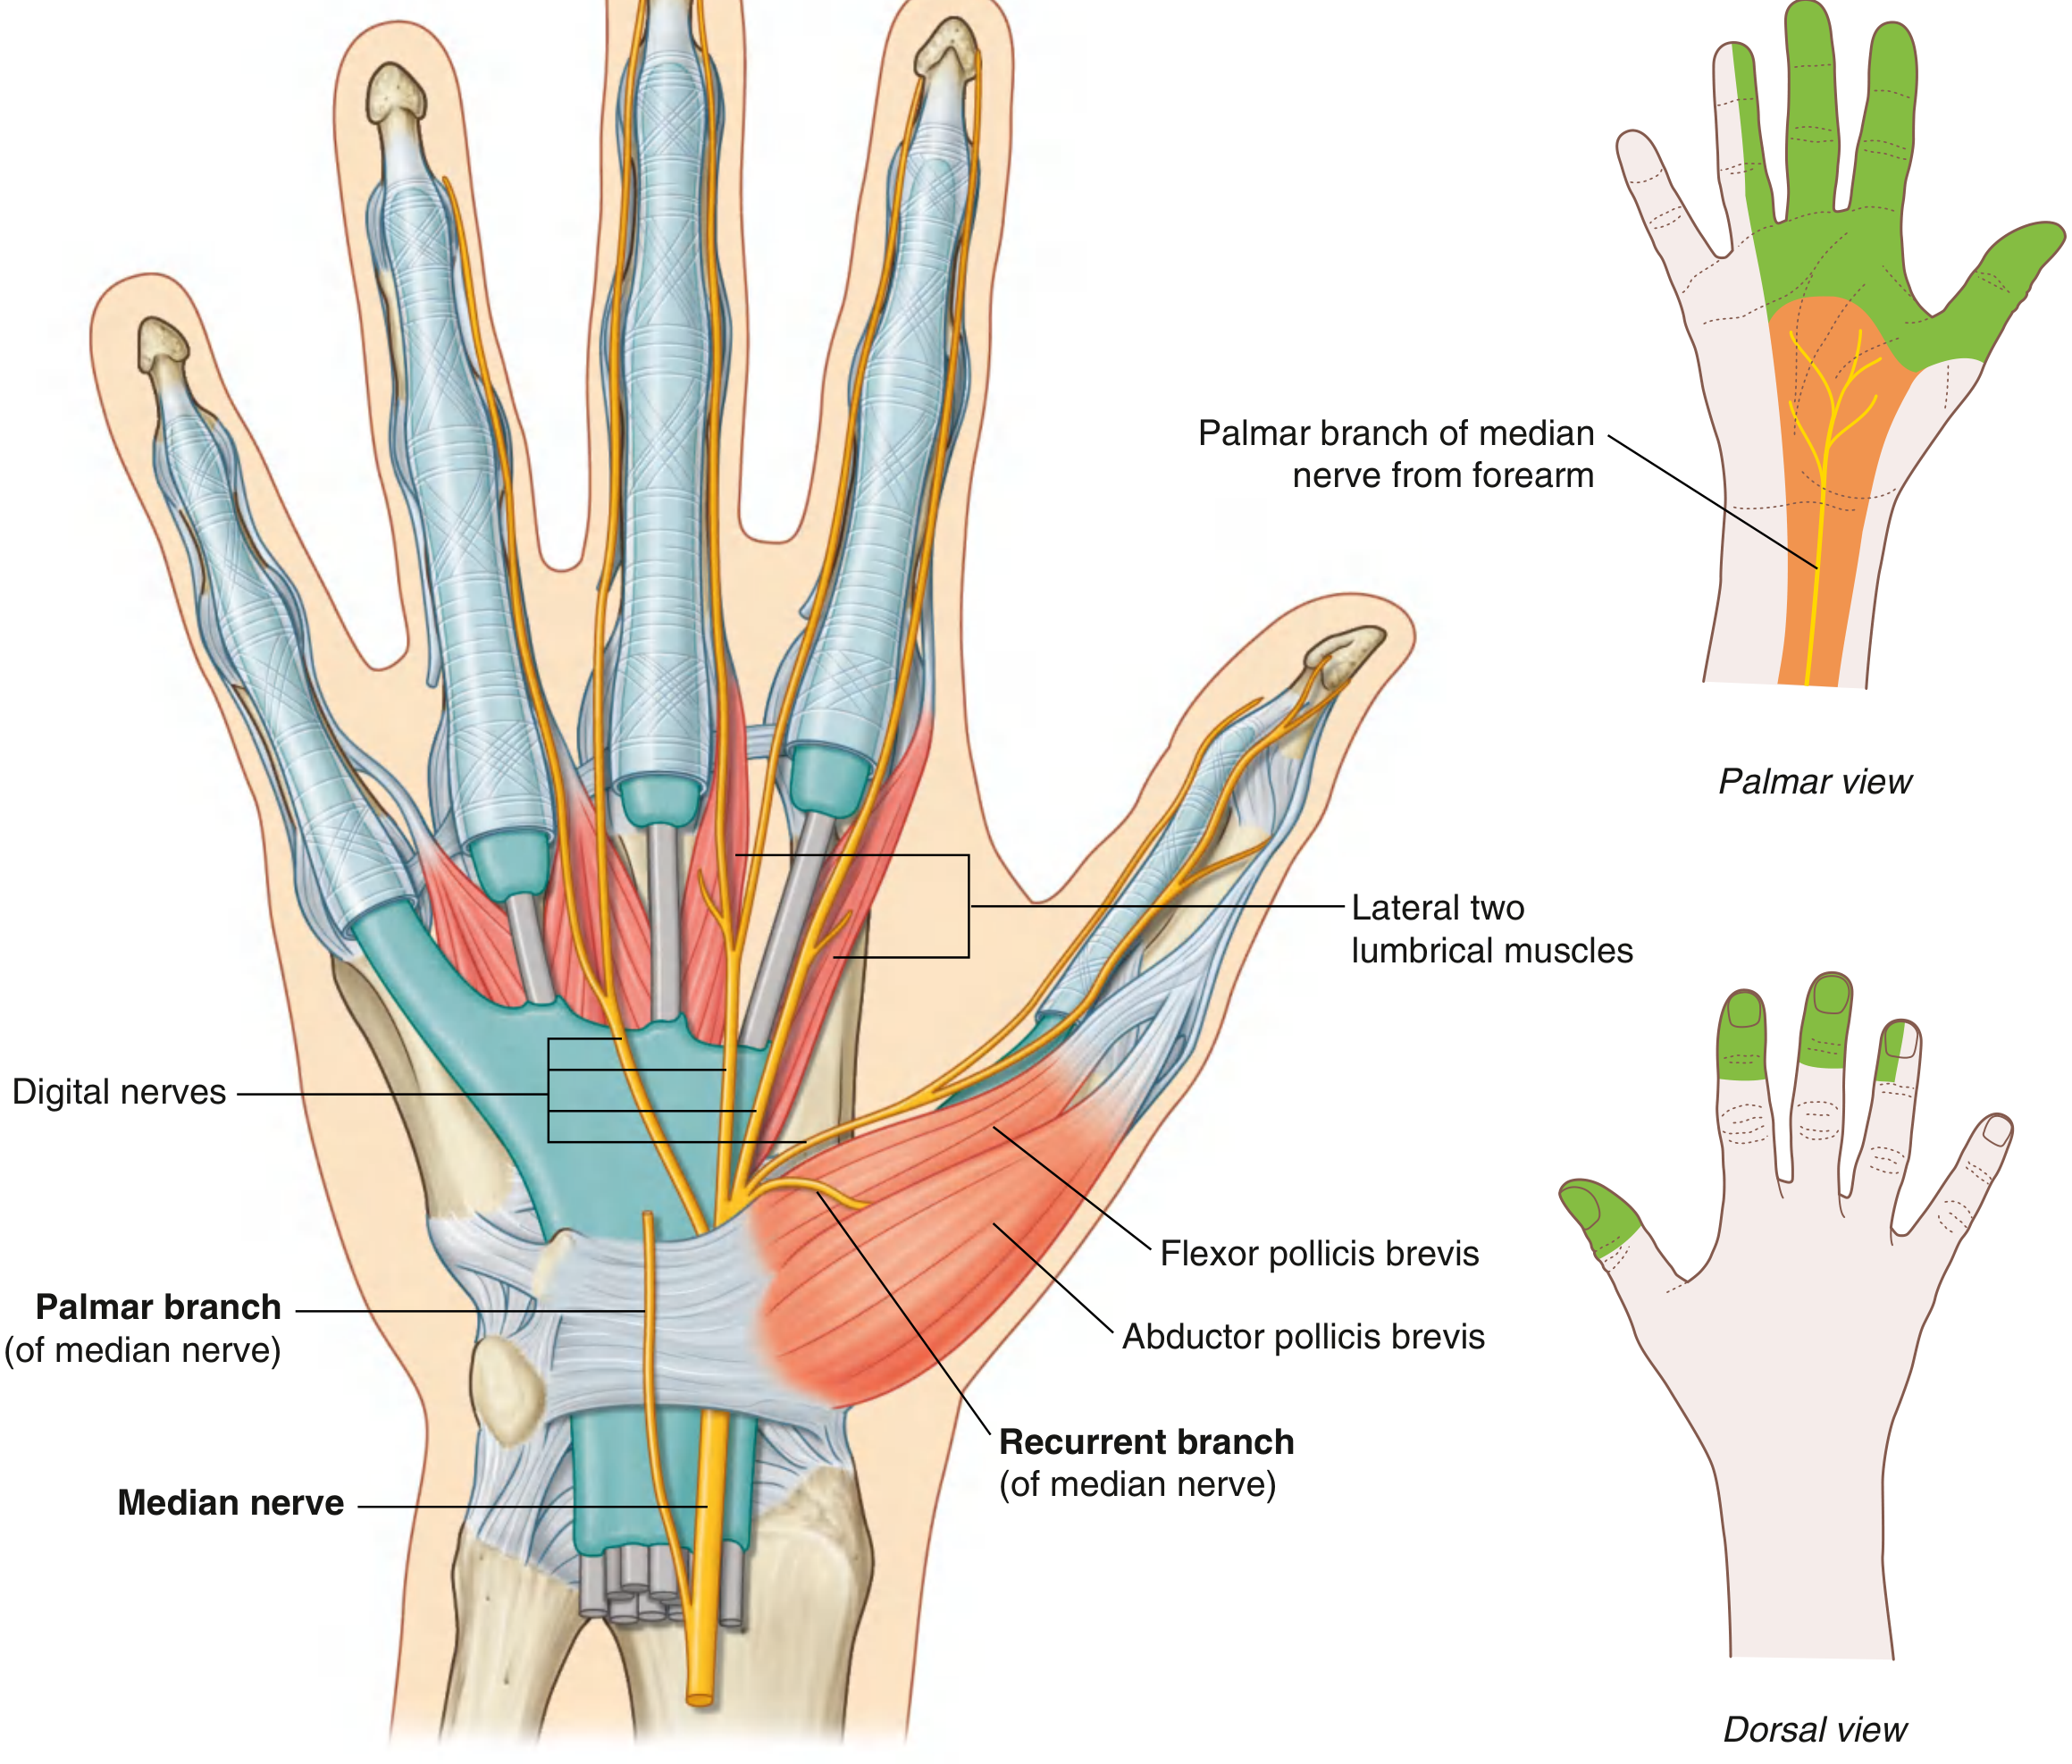
- Just proximal to the flexor retinaculum, gives off the palmar cutaneous branch (travels superficial to - not through - the carpal tunnel)
- After exiting the carpal tunnel, divides into the recurrent (thenar) branch and palmar digital branches
Branches and Muscular Supply
Forearm Muscles (mnemonic: FPTS + AIN)
| Muscle | Function |
|---|---|
| Pronator teres (PT) | Pronation |
| Flexor carpi radialis (FCR) | Wrist flexion + radial deviation |
| Palmaris longus (PL) | Weak wrist flexion |
| Flexor digitorum superficialis (FDS) | Flexion of middle phalanges (digits 2-5) |
- Arises between the two heads of pronator teres
- Travels with the anterior interosseous artery
- Supplies:
- Flexor pollicis longus (FPL)
- Lateral half of flexor digitorum profundus (FDP) - digits 2 and 3
- Pronator quadratus (PQ)
Note: Flexor carpi ulnaris (FCU) and the medial half of FDP (digits 4 and 5) are ulnar nerve territory.
Hand Muscles (mnemonic: LOAF)
- Lateral two lumbricals (1st and 2nd)
- Opponens pollicis
- Abductor pollicis brevis
- Flexor pollicis brevis (superficial head)
Sensory Distribution
- Palmar surface: lateral 3½ digits (thumb, index, middle, and lateral half of ring finger)
- Dorsal surface: nail beds and dorsal tips of the same lateral 3½ digits
- Palm: base and central palm via the palmar cutaneous branch (spared in carpal tunnel syndrome)
Injuries at Different Levels
1. High Lesion (at/above elbow) - "Median nerve palsy"
- Motor: Loss of wrist flexion (weak, deviates ulnar), loss of pronation (hand rests supinated), loss of finger flexion for digits 1-3, loss of thumb opposition/abduction
- The classical "Benediction hand": when asked to make a fist, digits 1, 2, and 3 cannot flex (ring and little flex normally via ulnar nerve), creating a characteristic posture
- Ape hand deformity: thenar wasting + inability to oppose thumb (long-standing)
- Sensory: loss over lateral 3½ digits and lateral palm
2. Anterior Interosseous Nerve (AIN) Syndrome
- Pure motor - no sensory loss
- Loss of FPL, lateral FDP (index), and pronator quadratus
- Patients cannot make the "OK sign" (tip-to-tip pinch between thumb and index finger; they form a flat pinch instead)
- Causes: trauma, forearm fractures, penetrating wounds, cast fixation
3. Low Lesion - Carpal Tunnel Syndrome (CTS)
- Nocturnal paresthesias (classic) - awakens patient from sleep
- Pain and tingling in the lateral 3½ digits
- Hypesthesia/numbness over lateral fingers
- Thenar wasting (late finding)
- Weakness of thumb opposition and abduction (abductor pollicis brevis is most sensitive test muscle)
- Phalen's test: sustained wrist flexion for 60 seconds reproduces symptoms
- Tinel's sign: percussion over carpal tunnel elicits tingling in median distribution
Key Clinical Points Summary
| Level of Injury | Motor Loss | Sensory Loss | Key Sign |
|---|---|---|---|
| High (arm/elbow) | All forearm flexors + thenar | Lateral 3½ digits + palm | Benediction hand, ape hand |
| AIN (forearm) | FPL, FDP (lateral), pronator quadratus | None | Cannot make "OK sign" |
| Wrist (CTS) | Thenar muscles only | Lateral 3½ digits (palm spared) | Nocturnal paresthesias, Phalen's/Tinel's |
- Gray's Anatomy for Students, pp. 876, 907, 939
- Bradley and Daroff's Neurology in Clinical Practice, p. 2635
Define Erythropoiesis Describe the stages of development of RBCs with neat diagrams. Discuss the factors influencing and regulating erythropoiesis (Role of Erythropoietin).
erythropoiesis stages RBC development bone marrow diagram
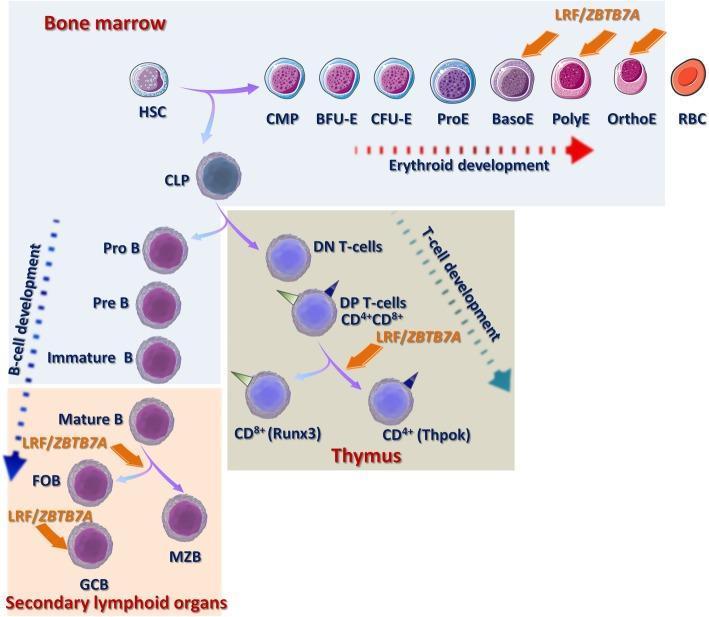
A pathophysiology diagram illustrating the role of the transcription factor LRF/ZBTB7A in human hematopoiesis, specifically in erythroid and lymphoid development. The diagram shows the differentiation of Hematopoietic Stem Cells (HSCs) into three main lineages. 1) Erythroid Development: Occurring in the bone marrow, the pathway progresses from CMP to BFU-E, CFU-E, and through erythroid precursors (ProE, BasoE, PolyE, OrthoE) to mature RBCs. LRF/ZBTB7A is shown regulating the terminal stages of erythropoiesis. 2) B-cell Development: Traces maturation from CLP through Pro-B, Pre-B, and Immature B cells in the bone marrow, continuing to Mature B cells in secondary lymphoid organs, where LRF/ZBTB7A facilitates differentiation into Follicular B cells (FOB) and Germinal Center B cells (GCB). 3) T-cell Development: Located in the thymus, it shows transitions from DN T-cells to DP T-cells (CD4+/CD8+). LRF/ZBTB7A is associated with the lineage choice between CD8+ (Runx3) and CD4+ (Thpok) T-cells. The visual emphasizes nuclear condensation and cytoplasm changes during erythroid maturation.
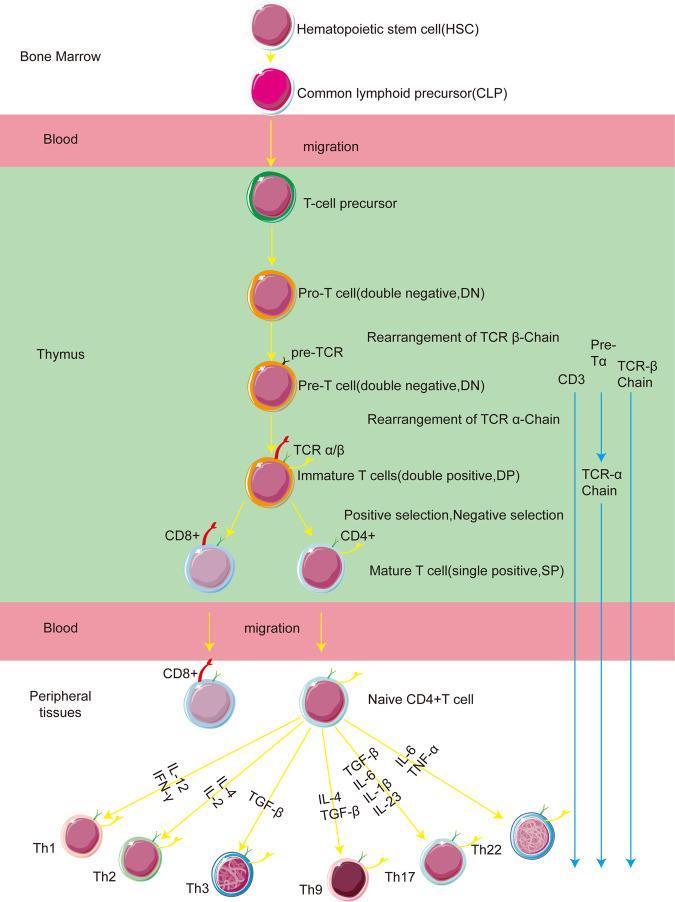
A pathophysiology diagram illustrating the stages of T-cell development and differentiation across anatomical compartments. The flow begins in the Bone Marrow with Hematopoietic Stem Cells (HSC) and Common Lymphoid Precursors (CLP), which migrate through the Blood to the Thymus. Within the thymus, the diagram details successive developmental stages: T-cell precursor, Pro-T cell (Double Negative, DN), Pre-T cell (DN), and Immature T cells (Double Positive, DP). Key molecular events are labeled, including TCR β-chain and α-chain rearrangements, pre-TCR formation, and positive/negative selection. The cells transition from DP to Mature T cells (Single Positive, SP), categorized as either CD8+ or CD4+. Following a second migration through the Blood to Peripheral Tissues, the Naive CD4+ T cell undergoes terminal differentiation. The diagram maps the cytokine-driven pathways (including IL-12, IFN-γ, IL-4, TGF-β, IL-6, IL-1β, IL-23, and TNF-α) that lead to specific T-helper (Th) cell subsets: Th1, Th2, Th3, Th9, Th17, and Th22. The visual uses color-coded spheres to represent maturing cells and directional arrows to denote cellular migration and lineage progression.
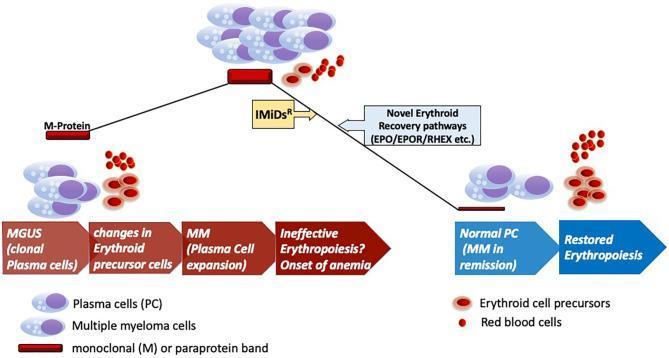
A pathophysiology diagram illustrating the disease progression of monoclonal gammopathy of undetermined significance (MGUS) to multiple myeloma (MM) and the subsequent impact on erythropoiesis. The visual follows a peak-like trajectory: the left side shows the progression from MGUS (clonal plasma cells) to MM (plasma cell expansion), characterized by a thickening M-protein band and increasingly ineffective erythropoiesis leading to anemia. At the peak, malignant multiple myeloma cells dominate the bone marrow environment alongside sparse red blood cells and erythroid precursors. The downward right slope depicts therapeutic intervention using immunomodulatory drugs (IMiDsR) and the engagement of novel erythroid recovery pathways involving EPO, EPOR, and RHEX. This phase represents MM in remission (Normal PC) and the clinical restoration of erythropoiesis, visualized by the return of mature red blood cells and normal erythroid precursor levels. Key components include plasma cells, monoclonal (M) paraprotein bands, and the sequential maturation stages of the erythroid lineage.
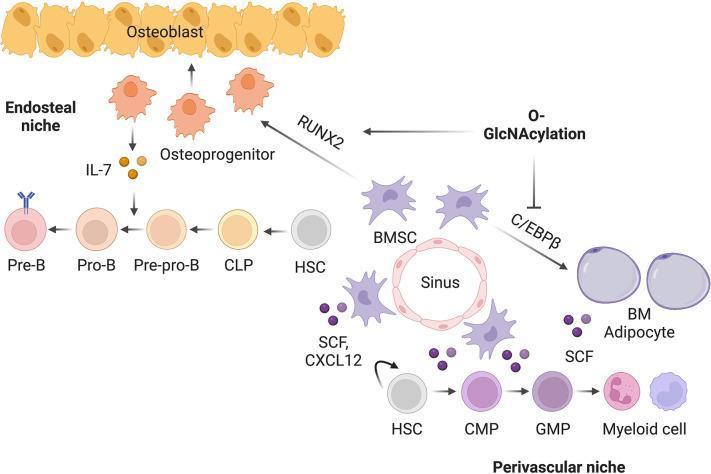
A medical pathophysiology diagram illustrating the 'Working model of O-GlcNAc signaling in bone-BM development.' The visual compares two distinct bone marrow (BM) microenvironments: the endosteal niche and the perivascular niche. In the endosteal niche, O-GlcNAcylation promotes RUNX2 activity, facilitating the differentiation of osteoprogenitors into osteoblasts. These osteoprogenitors release IL-7, which drives B-cell lymphopoiesis from Hematopoietic Stem Cells (HSC) through CLP, Pre-pro-B, Pro-B, and Pre-B stages. In the perivascular niche, Bone Marrow Stem Cells (BMSCs) surround a sinus. O-GlcNAcylation acts to inhibit C/EBPβ; when this inhibition is absent, BMSCs differentiate into BM Adipocytes. These adipocytes and perivascular BMSCs produce SCF and CXCL12, signaling molecules that promote myeloid lineage differentiation from HSCs through CMP and GMP to mature Myeloid cells. The diagram highlights the reciprocal regulation of RUNX2 (osteogenic/lymphopoietic) and C/EBPβ (adipogenic/myelopoietic) pathways by protein O-GlcNAcylation, essential for balancing skeletal and hematopoietic system development.
erythroblast stages proerythroblast basophilic polychromatophilic orthochromatic reticulocyte bone marrow smear
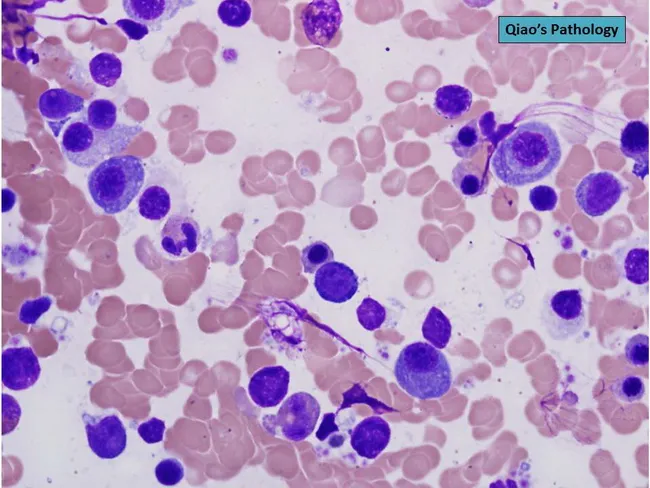
Brightfield light microscopy of a Wright-Giemsa stained bone marrow aspirate smear at 100x oil immersion reveals a quantitative increase in plasma cells with intermediate maturation (between mature and immature) among a heterogeneous hematopoietic background of erythroid and myeloid precursors. The plasma cells are characterized by relatively abundant basophilic cytoplasm containing granular inclusions and by moderately dispersed chromatin in their nuclei. Some cells appear with eccentric nuclei and prominent cytoplasmic features typical of plasma cells, while others show more condensed nuclear chromatin suggesting an intermediate maturation stage. The smear lacks a delicate histologic architecture but demonstrates a clonal-appearing proliferation pattern in aspirate cytology; background hematopoiesis includes mature and immature forms. Overall, these features point toward plasmacytosis and warrant differentiation between reactive plasmacytosis and neoplastic plasma cell disorders. Clinically, increased plasma cells in bone marrow can reflect plasma cell dyscrasias such as multiple myeloma, MGUS, or plasmacytoma, or reactive processes secondary to infection or autoimmune disease. Diagnostic significance hinges on ancillary testing: flow cytometry for clonality, immunoglobulin profiling (serum protein electrophoresis and immunofixation), serum free light chains, and bone marrow cytogenetics. This image is valuable for education, differential diagnosis, and correlating morphological features with clinical investigations in hematology and pathology for diagnostics.
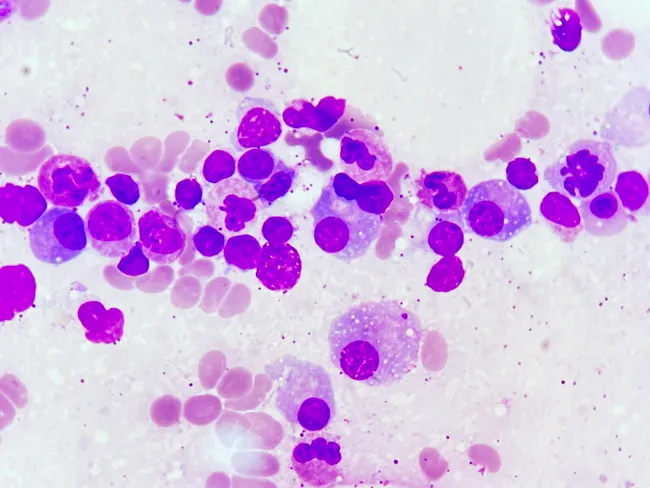
Imaging modality: Light microscopy of a Wright-Giemsa stained bone marrow aspirate smear. Specimen demonstrates cellular marrow with admixture of small mature lymphocytes and plasmacytoid cells, with scattered plasma cells showing eccentrically placed nuclei and basophilic cytoplasm. The predominant population consists of lymphoid-appearing cells with condensed chromatin and scant cytoplasm, forms consistent with lymphoplasmacytic differentiation. In addition, plasmacytoid lymphocytes and occasional true plasma cells are present, sometimes with a perinuclear hof. Background consists of erythroid and myeloid precursors in variable density, with minor rouleaux and mild dilution effects typical of aspirate smears. The findings align with lymphoplasmacytic lymphoma/Waldenström macroglobulinemia involving the medullary compartment. Notable features include a spectrum from small lymphocytes to plasmacytoid cells with plasma cells, reflecting clonal B-cell expansion and plasmacytic differentiation. Diagnostic significance includes marrow involvement by LPL with IgM-secreting clone; when combined with serum IgM monoclonal gammopathy, surface markers, and genetic studies, supports WM diagnosis. Potential differential diagnoses include chronic lymphoproliferative disorders with marrow plasmacytosis and plasma cell neoplasms; reactive plasmacytosis is less likely but considered in context. Clinical use cases include staging, treatment monitoring, and ambient research into marrow involvement by lymphoplasmacytic neoplasms. Correlation with IgM level and imaging aids comprehensive diagnosis and management for WM.
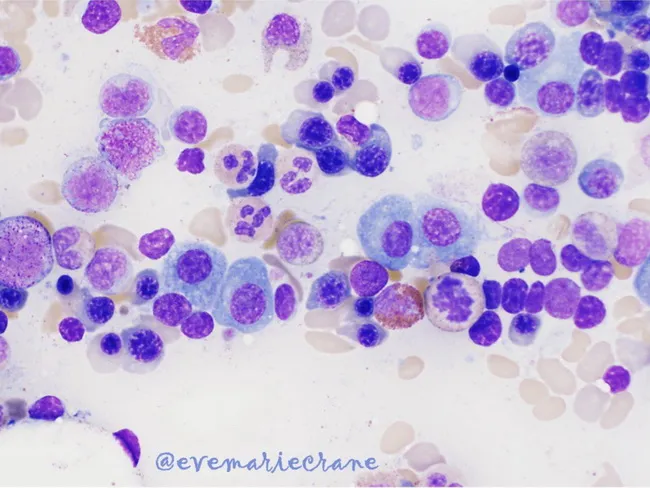
Bone marrow aspirate smear and trephine biopsy image illustrating plasma cell myeloma morphology. Imaged by bright-field light microscopy of Wright-Giemsa stained material, typically examined at oil immersion magnification (about 1000x). The primary subject is malignant plasma cells within the hematopoietic marrow; the specimen type is bone marrow aspirate smear, often with an accompanying trephine biopsy for architectural assessment. In the center of the field, several immature plasma cells are evident, characterized by larger size relative to surrounding hematopoietic elements, vesicular chromatin that is less condensed, and one or more prominent nucleoli. The cytoplasm is basophilic and abundant, frequently containing vacuoles, granules, crystals, or inclusions. Background marrow shows a spectrum of mature myeloid and erythroid cells; the overall cellularity is variable. Morphology ranges from mature, normal-appearing plasma cells to plasmablast-like cells with dispersed chromatin. In 1–2% of cases, neoplastic cells may exhibit multinucleation or convoluted nuclei with lymphoid-like morphology. The aspirate frequently demonstrates plasma cell percentages in the 20–35% range, while sampling error or uneven distribution may yield <10% in some symptomatic patients. Together with immunophenotyping, cytogenetics, and molecular studies, these features inform diagnosis, prognosis, and therapy response in plasma cell myeloma.
Erythropoiesis
Definition
Sites of Erythropoiesis
| Age/Stage | Primary Sites |
|---|---|
| Embryo (yolk sac, 0-2 months) | Yolk sac (primitive/megaloblastic erythropoiesis) |
| Fetus (2-7 months) | Liver and spleen (hepatosplenic phase) |
| Fetus (5 months onward) | Red bone marrow takes over |
| Adult | Red bone marrow of flat bones (sternum, ribs, vertebrae, pelvis, proximal femur/humerus) |
In severe chronic anemia, extramedullary erythropoiesis may resume in the liver and spleen.
Stages of Development of RBCs
Progenitor (Non-Morphological) Stage
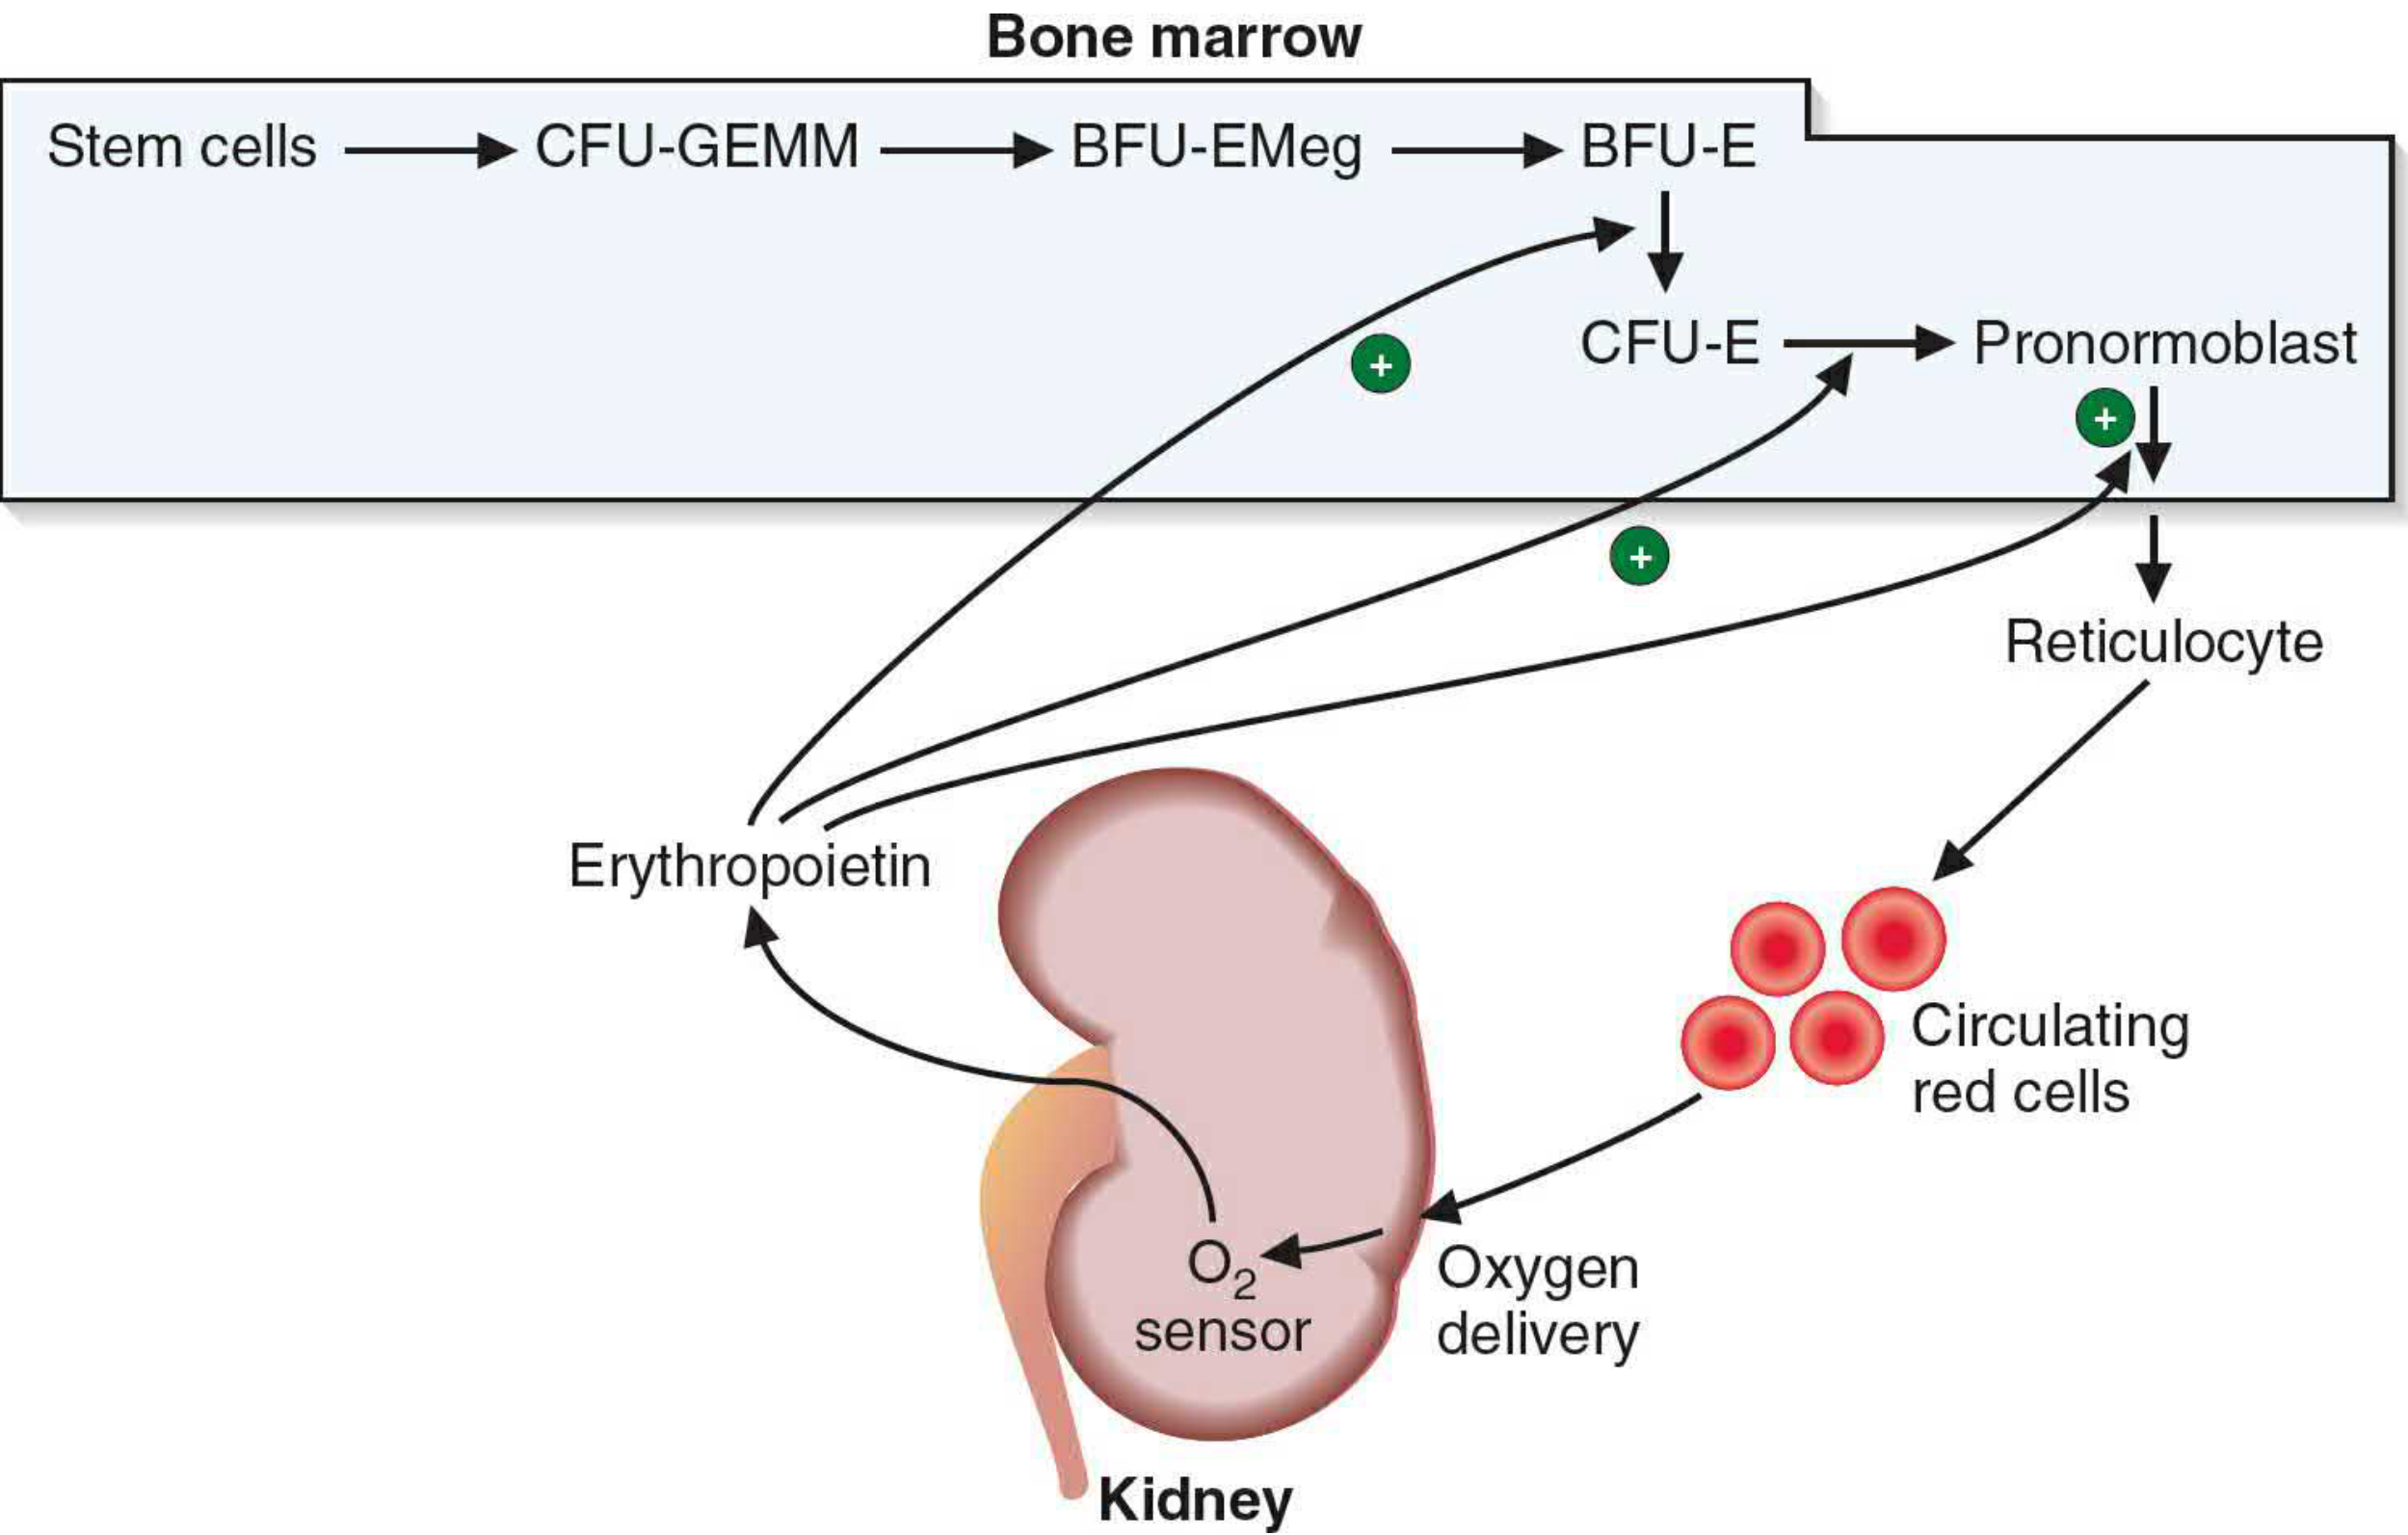
HSC → CFU-GEMM → BFU-EMeg → BFU-E → CFU-E → Proerythroblast
- HSC (Hematopoietic Stem Cell): Pluripotent, self-renewing
- CFU-GEMM (Colony-Forming Unit - Granulocyte, Erythroid, Monocyte, Megakaryocyte): Mixed myeloid progenitor
- BFU-E (Burst-Forming Unit - Erythroid): Early erythroid-committed, EPO-responsive
- CFU-E (Colony-Forming Unit - Erythroid): Highly EPO-sensitive; commits fully to erythroid lineage
Morphological (Recognizable) Stages
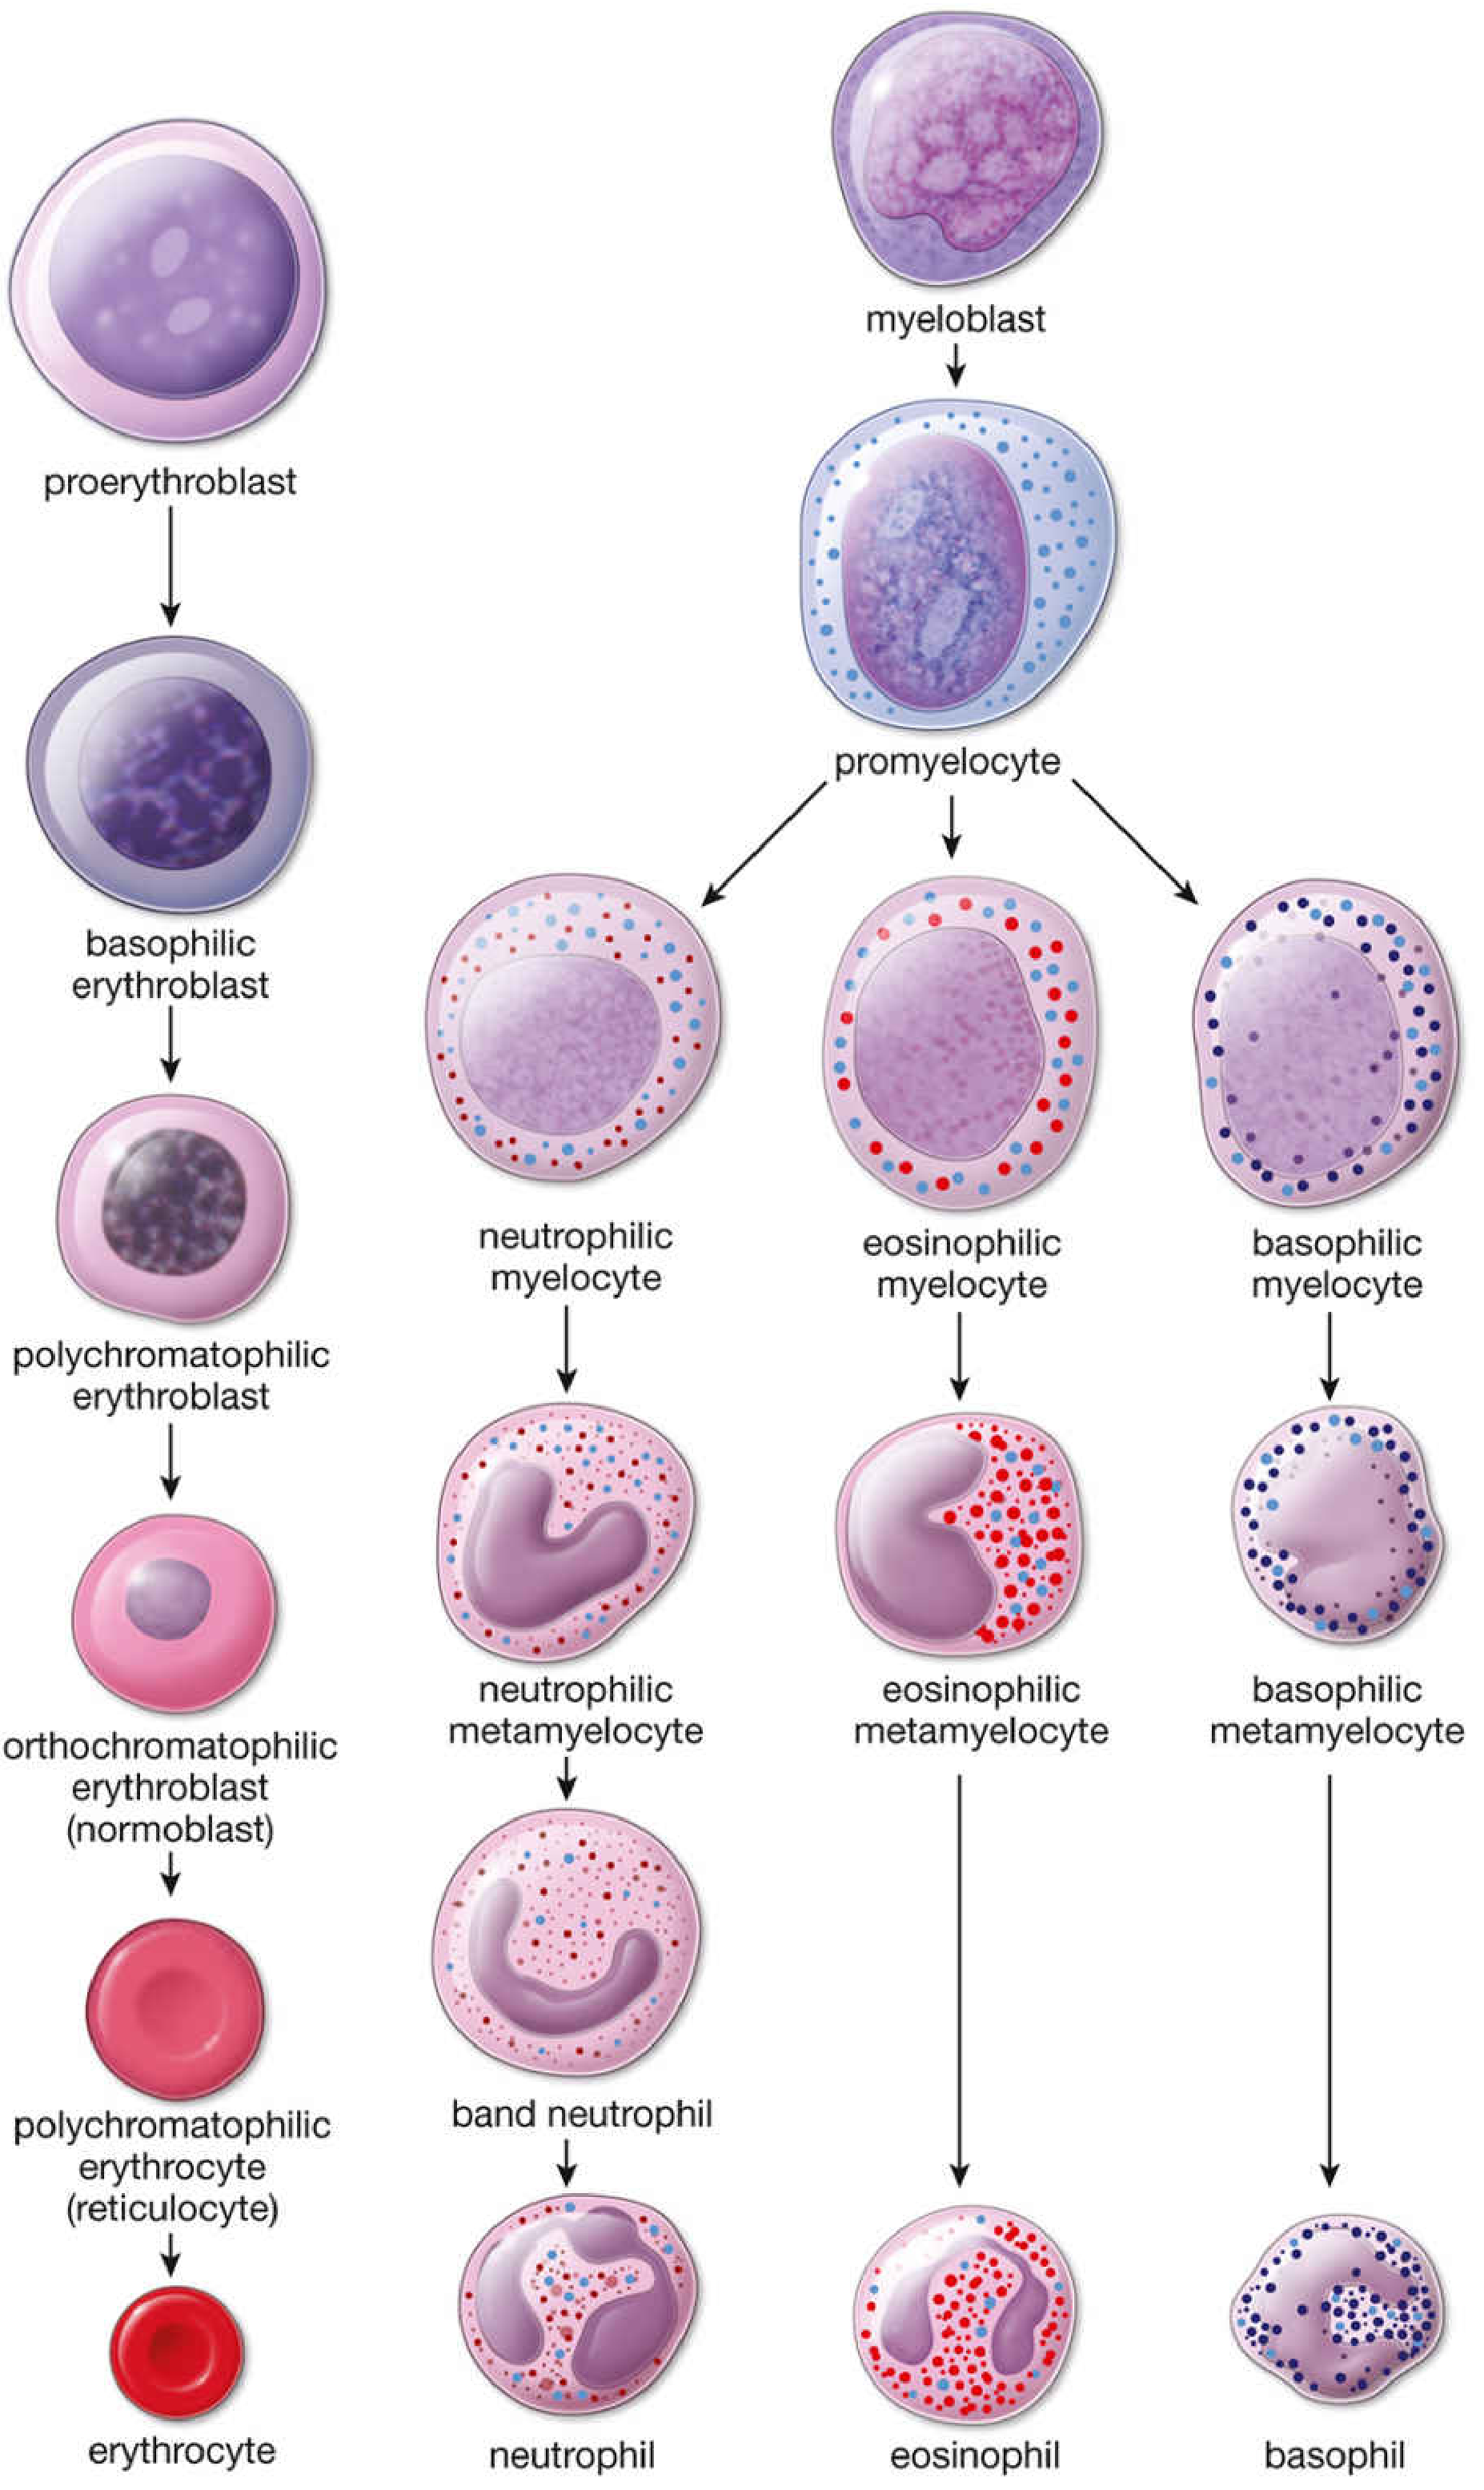
Stage 1: Proerythroblast (Pronormoblast)
| Feature | Description |
|---|---|
| Size | Large: 12-20 µm |
| Nucleus | Large, spherical, 1-2 prominent nucleoli, fine chromatin |
| Cytoplasm | Mildly basophilic (free ribosomes beginning Hgb synthesis) |
| Mitosis | Capable |
| Duration | ~24 hours |
| Key event | Hgb production components begin to accumulate |
Stage 2: Basophilic Erythroblast (Early Normoblast)
| Feature | Description |
|---|---|
| Size | Smaller: 10-16 µm |
| Nucleus | Smaller, progressively heterochromatic (condensing) |
| Cytoplasm | Strongly basophilic - dense polyribosomes actively synthesizing Hgb |
| Mitosis | Capable (multiple divisions occur) |
| Duration | ~24 hours |
| Key event | Active Hgb synthesis begins; ribosome accumulation peaks |
Stage 3: Polychromatophilic Erythroblast (Intermediate Normoblast)
| Feature | Description |
|---|---|
| Size | Smaller than basophilic erythroblast |
| Nucleus | Smaller, coarse heterochromatin in "checkerboard" pattern |
| Cytoplasm | Mixed staining - both basophilic (ribosomes) and acidophilic (Hgb); gray/lilac or distinct pink + purple regions |
| Mitosis | Last stage capable of mitosis |
| Duration | ~30 hours |
| Key event | Transition from RNA-dominant to Hgb-dominant cytoplasm |
Stage 4: Orthochromatophilic Erythroblast (Late Normoblast)
| Feature | Description |
|---|---|
| Size | Slightly larger than mature RBC |
| Nucleus | Small, dense, pyknotic (deeply stained, condensed) |
| Cytoplasm | Fully eosinophilic (high Hgb content) |
| Mitosis | No longer capable of division |
| Duration | ~48 hours |
| Key event | Nuclear extrusion - nucleus is ejected from the cell. Residual nuclear fragments = Howell-Jolly bodies |
Stage 5: Reticulocyte (Polychromatophilic Erythrocyte)
| Feature | Description |
|---|---|
| Size | Slightly larger than mature RBC |
| Nucleus | Absent (expelled) |
| Cytoplasm | Eosinophilic with slight basophilia (residual polyribosomes visible as a reticulum with supravital stain, e.g., brilliant cresyl blue) |
| Location | Released from bone marrow into circulation |
| Duration in blood | 1-2 days (matures in spleen where ribosomes and mRNA are lost) |
| Key event | Still capable of Hgb synthesis; normal reticulocyte count: ~0.5-2% of RBCs |
Stage 6: Mature Erythrocyte
| Feature | Description |
|---|---|
| Size | 6-8 µm (biconcave disc) |
| Nucleus | Absent |
| Cytoplasm | Uniformly eosinophilic (packed with Hgb ~33 g/dL) |
| Organelles | None (no mitochondria, ribosomes, or nucleus) |
| Lifespan | ~120 days |
| Removal | Senescent RBCs phagocytosed by macrophages of spleen, bone marrow, and liver |
Timeline of RNA vs. Hemoglobin During Maturation
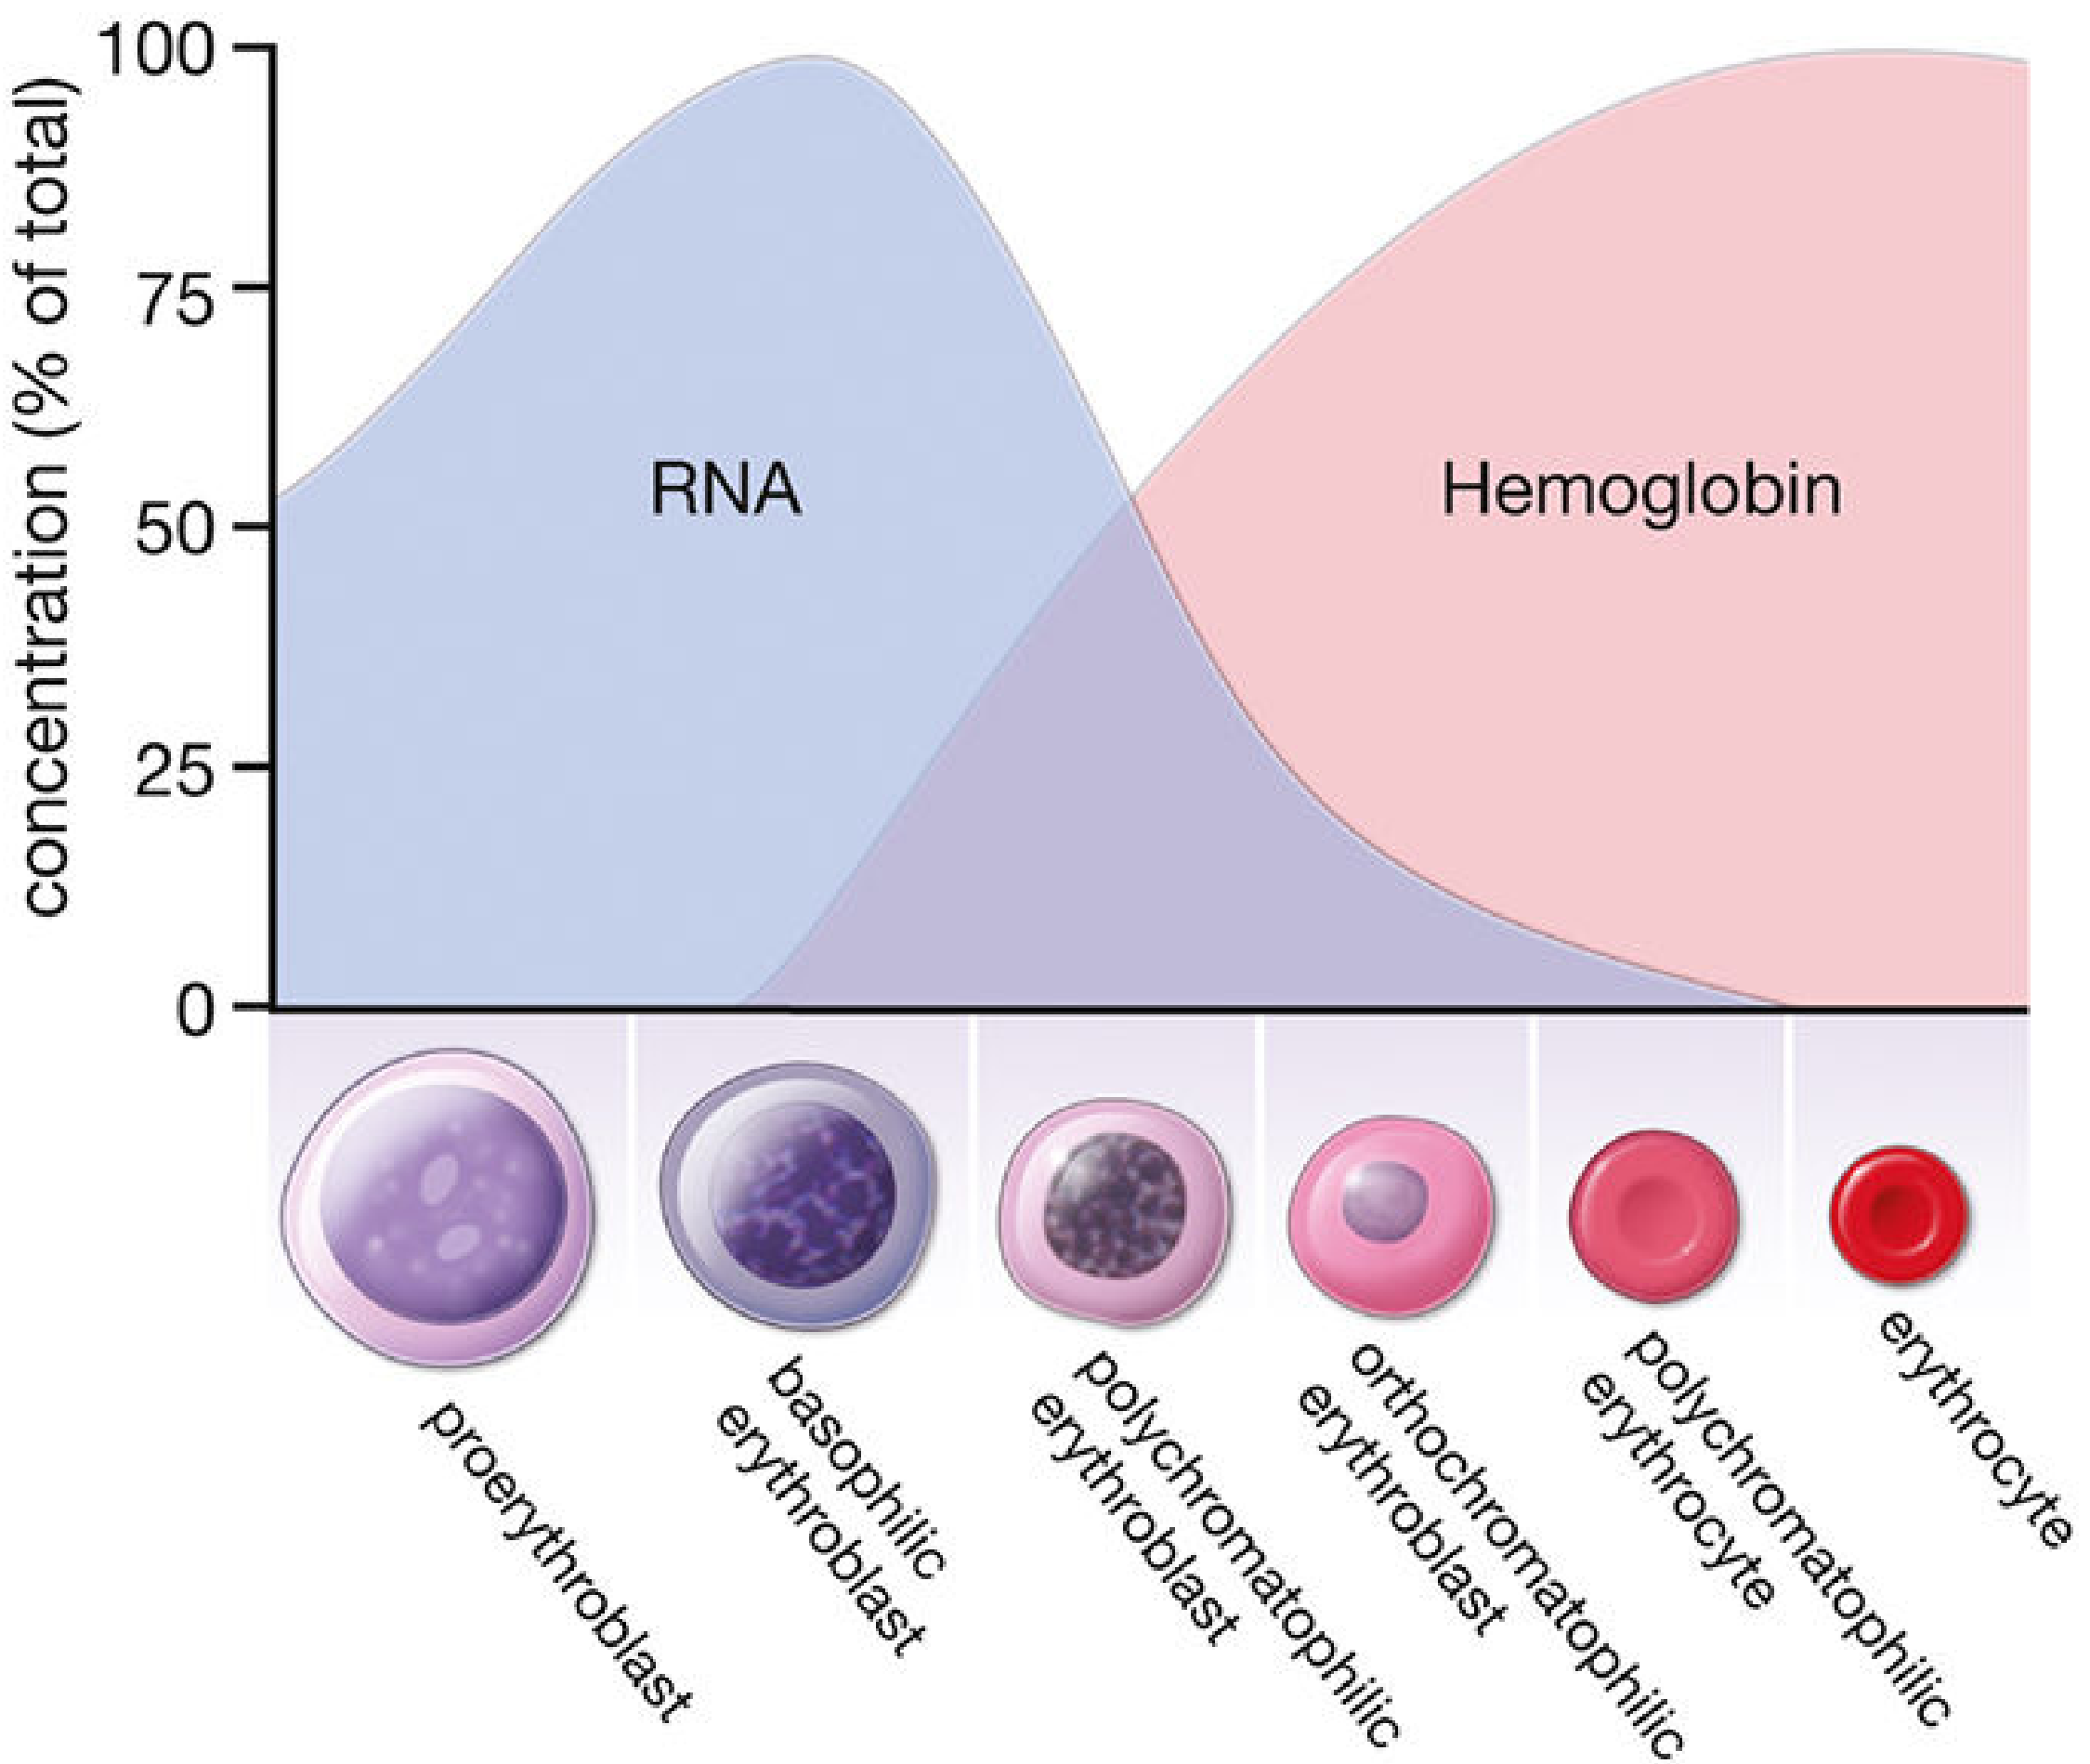
Factors Influencing and Regulating Erythropoiesis
A. Erythropoietin (EPO) - The Primary Regulator
Structure
- A 34 kDa glycoprotein (165 amino acids with 4 oligosaccharide chains)
- Contains a single transmembrane domain receptor belonging to the cytokine receptor superfamily
- Half-life in circulation: ~5 hours
- Response delay: Increase in circulating RBCs takes 2-3 days (maturation is slow)
Source
- 85% produced by kidneys - specifically by peritubular interstitial fibroblasts in the renal cortex
- 15% produced by the liver - perivenous hepatocytes
- Also produced in small amounts by brain, uterus, and oviducts
- In chronic kidney disease/nephrectomy - the liver cannot compensate, leading to anemia of chronic renal failure
Mechanism of Action (HIF-1α Pathway)
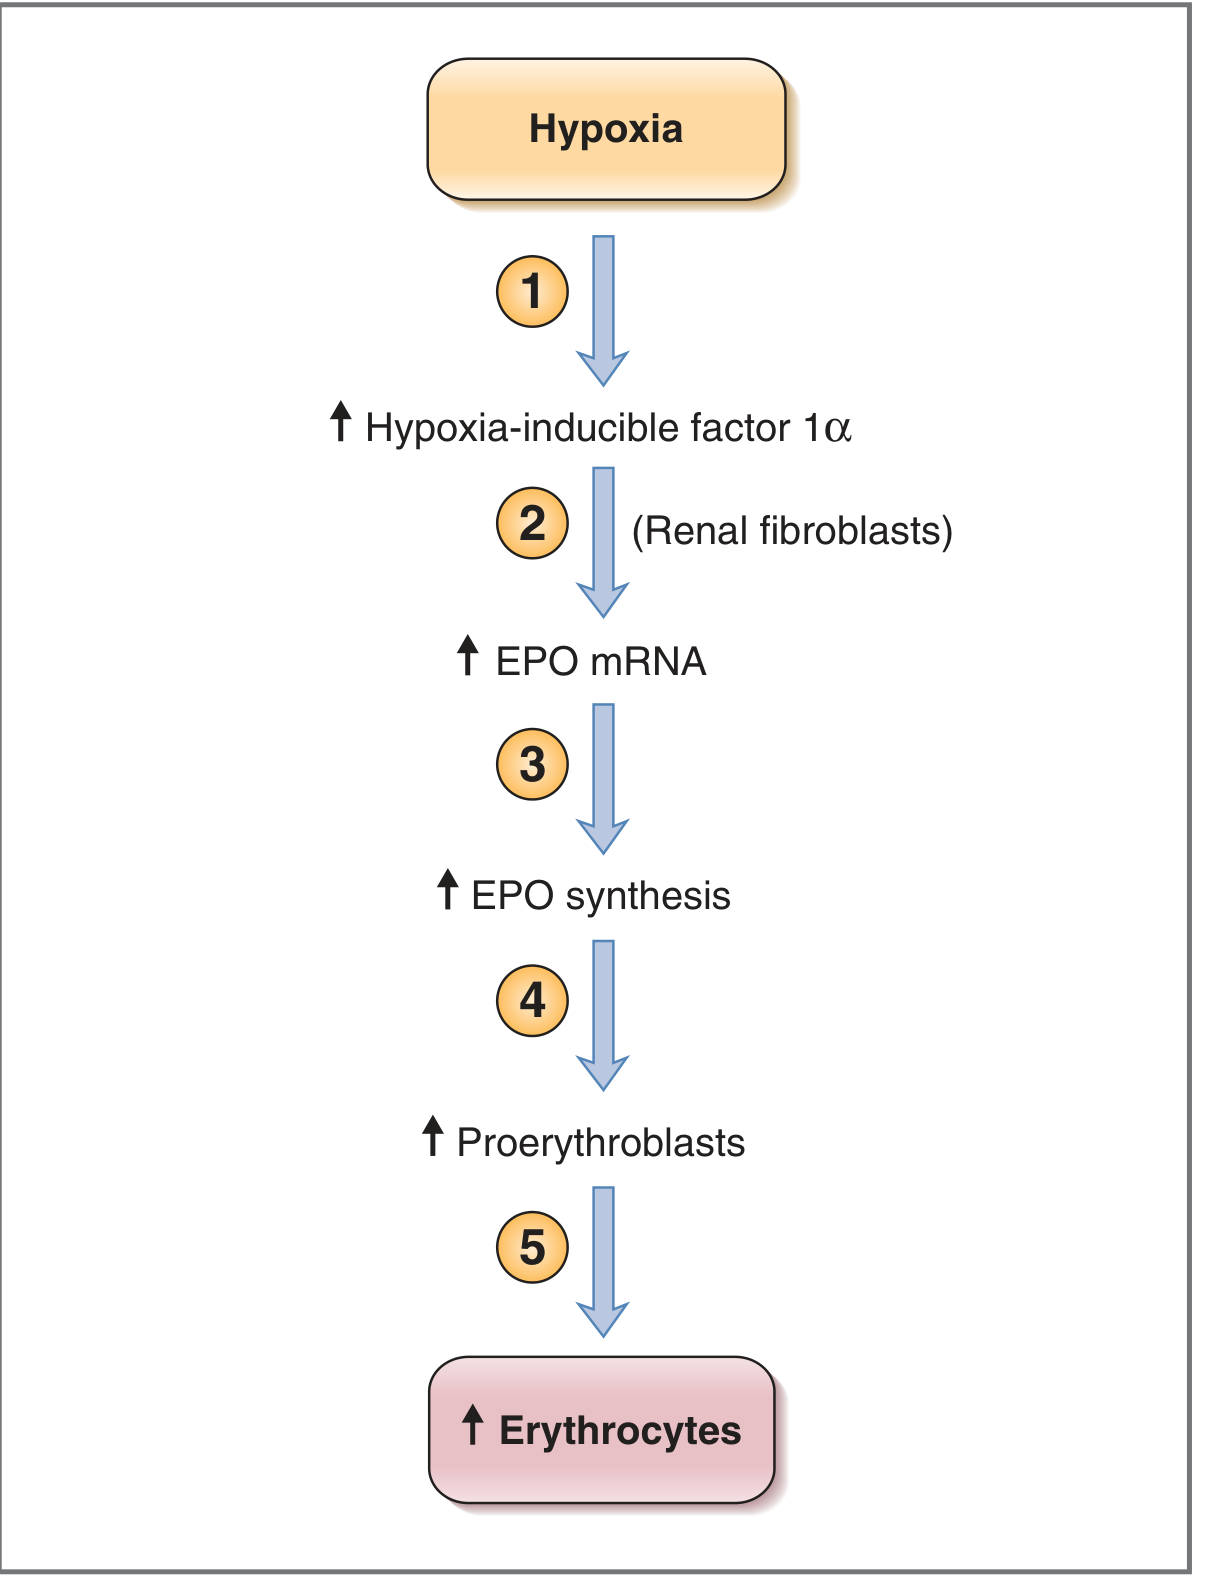
- Trigger - Hypoxia: Decreased O₂ delivery to kidneys (from ↓Hgb, ↓PaO₂, or blood loss)
- HIF-1α stabilization: Under normoxia, HIF-1α is hydroxylated by prolyl hydroxylases (PHDs) and degraded by the ubiquitin-proteasome system. Under hypoxia, PHDs are inactive → HIF-1α accumulates
- Transcription: Stabilized HIF-1α acts on renal peritubular fibroblasts → EPO mRNA synthesis
- EPO secretion: EPO is released into the circulation
- Bone marrow effect: EPO binds to receptors on CFU-E and proerythroblasts → activates JAK2/STAT5 signaling → promotes proliferation and differentiation → inhibits apoptosis of red cell precursors
- Result: Increased production of erythrocytes → restored O₂ delivery → feedback inhibition of EPO secretion
The kidneys are ideally positioned as the sensor because they distinguish between true hypoxemia (low O₂ content) and reduced blood flow. When blood flow decreases, GFR and Na⁺ reabsorption fall together, so O₂ consumption also falls and renal O₂ balance is maintained. Conversely, when O₂ content of blood truly falls, the kidney detects it and appropriately triggers EPO release.
Additional Stimuli for EPO Secretion
- Androgens (testosterone) - stimulate EPO; explains higher Hgb in males
- Cobalt salts - mimic hypoxia (used historically)
- High altitude/alkalosis - EPO rises within 24-48 hours of altitude exposure
- β-adrenergic catecholamines - facilitate EPO secretion
B. Nutritional Factors
| Nutrient | Role | Deficiency |
|---|---|---|
| Iron | Required for heme synthesis (Fe²⁺ + protoporphyrin → heme) | Microcytic hypochromic anemia |
| Vitamin B₁₂ (cobalamin) | Required for DNA synthesis (thymidine synthesis via folate cycle); also for myelin | Megaloblastic anemia (macrocytic) + neurological signs |
| Folic acid | Required for DNA synthesis (one-carbon metabolism) | Megaloblastic anemia (macrocytic), no neurological signs |
| Vitamin B₆ | Cofactor for ALA synthase (first step of heme synthesis) | Sideroblastic anemia |
| Copper | Required for iron absorption and mobilization | Impaired erythropoiesis |
| Vitamin C | Enhances iron absorption (reduces Fe³⁺ → Fe²⁺) | Impaired iron utilization |
C. Hormonal Influences
| Hormone | Effect |
|---|---|
| Erythropoietin | Primary stimulator (see above) |
| Androgens (testosterone) | Stimulate EPO production; increase sensitivity of marrow to EPO; directly stimulate erythroid progenitors |
| Thyroid hormones | Increase basal metabolic rate → increased O₂ demand → increased EPO; hypothyroidism causes mild normocytic anemia |
| Growth hormone / IGF-1 | Stimulate erythroid colony formation |
| Cortisol | Mild stimulatory effect |
| Estrogen | Mild inhibitory effect (explains lower Hgb in females vs males) |
D. Cytokines and Growth Factors
| Factor | Role |
|---|---|
| IL-3 | Stimulates proliferation of early erythroid progenitors |
| IL-4 | Promotes erythroid differentiation from MEP cells |
| Stem Cell Factor (SCF) | Acts on BFU-E; early erythroid expansion |
| GM-CSF | Stimulates early progenitor proliferation |
| GATA-1 (transcription factor) | Required for terminal erythroid differentiation from MEP cells |
E. Negative Regulators
- Transforming Growth Factor-β (TGF-β): Inhibits erythropoiesis
- Hepcidin: Antimicrobial peptide from liver; inhibits ferroportin → reduces iron release from stores → limits RBC production in chronic inflammation (anemia of chronic disease)
- Inflammatory cytokines (IL-1, TNF-α, IFN-γ): Suppress erythropoiesis → anemia of chronic disease
F. Other Factors
- Adequate bone marrow: Marrow failure (aplastic anemia, infiltration by tumor/fibrosis) severely impairs erythropoiesis
- Oxygen tension: The master regulator - acts via HIF-1α/EPO axis
- Normal feedback loop: ↑RBC mass → ↑O₂ delivery → ↓HIF-1α → ↓EPO → ↓erythropoiesis (negative feedback)
Clinical Applications of EPO
| Application | Detail |
|---|---|
| Anemia of chronic renal failure | EPO deficiency due to loss of renal mass; treated with recombinant EPO (epoetin alfa) |
| High altitude acclimatization | EPO rises within 24-48 h; polycythemia develops |
| EPO doping in athletes | Banned; can cause fatal polycythemia/thromboembolism |
| Autologous blood banking | EPO used pre-surgery to stimulate own RBC production |
- Basic Medical Biochemistry: A Clinical Approach, 6e, p. 1536
- Histology: A Text and Atlas with Correlated Cell and Molecular Biology, pp. 738-743
- Costanzo Physiology, 7th Edition, pp. 228-229
- Ganong's Review of Medical Physiology, 26th Edition, pp. 706-708
- Brenner and Rector's The Kidney, p. 3282