
formation of hemoglobin
hemoglobin synthesis heme formation diagram
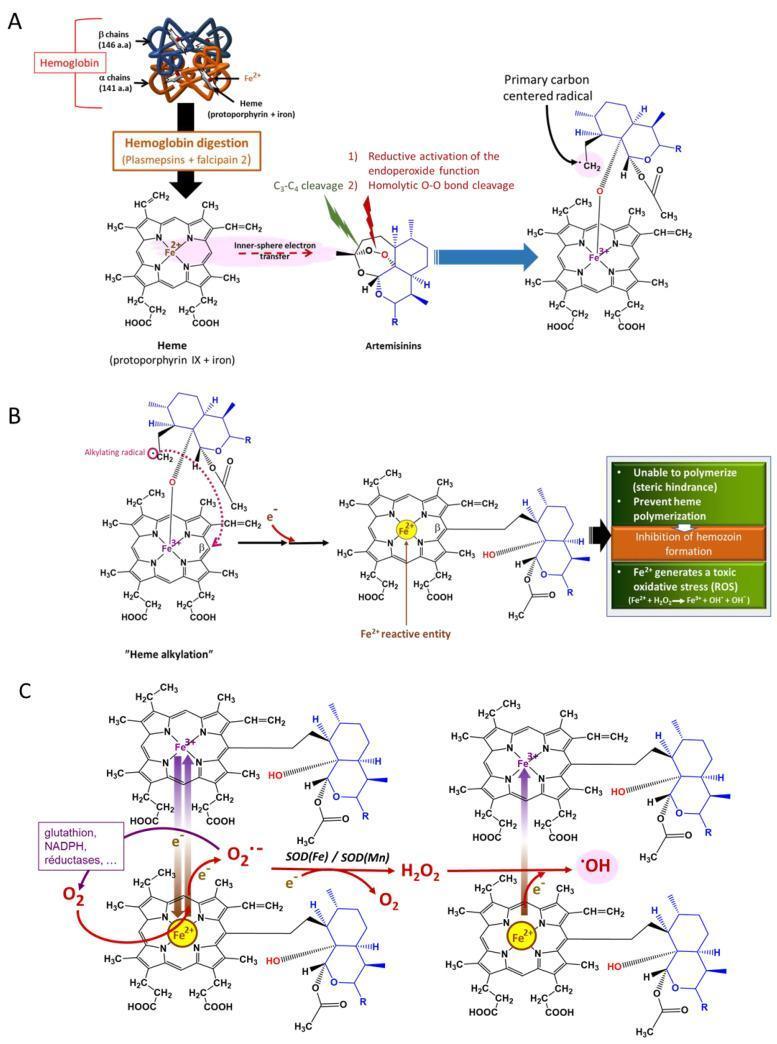
This medical pathophysiology diagram illustrates the three-stage molecular mechanism of action of artemisinins against the Plasmodium parasite. (Part A) Primary carbon-centered radical formation: Hemoglobin is digested by plasmepsins and falcipain 2 into heme (protoporphyrin IX and Fe2+). Heme iron triggers the reductive activation of the artemisinin endoperoxide bridge via homolytic O-O bond cleavage or C3-C4 cleavage, forming a highly reactive primary carbon-centered radical. (Part B) Heme alkylation: The resulting alkylating radical reacts with the heme molecule to form a heme-artemisinin adduct. This chemical modification causes steric hindrance, preventing the parasite from detoxifying heme into nontoxic hemozoin crystals. (Part C) ROS generation: The inhibited heme-artemisinin complex facilitates electron transfer involving glutathione, NADPH, and reductases. This triggers a redox cascade: molecular oxygen (O2) is reduced to superoxide radicals (O2•−), which superoxide dismutase (SOD) converts to hydrogen peroxide (H2O2). Finally, Fenton-like chemistry generates the highly deleterious hydroxyl radical (•OH). The cycling of iron between Fe2+ and Fe3+ states drives this oxidative stress, ultimately leading to parasite cellular damage and death.
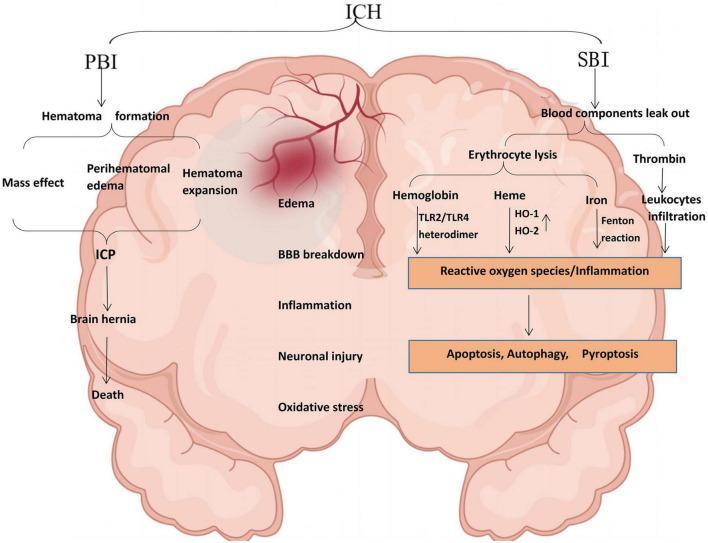
This pathophysiology diagram illustrates the dual pathways of Primary Brain Injury (PBI) and Secondary Brain Injury (SBI) following an Intracerebral Hemorrhage (ICH) within the human brain. The PBI pathway (left) focuses on mechanical complications: Hematoma formation leads to perihematomal edema and hematoma expansion, creating a mass effect. This causes increased Intracranial Pressure (ICP), leading to brain hernia and potentially death. The central region highlights shared pathological hallmarks, including blood-brain barrier (BBB) breakdown, edema, inflammation, neuronal injury, and oxidative stress. The SBI pathway (right) details biochemical cascades: blood leakage results in thrombin-mediated leukocyte infiltration and erythrocyte lysis. The lysis releases hemoglobin (activating TLR2/TLR4) and heme, which is processed by HO-1 and HO-2 into iron. Iron-driven Fenton reactions and hemoglobin activation contribute to a central node of reactive oxygen species (ROS) and inflammation. This cascade ultimately triggers cellular death mechanisms, including apoptosis, autophagy, and pyroptosis. The diagram serves as an educational summary of the complex interplay between mechanical pressure and neuroinflammatory cascades in hemorrhagic stroke.
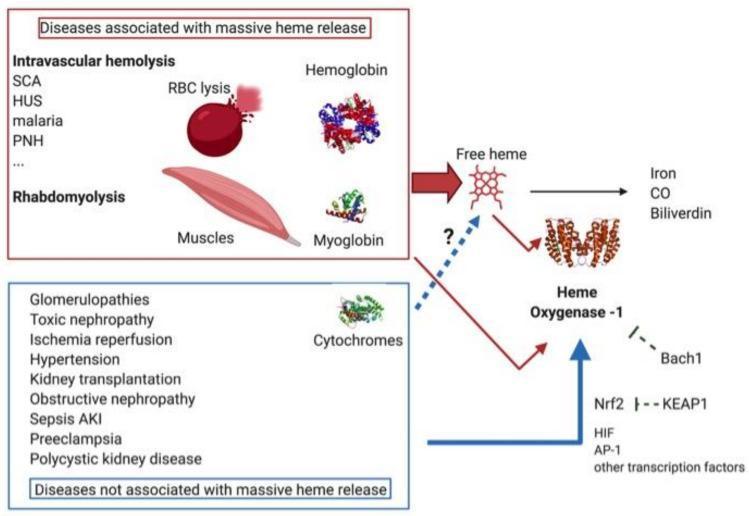
This pathophysiology diagram illustrates the regulation and role of Heme Oxygenase-1 (HO-1) in various renal and systemic pathologies. The schematic categorizes diseases into two groups: 'Diseases associated with massive heme release' (red box) and 'Diseases not associated with massive heme release' (blue box). The first group includes intravascular hemolysis (SCA, HUS, malaria, PNH) and rhabdomyolysis, visually linked to red blood cell lysis (hemoglobin) and muscle fiber injury (myoglobin), respectively, resulting in significant 'Free heme' levels. The second group comprises conditions like glomerulopathies, ischemia-reperfusion, sepsis AKI, and hypertension, which involve cytochromes and have a suspected link (dotted arrow) to free heme. Centrally, HO-1 is shown degrading free heme into iron, carbon monoxide (CO), and biliverdin. The diagram details molecular regulation of HO-1, highlighting induction by transcription factors such as Nrf2, HIF, and AP-1. Inhibitory mechanisms are also depicted, specifically the inhibition of Nrf2 by KEAP1 and the direct inhibition of HO-1 expression by Bach1. This visual summary provides a clinical context for the cytoprotective role of the HO-1 pathway in nephrology.
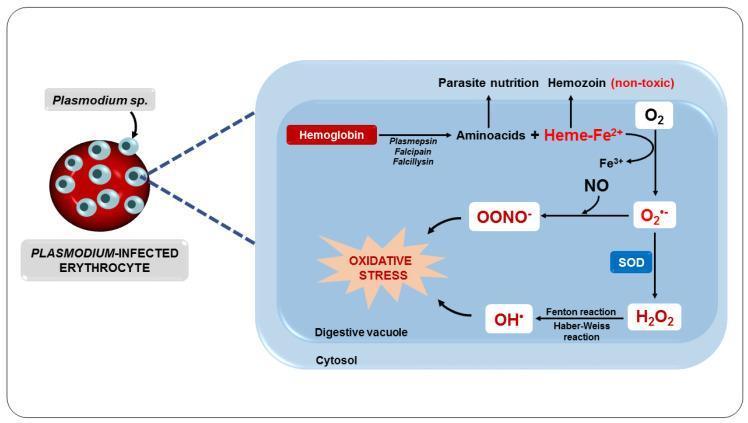
This pathophysiology diagram illustrates the metabolic processes within a Plasmodium-infected erythrocyte leading to oxidative stress. On the left, a red blood cell is shown infected with Plasmodium parasites. An enlarged view of the parasite's cytosol and digestive vacuole details the breakdown of host hemoglobin by proteases (Plasmepsin, Falcipain, Falcilysin) into amino acids for parasite nutrition and free Heme-Fe2+. While some heme is sequestered as non-toxic hemozoin, a portion undergoes oxidation. The diagram maps the biochemical pathway where Heme-Fe2+ reacts with O2 to produce superoxide (O2•−) and Fe3+. Superoxide is converted to hydrogen peroxide (H2O2) via superoxide dismutase (SOD), which then participates in the Fenton and Haber-Weiss reactions to generate hydroxyl radicals (OH•). Simultaneously, superoxide reacts with nitric oxide (NO) to form peroxynitrite (OONO−). Both OH• and OONO− are shown converging on a central 'Oxidative Stress' node, highlighting the generation of reactive oxygen and nitrogen species (RONS) as a consequence of intraerythrocytic malarial metabolism.
heme biosynthesis pathway steps ALA porphobilinogen protoporphyrin
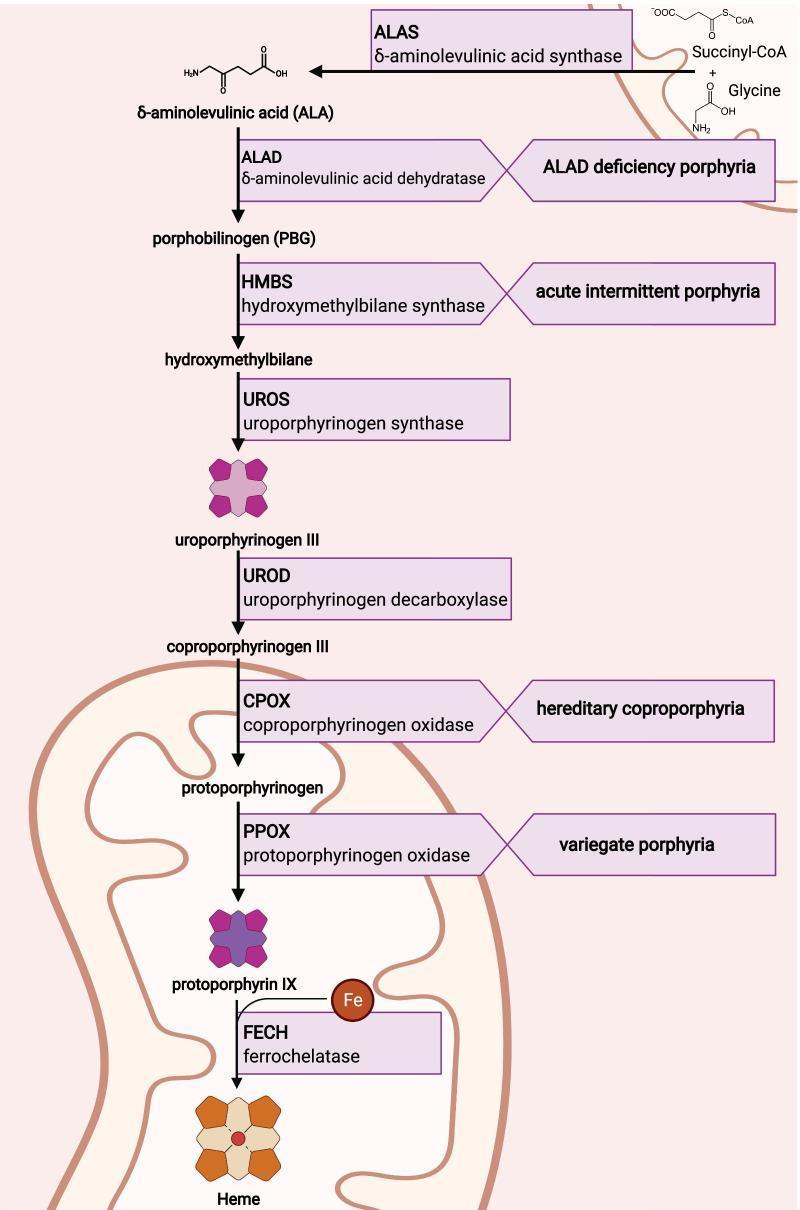
This medical pathophysiology diagram illustrates the heme biosynthesis pathway and its associated acute hepatic porphyrias. The flow is depicted across two cellular compartments: the mitochondria and the cytoplasm. The pathway begins in the mitochondria where Succinyl-CoA and Glycine are converted by ALAS (delta-aminolevulinic acid synthase) into delta-aminolevulinic acid (ALA). The process then moves to the cytoplasm, proceeding through intermediates: porphobilinogen (PBG), hydroxymethylbilane, uroporphyrinogen III, and coproporphyrinogen III, facilitated by enzymes ALAD, HMBS, UROS, and UROD respectively. The final stages return to the mitochondria, where coproporphyrinogen III is converted to protoporphyrinogen and then protoporphyrin IX via CPOX and PPOX. In the final step, ferrochelatase (FECH) incorporates iron (Fe) into protoporphyrin IX to form heme. The diagram explicitly links specific enzyme deficiencies to clinical conditions: ALAD deficiency porphyria (ADP), acute intermittent porphyria (AIP), hereditary coproporphyria (HCP), and variegate porphyria (VP). The visual uses chemical structures, enzyme labels, and mitochondrial representation to detail the metabolic sequence.
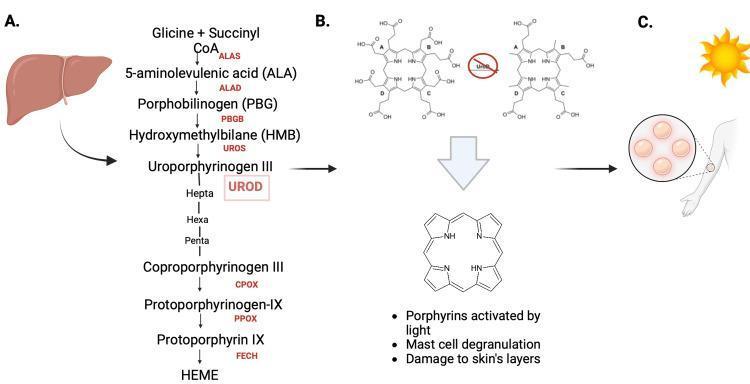
This composite educational infographic illustrates the pathophysiology of Porphyria Cutanea Tarda (PCT) through three integrated sections. Section A depicts the normal heme biosynthesis pathway in the liver, showing the enzymatic conversion starting from Glycine and Succinyl CoA, through intermediates like ALA, PBG, HMB, and Uroporphyrinogen III, catalyzed by enzymes including ALAS, ALAD, and UROD, culminating in HEME production. Section B focuses on the molecular pathogenesis of PCT, highlighting the inhibition of the enzyme Uroporphyrinogen Decarboxylase (UROD). This block leads to the accumulation of porphyrins, which is visually linked to a large chemical structure diagram. Section C demonstrates the clinical manifestation of this metabolic defect. It shows a human arm with a magnified view of cutaneous bullae (blisters) and a sun icon, illustrating how light-activated porphyrins cause mast cell degranulation and oxidative damage to skin layers. The diagram serves as an educational tool for understanding the link between hepatic enzymatic deficiencies and dermatological photosensitivity.
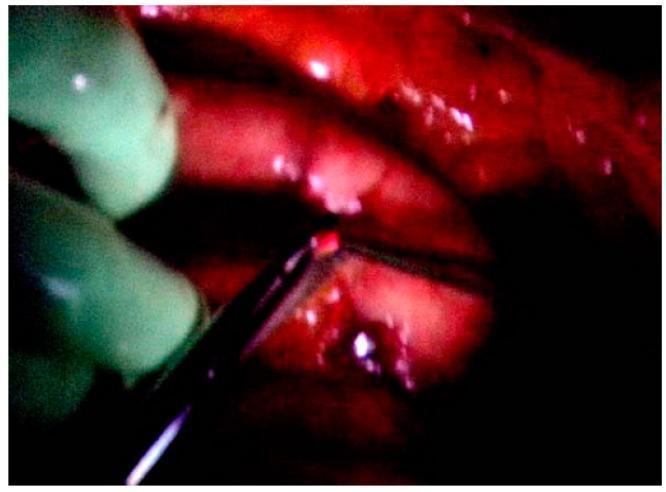
This intraoperative clinical photograph demonstrates 5-aminolevulinic acid (ALA)-guided photodynamic diagnosis (PDD) during cytoreductive surgery for peritoneal malignancy. The image shows a dark reddish surgical site, likely the peritoneal surface, containing multiple small, whitish, translucent residual nodules. Under violet light excitation (405 nm), one specific nodule exhibits prominent red fluorescence, indicative of tumor-specific protoporphyrin IX (PpIX) accumulation. A surgical grasping instrument held by a green-gloved hand is seen precisely targeting this fluorescing nodule for excision. This visual illustrates the clinical utility of PDD in identifying microscopic or residual disease that may be missed under standard white light after macroscopic complete resection. The technique leverages the heme synthesis pathway where cancer cells selectively accumulate PpIX, facilitating more thorough cytoreduction in surgical oncology.
Formation of Hemoglobin
Overview
Part 1: Heme Synthesis
Step-by-Step Pathway
| Step | Location | Substrate | Enzyme | Product |
|---|---|---|---|---|
| 1 | Mitochondria | Succinyl-CoA + Glycine | ALA synthase (ALAS; requires pyridoxal phosphate/Vit B6) | δ-Aminolevulinic acid (ALA) |
| 2 | Cytoplasm | 2x ALA | ALA dehydratase (ALAD) | Porphobilinogen (PBG) |
| 3 | Cytoplasm | 4x PBG | HMB synthase (HMBS) | Hydroxymethylbilane (HMB) |
| 4 | Cytoplasm | HMB | URO synthase (UROS) | Uroporphyrinogen III |
| 5 | Cytoplasm | Uroporphyrinogen III | URO decarboxylase (UROD) | Coproporphyrinogen III |
| 6 | Mitochondria | Coproporphyrinogen III | COPRO oxidase (CPOX) | Protoporphyrinogen IX |
| 7 | Mitochondria | Protoporphyrinogen IX | PROTO oxidase (PPOX) | Protoporphyrin IX |
| 8 | Mitochondria | Protoporphyrin IX + Fe²⁺ | Ferrochelatase (FECH) | Heme |
Key Points on Individual Steps
-
Step 1 (Rate-limiting): The condensation of succinyl-CoA and glycine by ALA synthase is the committed, rate-limiting step. It requires pyridoxal phosphate (vitamin B6) as a cofactor and occurs exclusively in the mitochondria. There are two isoforms: ALAS1 (housekeeping, chromosome 3p21.1) and ALAS2 (erythroid-specific, X-linked, chromosome Xp11.2).
-
Step 2: Two ALA molecules condense to form the monopyrrole porphobilinogen. This step is inhibited by lead, which explains why lead poisoning raises urinary ALA.
-
Steps 3-4: Four porphobilinogen molecules are assembled into the linear tetrapyrrole HMB, which is then cyclized and rearranged into uroporphyrinogen III (the physiological type III isomer). If URO synthase is deficient, the type I isomer forms instead - this is the basis of congenital erythropoietic porphyria.
-
Step 8 (Final step): Ferrochelatase (FECH) inserts ferrous iron (Fe²⁺) into protoporphyrin IX. Protoporphyrin IX is normally present in mature erythrocytes; in lead poisoning and iron deficiency, free erythrocyte protoporphyrin (FEP) accumulates because this step is impaired.
-
Henry's Clinical Diagnosis and Management by Laboratory Methods
Part 2: Globin Chain Synthesis
Types of Globin Chains and Developmental Switching
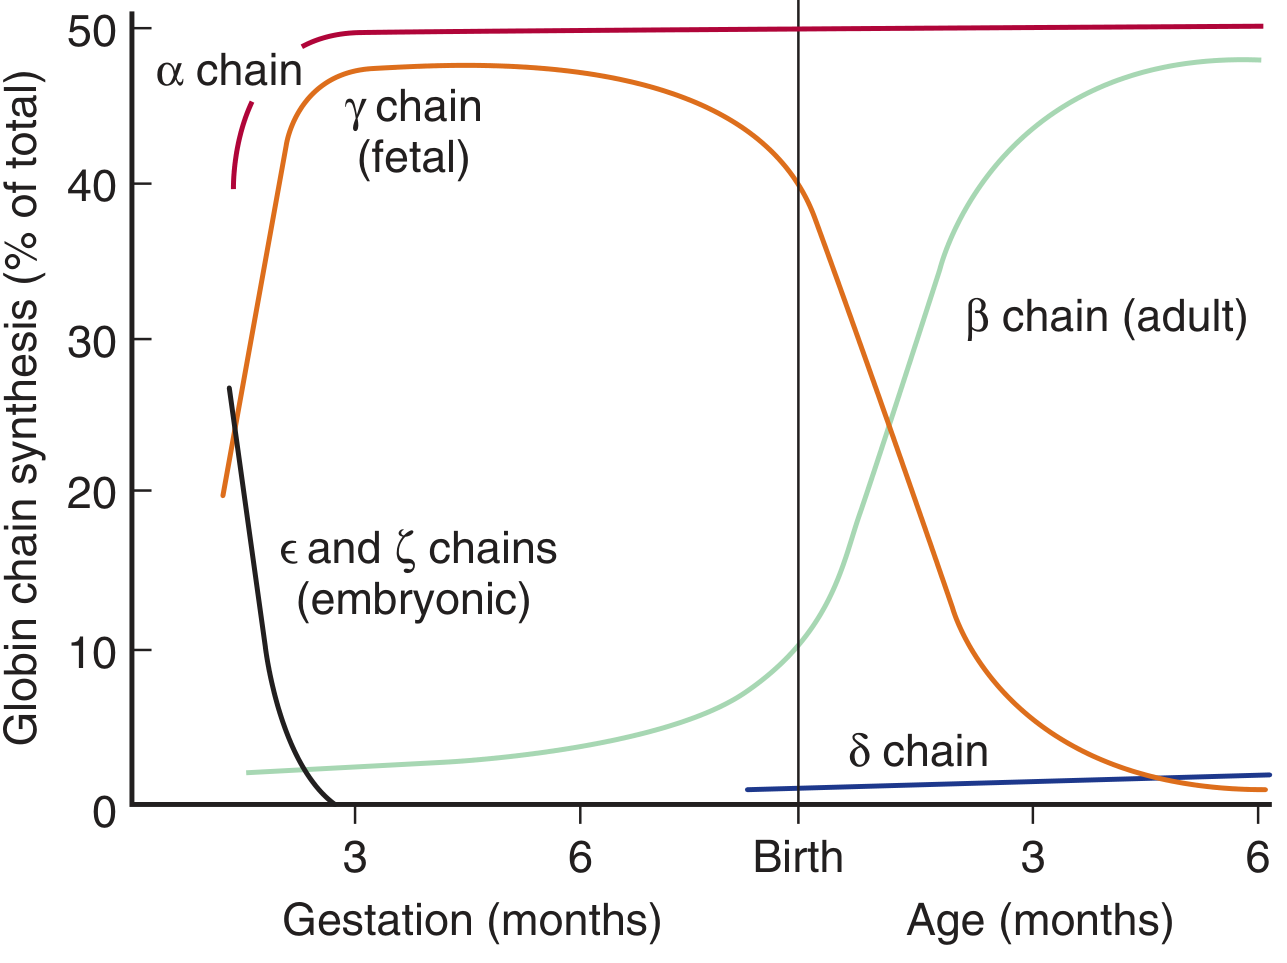
| Stage | Globin Chains | Hemoglobin Type |
|---|---|---|
| Embryonic | ζ + ε | Hb Gower (embryonic) |
| Fetal | α + γ | HbF (α₂γ₂) |
| Adult | α + β | HbA (α₂β₂) - major |
| Adult | α + δ | HbA₂ (α₂δ₂) - minor (~2.5%) |
Part 3: Assembly of the Hemoglobin Molecule
- Each heme group is inserted into a hydrophobic pocket of a single folded globin polypeptide chain.
- Four subunits combine: in HbA, two α-chains and two β-chains associate non-covalently to form a tetramer (α₂β₂).
- Each subunit contains one heme group, giving the complete molecule four heme groups and thus the ability to carry four O₂ molecules.
- The ferrous iron (Fe²⁺) in each heme has six coordination bonds: four to the pyrrole nitrogens of the porphyrin ring, one to the imidazole nitrogen of a histidine on the globin chain, and one reversibly bound to oxygen.
- Henry's Clinical Diagnosis and Management by Laboratory Methods
Part 4: Regulation of Hemoglobin Synthesis
- Heme inhibits ALAS1 (the hepatic enzyme) - classical end-product feedback inhibition.
- In erythroid cells, heme and globin synthesis are co-regulated during erythropoietin (EPO) signaling. Erythroid transcription factors GATA-1 and NF-E2 stimulate expression of ALAS2 and other pathway enzymes.
- Heme promotes globin synthesis at the level of chain initiation, enhancing ribosome-mRNA interaction. Increased heme thus increases globin output to match heme availability.
- Iron availability is critical: iron deficiency reduces heme synthesis, which secondarily reduces globin synthesis. Maturing red cells continue their developmental program of cell division until hemoglobin reaches a threshold level. Without enough iron, cells remain microcytic. - Fitzpatrick's Dermatology; Basic Medical Biochemistry 6e
Clinically Relevant Consequences of Impaired Hemoglobin Synthesis
| Defect | Condition | Mechanism |
|---|---|---|
| ALAS2 mutation (loss of function) | X-linked sideroblastic anemia | Reduced heme, iron accumulates in mitochondria |
| Iron deficiency | Microcytic hypochromic anemia | Reduced heme → reduced globin → small, pale RBCs |
| Lead poisoning | Microcytic anemia | Inhibits ALAD (step 2) and ferrochelatase (step 8), ALA and FEP accumulate |
| β-globin point mutation (val → glu) | Sickle cell disease (HbS) | Abnormal β-chain causes polymerization under deoxygenation |
| β-globin quantitative deficiency | β-thalassemia | Imbalanced α/β chain production, excess free α-chains precipitate |
| UROS deficiency | Congenital erythropoietic porphyria | Type I isomers accumulate, photosensitivity + hemolysis |
- Ganong's Review of Medical Physiology; Henry's Clinical Diagnosis; Basic Medical Biochemistry 6e