
Amti psychotic and anti depressants
What aspect of antipsychotics and antidepressants are you interested in? · What is the context for this question?
antipsychotic drug classification dopamine receptor mechanism
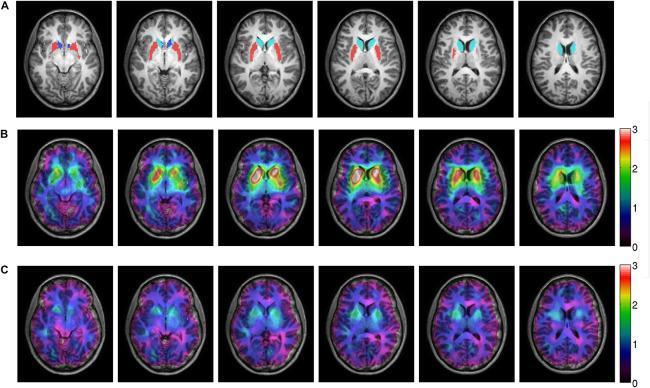
A comparison panel of axial diagnostic neuroimaging scans illustrating striatal dopamine D2 receptor occupancy during antipsychotic treatment. Panel A presents structural T1-weighted MRI slices with anatomical segmentations of the basal ganglia from the Harvard-Oxford atlas, highlighting the caudate nucleus (light blue), putamen (red), and nucleus accumbens (dark blue). Panels B and C display co-registered Single-Photon Emission Computed Tomography (SPECT) and MRI fusion images. The color heat map (scale 0–3) represents the specific binding potential of a radioactive tracer to dopamine D2 receptors. Row B shows baseline binding potential (pre-treatment) with high intensity (red/yellow) in the striatum. Row C depicts the same patient after six weeks of treatment with 300 mg of the antipsychotic amisulpride, demonstrating a visible reduction in tracer binding (blue/green shift), corresponding to a mean receptor occupancy of 56%. This visual illustrates the pharmacological mechanism of competitive receptor blockade in psychiatric neuroimaging.
![This diagnostic image displays two side-by-side transaxial Positron Emission Tomography (PET) brain scans using the radiotracer [11C]raclopride, which targets dopamine D2 receptors. The left image represents the 'Baseline' state, showing high radiotracer binding in the striatum (specifically the putamen and caudate nucleus), indicated by warm yellow and orange hues. The right image depicts the 'Drug challenge' state after the administration of 6 mg of aripiprazole. In this scan, there is a visible reduction in radiotracer uptake within the striatal regions, characterized by a shift toward cooler blue and green colors. This visual decrease represents competitive displacement of the radiotracer by aripiprazole, effectively illustrating dopamine D2 receptor occupancy by the antipsychotic medication. The comparison serves as a clinical demonstration of neuropharmacological activity and receptor binding dynamics in the human brain.](https://cdn.orris.care/cdss_images/pmc_clinical_VQA_9eb61996d0f81bca0843d76edca579a9b49b2d22a82de92e76818db7572aa7f8.jpg)
This diagnostic image displays two side-by-side transaxial Positron Emission Tomography (PET) brain scans using the radiotracer [11C]raclopride, which targets dopamine D2 receptors. The left image represents the 'Baseline' state, showing high radiotracer binding in the striatum (specifically the putamen and caudate nucleus), indicated by warm yellow and orange hues. The right image depicts the 'Drug challenge' state after the administration of 6 mg of aripiprazole. In this scan, there is a visible reduction in radiotracer uptake within the striatal regions, characterized by a shift toward cooler blue and green colors. This visual decrease represents competitive displacement of the radiotracer by aripiprazole, effectively illustrating dopamine D2 receptor occupancy by the antipsychotic medication. The comparison serves as a clinical demonstration of neuropharmacological activity and receptor binding dynamics in the human brain.
![This diagnostic comparison image features three transversal [123I]IBZM SPECT slices at the level of the striatum, illustrating dopamine D2/3 receptor (D2/3R) availability across different clinical states. The panels represent a patient with treatment-resistant depression (TRD), a TRD patient receiving antipsychotic medication (TRD AP), and a healthy control (HC) subject. In the TRD and HC images, there is a prominent, bilateral, and symmetric high-intensity signal within the striatal regions (caudate and putamen), appearing as well-defined, bright orange-yellow structures against a darker background. In contrast, the TRD AP image demonstrates a marked reduction in signal intensity and distinctness in the striatum. This visual difference indicates high occupancy of D2/3 receptors by antipsychotic dopamine antagonists, which reduces the binding availability for the radiotracer. The comparison serves to illustrate that while TRD alone does not significantly alter striatal D2/3R availability compared to healthy controls, pharmacological intervention with antipsychotics causes a visible and quantifiable decrease in receptor availability.](https://cdn.orris.care/cdss_images/pmc_clinical_VQA_340836387dce764e67c5251a1d168b40843d648e503bc7baf69e146346e891f8.jpg)
This diagnostic comparison image features three transversal [123I]IBZM SPECT slices at the level of the striatum, illustrating dopamine D2/3 receptor (D2/3R) availability across different clinical states. The panels represent a patient with treatment-resistant depression (TRD), a TRD patient receiving antipsychotic medication (TRD AP), and a healthy control (HC) subject. In the TRD and HC images, there is a prominent, bilateral, and symmetric high-intensity signal within the striatal regions (caudate and putamen), appearing as well-defined, bright orange-yellow structures against a darker background. In contrast, the TRD AP image demonstrates a marked reduction in signal intensity and distinctness in the striatum. This visual difference indicates high occupancy of D2/3 receptors by antipsychotic dopamine antagonists, which reduces the binding availability for the radiotracer. The comparison serves to illustrate that while TRD alone does not significantly alter striatal D2/3R availability compared to healthy controls, pharmacological intervention with antipsychotics causes a visible and quantifiable decrease in receptor availability.
antidepressant SSRI serotonin reuptake inhibitor mechanism classification
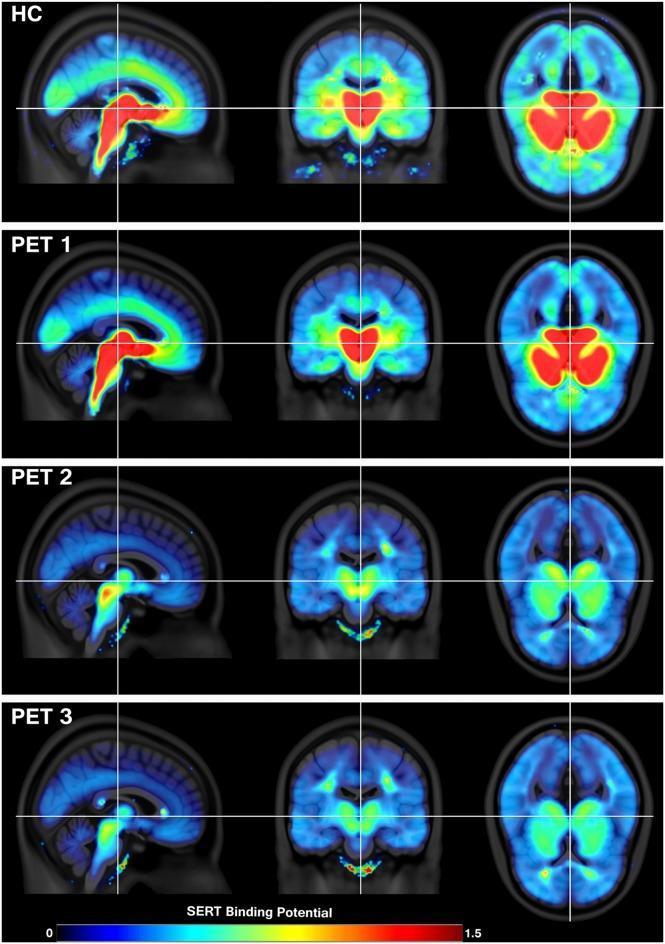
This diagnostic image composite features Positron Emission Tomography (PET) scans illustrating Serotonin Transporter (SERT) availability in the human brain across sagittal, coronal, and axial views. The panels compare a Healthy Control (HC) group with patients with Major Depressive Disorder (MDD) at three intervals: baseline (PET 1), 6 hours post-single dose of a Selective Serotonin Reuptake Inhibitor (SSRI) (PET 2), and after 3 weeks of daily SSRI treatment (PET 3). A colorimetric scale at the bottom indicates SERT binding potential (BPND), ranging from blue (low) to red (high). At baseline (HC and PET 1), high SERT availability is visible in red and yellow within the brainstem (midbrain), thalamus, and subcortical regions, with moderate levels in the cingulate cortex. PET 2 shows a significant reduction in binding potential, represented by a shift toward green and blue, indicating acute SERT occupancy by the SSRI. PET 3 demonstrates sustained and further reduced SERT availability, reflecting long-term therapeutic occupancy. This visual serves as a pharmacological demonstration of antidepressant mechanism of action and brain-wide distribution of serotonin transporters.
![This educational graphic illustrates the effects of a selective serotonin reuptake inhibitor (SSRI) challenge on functional brain responses within the anterior cingulate cortex (ACC). Part (A) features diagnostic neuroimaging (fMRI) consisting of a mid-sagittal and three axial brain slices (Z coordinates 0, 15, 30). Three anatomical regions of interest are highlighted: pregenual area 32 (p32, purple), pregenual area 24 (p24, pink), and subgenual area 25 (s25, green). Part (B) presents three comparison bar charts showing functional activation in arbitrary units [a.u.] across four behavioral event types: violent, attempted, non-violent, and non-intended actions. The charts compare Placebo (PLAC, blue) versus SSRI (yellow) conditions. In pregenual regions p32 and p24, the SSRI significantly enhances deactivation (negative BOLD response) specifically during violent and attempted violent events, indicated by asterisk markers (p < 0.05 and p < 0.01). In contrast, subgenual area 25 (rightmost chart, hatched bars) shows no significant differences between drug conditions. This visual demonstrates the regional specificity of serotonergic modulation on social-emotional processing in the prefrontal cortex.](https://cdn.orris.care/cdss_images/pmc_clinical_VQA_c129a0e89e17834eb78d53c1305fe4a8dd2da02864a11ade35493a5b4660f437.jpg)
This educational graphic illustrates the effects of a selective serotonin reuptake inhibitor (SSRI) challenge on functional brain responses within the anterior cingulate cortex (ACC). Part (A) features diagnostic neuroimaging (fMRI) consisting of a mid-sagittal and three axial brain slices (Z coordinates 0, 15, 30). Three anatomical regions of interest are highlighted: pregenual area 32 (p32, purple), pregenual area 24 (p24, pink), and subgenual area 25 (s25, green). Part (B) presents three comparison bar charts showing functional activation in arbitrary units [a.u.] across four behavioral event types: violent, attempted, non-violent, and non-intended actions. The charts compare Placebo (PLAC, blue) versus SSRI (yellow) conditions. In pregenual regions p32 and p24, the SSRI significantly enhances deactivation (negative BOLD response) specifically during violent and attempted violent events, indicated by asterisk markers (p < 0.05 and p < 0.01). In contrast, subgenual area 25 (rightmost chart, hatched bars) shows no significant differences between drug conditions. This visual demonstrates the regional specificity of serotonergic modulation on social-emotional processing in the prefrontal cortex.
![This diagnostic image displays parametric positron emission tomography (PET) scans in a sagittal view, comparing [11C]AZ10419369 radioligand binding before (PET 1) and after (PET 2) treatment with escitalopram, a selective serotonin reuptake inhibitor (SSRI). The radioligand targets 5-HT1B receptors. The images are normalized to Montreal Neurological Institute (MNI) space. A color scale indicates the Non-Displaceable Binding Potential (BPND), ranging from 0.0 (dark purple/blue) to over 2.0 (white/pink). High binding is initially observed in cortical regions and the brainstem. Insets provide a zoomed-in view of the brainstem, specifically highlighting the dorsal brainstem (DBS) region of interest (ROI) outlined in white. Comparison between PET 1 and PET 2 reveals a visible reduction in radioligand binding within the DBS ROI following treatment, characterized by a shift from yellow/green hues (BPND ~1.0-1.5) to cooler blue/purple tones (BPND ~0.5). This visualization demonstrates the pharmacological effect of SSRI treatment on 5-HT1B receptor availability in the human brainstem, relevant for neuroscientific research into Major Depressive Disorder (MDD).](https://cdn.orris.care/cdss_images/pmc_clinical_VQA_4520ff6b9e93a0661e35fd89fdd3b4dc406b15cda69343d655b9e210420ee0f6.jpg)
This diagnostic image displays parametric positron emission tomography (PET) scans in a sagittal view, comparing [11C]AZ10419369 radioligand binding before (PET 1) and after (PET 2) treatment with escitalopram, a selective serotonin reuptake inhibitor (SSRI). The radioligand targets 5-HT1B receptors. The images are normalized to Montreal Neurological Institute (MNI) space. A color scale indicates the Non-Displaceable Binding Potential (BPND), ranging from 0.0 (dark purple/blue) to over 2.0 (white/pink). High binding is initially observed in cortical regions and the brainstem. Insets provide a zoomed-in view of the brainstem, specifically highlighting the dorsal brainstem (DBS) region of interest (ROI) outlined in white. Comparison between PET 1 and PET 2 reveals a visible reduction in radioligand binding within the DBS ROI following treatment, characterized by a shift from yellow/green hues (BPND ~1.0-1.5) to cooler blue/purple tones (BPND ~0.5). This visualization demonstrates the pharmacological effect of SSRI treatment on 5-HT1B receptor availability in the human brainstem, relevant for neuroscientific research into Major Depressive Disorder (MDD).
Antipsychotic Drugs
Classification
First-Generation (Typical / Neuroleptics)
| Chemical Class | Prototype Drug | Potency | EPS Risk | Sedation | Hypotension |
|---|---|---|---|---|---|
| Phenothiazine - Aliphatic | Chlorpromazine | Low | Medium | High | High |
| Phenothiazine - Piperazine | Fluphenazine | High | High | Low | Very Low |
| Phenothiazine - Piperidine | Thioridazine | Low | Low | High | High |
| Thioxanthene | Thiothixene | High | Medium | Medium | Medium |
| Butyrophenone | Haloperidol | High | Very High | Low | Very Low |
| Dibenzoxazepine | Loxapine | Medium | Medium | Medium | Low |
Second-Generation (Atypical)
| Drug | Notable Features |
|---|---|
| Clozapine | Most effective for treatment-resistant schizophrenia; risk of agranulocytosis (up to 2%), requires WBC monitoring; very low EPS |
| Risperidone | Broad efficacy; EPS at higher doses; hyperprolactinemia |
| Olanzapine | Effective vs. positive AND negative symptoms; significant weight gain, dyslipidemia, T2DM risk |
| Quetiapine | Low EPS; short t1/2 (twice-daily dosing); metabolic effects intermediate |
| Ziprasidone | Least weight gain among SGAs; QTc prolongation - caution in cardiac disease |
| Aripiprazole | Partial D2 agonist + 5-HT2A antagonist; low weight gain; novel mechanism |
| Paliperidone | Active metabolite of risperidone |
| Lurasidone | Good metabolic profile; indicated for bipolar depression |
| Cariprazine | D2/D3 partial agonist + 5-HT2A antagonist; effective for negative symptoms |
| Brexpiprazole | Similar to aripiprazole; used as MDD adjunct |
| Asenapine | Sublingual formulation; intermediate metabolic effects |
- Xanomeline (muscarinic M1/M4 agonist) + Ulotaront (TAAR-1 agonist): no EPS, no metabolic effects, potential for negative and cognitive symptoms
Mechanism of Action
- 60% D2 occupancy is needed for antipsychotic efficacy with FGAs
- EPS occurs at >80% D2 occupancy in the striatum
- SGAs need only 30-50% D2 occupancy because concurrent 5-HT2A blockade compensates
- Aripiprazole achieves high D2 occupancy but causes no EPS because it is a partial agonist, not a full antagonist
| Pathway | Effect of Blockade |
|---|---|
| Mesolimbic | Reduces positive symptoms (therapeutic) |
| Mesocortical | May worsen negative/cognitive symptoms |
| Nigrostriatal | EPS (akathisia, dystonia, Parkinsonism, tardive dyskinesia) |
| Tuberoinfundibular | Hyperprolactinemia (galactorrhea, amenorrhea, sexual dysfunction) |
Clinical Indications
- Schizophrenia (positive and negative symptoms)
- Bipolar disorder - acute mania, bipolar depression (quetiapine, lurasidone, cariprazine), maintenance
- MDD with psychotic features (adjunct therapy)
- Psychosis in dementia (use with caution - black box warning for mortality in elderly)
- Drug-induced psychosis
- Delirium (haloperidol IV preferred)
- Tourette syndrome (haloperidol, pimozide)
- Nausea/vomiting (prochlorperazine, promethazine - phenothiazines)
- Parkinson's psychosis (pimavanserin - 5-HT2A antagonist only, no D2 blockade)
Adverse Effects
EPS (dose-dependent, more with FGAs)
- Acute dystonia - hours to days after starting; treat with anticholinergics (benztropine, diphenhydramine)
- Akathisia - inner restlessness; treat with propranolol or benzodiazepines
- Drug-induced Parkinsonism - bradykinesia, rigidity, tremor; treat with anticholinergics
- Tardive dyskinesia (TD) - repetitive involuntary movements after long-term use; may be irreversible; treat with valbenazine or deutetrabenazine (VMAT2 inhibitors)
Metabolic Effects (mainly SGAs)
- Weight gain hierarchy: Clozapine > Olanzapine > Quetiapine > Asenapine > Risperidone > Aripiprazole > Ziprasidone
- Dyslipidemia, glucose intolerance, new-onset T2DM (especially clozapine, olanzapine)
Other Serious ADRs
- Neuroleptic Malignant Syndrome (NMS) - hyperthermia, rigidity, autonomic instability, elevated CK; rare but life-threatening
- QTc prolongation - ziprasidone, IV haloperidol; risk of Torsades de Pointes
- Agranulocytosis - clozapine (0.5-2%); mandatory ANC monitoring (REMS program)
- Hyperprolactinemia - risperidone > haloperidol > olanzapine; aripiprazole actually lowers prolactin
- Sedation - chlorpromazine, quetiapine, clozapine
- Orthostatic hypotension - alpha-1 blockade; especially low-potency phenothiazines and clozapine
- Anticholinergic effects - dry mouth, urinary retention, constipation, blurred vision; mainly low-potency FGAs and clozapine
Antidepressant Drugs
Classification & Mechanisms
1. Selective Serotonin Reuptake Inhibitors (SSRIs)
| Drug | Half-life | Active Metabolite t1/2 | Notes |
|---|---|---|---|
| Fluoxetine | 48-72 h | 180 h (norfluoxetine) | Longest t1/2; safest in pregnancy context; inhibits CYP2D6/3A4 |
| Sertraline | 22-27 h | 62-104 h | Minimal drug interactions; preferred in cardiac patients |
| Escitalopram | 27-32 h | None | Cleanest receptor profile; good tolerability |
| Citalopram | 33-38 h | None | Dose-limited by QTc (max 40 mg/day) |
| Paroxetine | 20-23 h | None | Most anticholinergic SSRI; teratogenic risk; worst discontinuation syndrome |
| Fluvoxamine | 14-18 h | 14-16 h | Mainly used for OCD |
- Serotonin syndrome (with MAOIs, tramadol, triptans, linezolid): fever, agitation, clonus, hyperreflexia, diaphoresis, delirium - can be fatal
- SSRI discontinuation syndrome (especially paroxetine): "FINISH" - flu-like symptoms, insomnia, nausea, imbalance, sensory disturbances, hyperarousal
- Mania precipitation in unrecognized bipolar disorder
- Bleeding risk (inhibit platelet 5-HT uptake) - especially with NSAIDs/anticoagulants
- Hyponatremia (SIADH) - elderly patients
- Black box: suicidality in <25 years - monitor closely in first 4 weeks
2. Serotonin-Norepinephrine Reuptake Inhibitors (SNRIs)
| Drug | Preferred Indication(s) |
|---|---|
| Venlafaxine | MDD, GAD, panic, social anxiety; at low doses acts like SSRI; NE effect kicks in at higher doses |
| Desvenlafaxine | Active metabolite of venlafaxine; similar profile |
| Duloxetine | MDD, GAD, diabetic neuropathy, fibromyalgia, stress urinary incontinence |
| Levomilnacipran | MDD; more NE-selective than other SNRIs |
3. Tricyclic Antidepressants (TCAs)
- Anticholinergic: dry mouth, blurred vision, urinary retention, constipation, confusion in elderly
- Antihistaminic (H1): sedation, weight gain
- Alpha-1 blockade: orthostatic hypotension, tachycardia
- Cardiac: QRS/QTc prolongation, heart block (use with extreme caution in cardiac disease)
4. Monoamine Oxidase Inhibitors (MAOIs)
| Drug | Selectivity |
|---|---|
| Phenelzine | Irreversible MAO-A + B |
| Tranylcypromine | Irreversible MAO-A + B |
| Moclobemide | Reversible MAO-A (RIMA) |
| Selegiline (transdermal) | Selective MAO-B at low dose; used in Parkinson's |
- Hypertensive crisis from tyramine-containing foods (aged cheese, cured meats, red wine, beer) - the "cheese effect" - because dietary tyramine normally metabolized by MAO in gut/liver
- Serotonin syndrome if combined with SSRIs, SNRIs, meperidine, tramadol, dextromethorphan
- Washout period: 2 weeks after stopping MAOI before starting SSRI; 5 weeks after stopping fluoxetine (long t1/2) before starting MAOI
5. Serotonin Modulators (Atypical Antidepressants)
| Drug | Mechanism | Key Features |
|---|---|---|
| Bupropion | NE + dopamine reuptake inhibitor (NDRI); no serotonergic activity | No sexual dysfunction; used for smoking cessation; lowers seizure threshold; no weight gain; preferred in bipolar depression as less likely to induce mania |
| Mirtazapine | NaSSA (alpha-2 antagonist + 5-HT2/5-HT3 blocker) | Increases NE + 5-HT release; strong sedation (H1); significant weight gain; useful for depression with insomnia/anorexia; no sexual dysfunction |
| Trazodone | 5-HT2A antagonist + weak SERT inhibitor | Mainly used as hypnotic adjunct (at low doses); rare but serious: priapism |
| Nefazodone | 5-HT2A antagonist + SERT inhibitor | Hepatotoxicity risk - rarely used now |
| Vortioxetine | SERT inhibitor + 5-HT1A agonist + 5-HT3/7 antagonist | Multimodal; may improve cognitive symptoms of depression |
6. Pharmacokinetics Summary (Selected Agents)
| Class/Drug | Bioavailability | t1/2 (h) | Protein Binding (%) |
|---|---|---|---|
| Fluoxetine | 70% | 48-72 | 95 |
| Sertraline | 45% | 22-27 | 98 |
| Venlafaxine | 45% | 8-11 | 27 |
| Duloxetine | 50% | 12-15 | 97 |
| Amitriptyline | 45% | 31-46 | 90 |
| Imipramine | 40% | 9-24 | 84 |
Antidepressant Indications Beyond MDD
| Condition | Preferred Agent(s) |
|---|---|
| GAD | SSRIs, SNRIs (especially duloxetine, venlafaxine) |
| Panic disorder | SSRIs, TCAs (imipramine) |
| OCD | SSRIs (high dose), clomipramine (most potent for OCD) |
| PTSD | Sertraline, paroxetine (FDA-approved) |
| Neuropathic pain | Duloxetine, TCAs (amitriptyline), SNRIs |
| Fibromyalgia | Duloxetine, milnacipran |
| Smoking cessation | Bupropion |
| Enuresis (childhood) | Imipramine |
| Migraine prophylaxis | Amitriptyline |
Key Clinical Principles for Prescribers
- Onset of therapeutic effect: 2-4 weeks for antidepressants (all classes). Patient and family must be counseled on this.
- Trial duration: An adequate trial is full therapeutic dose for at least 4-6 weeks. If no response, switch class or augment.
- Switching from SSRI to MAOI: Wait 2 weeks (5 weeks for fluoxetine) to avoid serotonin syndrome.
- Augmentation strategies in treatment-resistant depression: Add lithium, atypical antipsychotic (aripiprazole, quetiapine, brexpiprazole), or switch to venlafaxine/bupropion.
- Antipsychotic monitoring: Clozapine requires ANC monitoring (weekly x 6 months, then bi-weekly x 6 months, then monthly). Metabolic panel, weight, and fasting glucose/lipids every 3-12 months for all SGAs.
- SSRI + antipsychotic combinations are commonly used in psychotic depression and bipolar depression (e.g., olanzapine + fluoxetine = Symbyax).
- Avoid MAOIs + meperidine - fatal serotonin syndrome risk. The patient case in the textbook is a direct example.
- Discontinuation: Taper antipsychotics and antidepressants slowly to avoid rebound and withdrawal syndromes.