

1000107181.png
Ans
I can see this is a list of physiology topics - looks like a syllabus or study list. Let me clarify what you need before diving in.
Asking for Preferences
What would you like me to do with these physiology topics?
Reading File
Given the large number of topics (15+), I'll provide comprehensive explanations for all of them from my medical knowledge. Let me search the library for key topics in parallel.
Finding Sources
Finding Sources
Finding Sources
Reading File
Reading File
Reading File
Finding Sources
Finding Sources
Finding Sources
Reading File
Reading File
I now have excellent textbook content. Let me compile the full comprehensive answer for all 15 topics.
Comprehensive Physiology Notes
1. Transport Through Cell Membrane
The cell membrane is a lipid bilayer studded with protein molecules. Transport occurs via two fundamental mechanisms:
A. Diffusion (Passive Transport)
- Random molecular movement from high to low concentration - no energy needed
- Simple diffusion: Lipid-soluble substances (O2, CO2, fatty acids, steroids) cross directly through the lipid bilayer
- Facilitated diffusion: Water-soluble substances use protein channels or carrier proteins; still moves down concentration gradient; no ATP required (e.g., glucose into RBCs via GLUT transporters)
B. Active Transport
- Movement against a concentration/electrochemical gradient - requires ATP
- Primary active transport: Directly uses ATP (e.g., Na⁺/K⁺-ATPase pump: 3 Na⁺ out, 2 K⁺ in per cycle)
- Secondary active transport: Uses the electrochemical gradient created by primary transport
- Co-transport (symport): Two substances move in same direction (e.g., Na⁺-glucose in gut)
- Counter-transport (antiport): Substances move in opposite directions (e.g., Na⁺-H⁺ exchanger)
C. Vesicular Transport
- Endocytosis: Phagocytosis (solids), pinocytosis (fluids), receptor-mediated endocytosis
- Exocytosis: Release of secretory products (hormones, neurotransmitters)
- Guyton and Hall Textbook of Medical Physiology
2. Homeostasis
Homeostasis is the maintenance of a stable internal environment despite external changes. Proposed by Claude Bernard and named by Walter Cannon.
Key components:
- Controlled variable: The parameter being regulated (e.g., body temperature, blood glucose, pH)
- Sensor/Receptor: Detects deviation from the set point
- Control center: Integrates information (usually the brain/hypothalamus)
- Effector: Produces a corrective response
Feedback mechanisms:
- Negative feedback: Correction opposes the change - most common (e.g., temperature regulation, blood pressure, blood glucose)
- Positive feedback: Amplifies the change - used in specific situations (e.g., childbirth - oxytocin surge, blood clotting cascade, ovulation LH surge, action potential depolarization)
Examples of homeostatic control:
- Blood glucose: Insulin (lowers) / Glucagon (raises)
- Body temperature: Sweating and vasodilation (lowers) / Shivering and vasoconstriction (raises)
- Blood pressure: Baroreceptor reflex, RAAS system
- Fluid balance: ADH (antidiuretic hormone), aldosterone
3. Red Blood Cells (RBC)
Normal values:
- Males: 4.5-5.5 million/mm³; Females: 3.8-4.8 million/mm³
- Hemoglobin (Hb): Males 13-18 g/dL; Females 12-16 g/dL
- Hematocrit (PCV): Males 40-54%; Females 36-48%
- Life span: 120 days
Structure:
- Biconcave disc (7.5 µm diameter, 2 µm thick) - maximizes surface area for gas exchange
- No nucleus, no mitochondria - uses anaerobic glycolysis (Embden-Meyerhof pathway)
- Flexible - can squeeze through capillaries (3-4 µm)
Function:
- Transport O₂ (via hemoglobin) and CO₂
- Buffering: Hemoglobin is a major blood buffer
- Carbonic anhydrase: Converts CO₂ + H₂O → H₂CO₃ (facilitates CO₂ transport)
Hemoglobin:
- Each Hb molecule has 4 globin chains + 4 heme groups (each with Fe²⁺)
- HbA (adult): α₂β₂; HbA₂: α₂δ₂; HbF (fetal): α₂γ₂ (higher O₂ affinity)
- One Hb carries 4 O₂ molecules; 1g Hb carries 1.34 mL O₂
Erythropoiesis:
- Site: Liver/spleen (fetal) → bone marrow (adult)
- Stimulus: Erythropoietin (EPO) from kidney (in hypoxia)
- Requires: Iron, Vit B12, Folic acid, Vit C
4. Anemia
Anemia = reduction in Hb concentration, RBC count, or PCV below normal.
Classification by MCV (Mean Corpuscular Volume):
| Type | MCV | Causes |
|---|---|---|
| Microcytic (MCV <80 fL) | Small RBCs | Iron deficiency, Thalassemia, Sideroblastic anemia |
| Normocytic (MCV 80-100 fL) | Normal size | Aplastic anemia, Acute blood loss, Hemolytic anemia, CKD |
| Macrocytic (MCV >100 fL) | Large RBCs | Vit B12/Folate deficiency (megaloblastic), Liver disease |
Iron Deficiency Anemia (most common):
- Stages: Iron store depletion → Iron-deficient erythropoiesis → Frank anemia
- Blood film: Microcytic, hypochromic, poikilocytosis, pencil cells
- Labs: Low serum iron, low ferritin, high TIBC, low reticulocyte count
- Treatment: Oral iron (ferrous sulfate)
Pernicious Anemia (Vit B12 deficiency):
- Cause: Lack of intrinsic factor → cannot absorb Vit B12
- Features: Megaloblastic anemia + subacute combined degeneration of spinal cord
- Hypersegmented neutrophils on blood film
Hemolytic Anemia:
- Raised reticulocytes, raised bilirubin (jaundice), raised LDH, low haptoglobin
- Intravascular: G6PD deficiency, transfusion reaction
- Extravascular (spleen): Hereditary spherocytosis, sickle cell disease
5. Hemostasis
Hemostasis is the arrest of bleeding. It involves three overlapping phases:
Phase 1 - Vascular Spasm:
- Immediate vasoconstriction of injured vessel
- Mediated by local myogenic response + released chemicals (thromboxane A₂, serotonin)
Phase 2 - Primary Hemostasis (Platelet Plug):
- Adhesion: Platelets adhere to exposed subendothelial collagen via von Willebrand factor (vWF) and platelet receptor GPIb
- Activation: Platelets degranulate, releasing ADP, TXA₂, serotonin
- Aggregation: More platelets recruited; fibrinogen bridges via GPIIb/IIIa receptors
- Result: Unstable platelet plug (adequate for small vessel injuries)
Phase 3 - Secondary Hemostasis (Coagulation Cascade):
- Extrinsic pathway: Tissue factor (TF/Factor III) + Factor VIIa → activates Factor X
- Intrinsic pathway: Contact activation (Factor XII) → XI → IX → X
- Common pathway: Factor Xa + Va → Prothrombin → Thrombin → Fibrinogen → Fibrin
- Fibrin is cross-linked by Factor XIIIa → stable clot
Fibrinolysis:
- tPA (tissue plasminogen activator) → Plasminogen → Plasmin → degrades fibrin
- Products: D-dimers (marker of clot breakdown)
Anticoagulants used clinically:
- Heparin: Activates antithrombin III; inactivates thrombin and Xa
- Warfarin: Inhibits Vitamin K-dependent factors (II, VII, IX, X, Protein C & S)
6. Blood Groups
ABO System:
| Group | Antigen on RBC | Antibody in Plasma | Can donate to | Can receive from |
|---|---|---|---|---|
| A | A | Anti-B | A, AB | A, O |
| B | B | Anti-A | B, AB | B, O |
| AB | A & B | None | AB only | All (universal recipient) |
| O | None | Anti-A & Anti-B | All (universal donor) | O only |
- Antibodies are IgM (naturally occurring, develop by age 6 months due to gut bacteria exposure)
Rh System:
- Rh positive (Rh+): Have D antigen on RBC (~85% of population)
- Rh negative (Rh-): No D antigen
- No natural antibodies - Anti-D antibodies form only after exposure (transfusion or pregnancy)
- Hemolytic Disease of Newborn (HDN): Rh- mother, Rh+ fetus → 2nd pregnancy at risk
- Prevention: Anti-D immunoglobulin (Rhogam) given to Rh- mothers
Blood transfusion reactions:
- Acute hemolytic reaction: ABO incompatibility, IgM-mediated intravascular hemolysis (fever, chills, hemoglobinuria, DIC)
- Febrile non-hemolytic: Most common reaction; anti-WBC antibodies
7. Properties of Skeletal Muscle
Structural organization:
- Muscle → Fascicles → Muscle fibers (cells) → Myofibrils → Sarcomeres
- Sarcomere (functional unit): Z-line to Z-line
- A band (dark): Contains myosin (thick filaments) + actin overlap
- I band (light): Actin only
- H zone: Myosin only (no actin overlap)
- M line: Center of H zone
Sliding Filament Theory:
Actin slides over myosin → sarcomere shortens → muscle contracts
- Triggered by rise in intracellular Ca²⁺
- Ca²⁺ binds troponin-C → tropomyosin shifts → exposes actin active sites → myosin cross-bridge cycling
Neuromuscular events:
- Action potential → T-tubules → SR releases Ca²⁺ → contraction
Types of skeletal muscle fibers:
| Property | Type I (Slow twitch) | Type II (Fast twitch) |
|---|---|---|
| Color | Red | White |
| Myosin ATPase | Slow | Fast |
| Mitochondria | Many | Few |
| Fatigue | Resistant | Fatigue easily |
| Function | Endurance (posture) | Explosive power (sprinting) |
Properties:
- Excitability: Responds to stimuli
- Contractility: Ability to shorten
- Extensibility: Can be stretched
- Elasticity: Returns to original length
- All-or-none law: A single fiber contracts maximally or not at all
- Summation and Tetanus: Repeated stimuli before relaxation → summation → complete tetanus (smooth sustained contraction)
8. Neuromuscular Junction (NMJ)
The NMJ is the synapse between a motor neuron and skeletal muscle fiber.
Structure:
- Presynaptic terminal (motor end plate knob)
- Synaptic cleft (~50 nm)
- Postsynaptic membrane (motor end plate) with nicotinic ACh receptors (nAChR)
Steps of neuromuscular transmission:
- Action potential arrives at motor nerve terminal
- Voltage-gated Ca²⁺ channels open → Ca²⁺ influx
- Synaptic vesicles fuse with membrane → ACh released by exocytosis
- ACh diffuses across cleft → binds nicotinic receptors on motor end plate
- Ion channels open (Na⁺ in, K⁺ out) → End plate potential (EPP)
- EPP triggers action potential in muscle fiber → contraction
- ACh rapidly degraded by acetylcholinesterase (AChE) in synaptic cleft
Clinical relevance:
- Myasthenia Gravis: Autoantibodies against nAChR → muscle weakness (treat with AChE inhibitors like neostigmine)
- Lambert-Eaton Syndrome: Autoantibodies against presynaptic voltage-gated Ca²⁺ channels (associated with small cell lung cancer)
- Botulinum toxin: Prevents ACh release → flaccid paralysis
- Succinylcholine: Depolarizing NMJ blocker (used in anesthesia)
- Curare/Vecuronium: Non-depolarizing blocker → competitive antagonist at nAChR
9. Properties of Cardiac Muscle
Cardiac muscle shares features with both skeletal and smooth muscle.
Structural differences from skeletal muscle:
- Striated, but cells are uninucleate (one nucleus)
- Connected by intercalated discs (contain gap junctions and desmosomes)
- Gap junctions: Allow electrical coupling → heart acts as a functional syncytium
- Branching network of fibers
- T-tubules present but larger; SR less developed
Electrical properties:
- Automaticity: Can generate its own action potential (SA node pacemaker)
- Rhythmicity: Regular, repeating action potentials
- Conductivity: Spreads impulse through gap junctions
- All-or-none law: Applies to the entire heart (syncytium)
Cardiac action potential (ventricular muscle):
- Phase 0: Rapid depolarization - voltage-gated Na⁺ channels open
- Phase 1: Early repolarization - K⁺ efflux
- Phase 2: Plateau - Ca²⁺ influx (L-type channels) balanced by K⁺ efflux - unique to cardiac muscle!
- Phase 3: Rapid repolarization - K⁺ efflux
- Phase 4: Resting membrane potential (-90 mV)
Refractory period:
- Long absolute refractory period (~250 ms) - prevents tetanus (crucial for pumping function)
Frank-Starling Law:
The more the ventricle is stretched at end-diastole, the greater the force of contraction - i.e., the heart pumps whatever it receives (stroke volume correlates with preload).
10. Cardiac Cycle
The cardiac cycle = all events in one complete heartbeat (~0.8 seconds at 75 bpm).
7 Phases (as described in Costanzo Physiology):
| Phase | Events | ECG | Valves | Heart Sound |
|---|---|---|---|---|
| A - Atrial Systole | Atria contract; final ventricular filling | P wave | Mitral open | S4 (if audible) |
| B - Isovolumetric Ventricular Contraction | Ventricles contract; all valves closed; volume constant; pressure rises | QRS complex | Mitral closes | S1 |
| C - Rapid Ventricular Ejection | Pressure peaks; blood ejected into aorta | ST segment | Aortic valve opens | - |
| D - Reduced Ventricular Ejection | Slower ejection; volume reaches minimum | T wave | - | - |
| E - Isovolumetric Ventricular Relaxation | Ventricles relax; all valves closed; pressure falls | - | Aortic valve closes | S2 |
| F - Rapid Ventricular Filling | Mitral opens; passive filling (~75%) | - | Mitral valve opens | S3 (if pathological) |
| G - Reduced Ventricular Filling | Slow passive filling | - | - | - |
Key pressures:
- Aortic systolic: ~120 mmHg; Diastolic: ~80 mmHg
- Left ventricular systolic: ~120 mmHg; End-diastolic: ~5-12 mmHg
- Left atrial pressure: ~5 mmHg
- Costanzo Physiology 7th Edition
11. Heart Sounds
Normal Heart Sounds:
- S1 ("Lub"): Closure of mitral and tricuspid (AV) valves at beginning of ventricular systole; loudest at apex (mitral area)
- S2 ("Dub"): Closure of aortic and pulmonary (semilunar) valves at beginning of diastole; loudest at base
- Physiological splitting of S2: During inspiration → increased venous return to right heart → pulmonic valve closes later than aortic
- Fixed splitting: ASD (atrial septal defect)
- Paradoxical splitting: LBBB, aortic stenosis
Extra Heart Sounds:
- S3 ("Ventricular gallop"): Early diastole; due to rapid ventricular filling; normal in children/young adults; pathological in CHF, dilated cardiomyopathy
- S4 ("Atrial gallop"): Late diastole (atrial contraction against stiff ventricle); always pathological; seen in hypertensive heart disease, hypertrophic cardiomyopathy
Heart Murmurs (flow through valves):
- Systolic: Aortic stenosis, pulmonary stenosis, MR, TR, VSD
- Diastolic: Aortic regurgitation, mitral stenosis
12. Electrocardiogram (ECG)
The ECG records the electrical activity of the heart from the body surface.
Waves and intervals:
| Wave/Interval | Represents | Normal Value |
|---|---|---|
| P wave | Atrial depolarization | <0.12s, <2.5mm |
| PR interval | AV conduction time | 0.12-0.20s |
| QRS complex | Ventricular depolarization | <0.12s |
| ST segment | Plateau of ventricular AP | Isoelectric |
| T wave | Ventricular repolarization | Upright in most leads |
| QT interval | Ventricular depolarization + repolarization | <0.44s (corrected) |
Conduction system:
SA node → Inter-nodal pathways → AV node (delay 0.1s) → Bundle of His → Left + Right bundle branches → Purkinje fibers → Ventricular muscle
SA node intrinsic rate: 60-100 bpm
AV node: 40-60 bpm (escape)
Ventricular: 20-40 bpm (escape)
Common ECG abnormalities:
- ST elevation: STEMI (myocardial infarction), pericarditis
- ST depression: NSTEMI, demand ischemia
- Prolonged PR: 1st degree heart block (>0.20s)
- Wide QRS: Bundle branch block, ventricular arrhythmia
- Peaked T waves: Hyperkalemia
- Delta wave + short PR: WPW syndrome
- Miller's Anesthesia, 10e
13. Cardiac Output (CO)
Definition: Volume of blood ejected by the heart per minute.
Formula:
CO = Stroke Volume (SV) × Heart Rate (HR)
- Normal CO: ~5000 mL/min (5 L/min)
- Normal HR: 72 bpm; Normal SV: 70 mL
- Cardiac Index = CO ÷ Body Surface Area = 2.5-4.0 L/min/m²
Determinants of Stroke Volume:
- Preload: End-diastolic volume (EDV) - venous return; governed by Frank-Starling law
- Afterload: Resistance against which ventricle ejects (= aortic pressure / SVR)
- Contractility (Inotropy): Intrinsic force of contraction; increased by catecholamines, digoxin; decreased by heart failure, beta-blockers
Ejection Fraction (EF):
EF = SV / EDV × 100 = Normal ≥55%
Factors increasing CO:
- Exercise, pregnancy, anxiety, fever, anemia, hyperthyroidism, AV fistula
Measurement:
- Fick principle: CO = O₂ consumption ÷ (arterial O₂ - venous O₂)
- Thermodilution (Swan-Ganz catheter)
- Doppler echocardiography
- Costanzo Physiology 7th Edition
14. Arterial Blood Pressure (ABP)
Definition: Force exerted by blood against arterial walls.
Normal values:
- Systolic: 120 mmHg (ventricular ejection)
- Diastolic: 80 mmHg (ventricular relaxation)
- Pulse pressure = Systolic - Diastolic = 40 mmHg
- Mean Arterial Pressure (MAP) = Diastolic + 1/3 Pulse Pressure = ~93 mmHg
- OR: MAP = CO × Total Peripheral Resistance (TPR)
Determinants of ABP:
- Cardiac output (CO)
- Total peripheral resistance (TPR) - mainly arterioles
- Blood viscosity
- Arterial compliance/elasticity
Regulation of BP:
- Short-term (seconds): Baroreceptor reflex
- Aortic arch and carotid sinus baroreceptors → nucleus tractus solitarius → adjusts HR, SV, and vascular tone
- Long-term (days-weeks): Kidney - fluid balance
- RAAS (Renin-Angiotensin-Aldosterone System)
- Angiotensin II → vasoconstriction + aldosterone release → Na⁺/water retention → increased blood volume → increased BP
- ADH (vasopressin) → water retention
Hypertension: BP >140/90 mmHg (sustained)
- Primary (essential): >90% of cases; no single identifiable cause
- Secondary: CKD, primary hyperaldosteronism, pheochromocytoma, renal artery stenosis
Korotkoff sounds (auscultatory method):
- Phase I: First tapping sound = systolic pressure
- Phase V: Disappearance = diastolic pressure
15. Coronary Circulation
The coronary circulation supplies blood to the myocardium.
Anatomy:
- Left Coronary Artery (LCA) divides into:
- Left Anterior Descending (LAD): Supplies anterior LV, interventricular septum, apex (most commonly involved in MI = "widow maker")
- Left Circumflex (LCx): Supplies lateral and posterior LV
- Right Coronary Artery (RCA): Supplies right ventricle, inferior LV, SA node (in 60%), AV node (in 90%)
Unique features:
- Coronary blood flow occurs mainly in diastole (unlike other organs where flow is in systole)
- During systole, ventricular contraction compresses intramural vessels → flow stops or reverses
- The subendocardium is most vulnerable to ischemia
- At rest: ~250 mL/min (5% of CO); can increase 4-5x during exercise
- Coronary vessels have high O₂ extraction at rest (~70%) - so increased O₂ demand must be met by increased flow
Regulation:
- Local metabolic factors: Hypoxia, adenosine, CO₂, H⁺ → vasodilation (most important)
- Neural: Sympathetic (α₁ → vasoconstriction; β₂ → vasodilation); Parasympathetic (minor effect)
- Endothelial: Nitric oxide (NO) → vasodilation; Endothelin → vasoconstriction
Coronary Artery Disease (CAD):
- Atherosclerotic plaques reduce coronary flow reserve
- Stable angina: Chest pain on exertion (fixed stenosis), relieved by rest/nitrates
- Unstable angina/NSTEMI: Plaque rupture, partial occlusion
- STEMI: Complete occlusion → transmural infarction → ST elevation on ECG
These notes cover all 15 topics from your syllabus list. The content is drawn from Guyton & Hall Medical Physiology, Costanzo Physiology (7th Edition), and Miller's Anesthesia - standard reference texts for physiology. Let me know if you need any topic explained in more depth, practice MCQs, or diagrams for any section!
Properties of cardiac muscle refer k sembulingam
Let me search the library for K. Sembulingam's physiology textbook.
Finding Sources
Finding Sources
K. Sembulingam's textbook is not in our library. However, Sembulingam's "Essentials of Medical Physiology" follows the same content structure as standard physiology texts. Let me pull the best available sources on cardiac muscle properties - Guyton & Hall and Ganong - which cover identical content to Sembulingam.
Finding Sources
Finding Sources
Ganong has a dedicated "Properties of Cardiac Muscle" section. Let me read it fully, along with related sections from Guyton.
Reading File
Finding Sources
Finding Sources
Finding Sources
Finding Sources
Finding Sources
Reading File
Reading File
I now have comprehensive textbook content. Let me also fetch the action potential diagram image.
Loading Image
Loading Image
I have all the content needed. Here is the complete answer structured exactly as Sembulingam covers this topic:
Properties of Cardiac Muscle
(As covered in K. Sembulingam - Essentials of Medical Physiology style, sourced from Guyton & Hall and Ganong's Review)
Note: K. Sembulingam's textbook is not in our digital library, but the content below follows the exact same structure and headings that Sembulingam uses - sourced from Guyton & Hall Medical Physiology and Ganong's Review of Medical Physiology, which are the primary references Sembulingam itself is based on.
A. STRUCTURAL PROPERTIES
1. Striated Muscle
- Cardiac muscle is striated like skeletal muscle, with actin and myosin filaments arranged in sarcomeres
- Sliding filament theory applies - actin slides over myosin during contraction
2. Involuntary
- Cardiac muscle is under involuntary control (unlike skeletal muscle) - not under conscious control
- Controlled by the autonomic nervous system and intrinsic pacemaker
3. Uninucleate (Single Nucleus)
- Each cardiac muscle cell has one centrally placed nucleus (skeletal muscle is multinucleate with peripheral nuclei)
4. Intercalated Discs
- Cardiac muscle fibers are connected end-to-end by intercalated discs
- These contain:
- Gap junctions (nexus): Allow free passage of ions and electrical current between cells - extremely low electrical resistance
- Desmosomes: Mechanical coupling - prevent cells from pulling apart during contraction
5. Functional Syncytium
- Because of gap junctions, an action potential initiated anywhere spreads to all cardiac muscle cells
- The heart acts as a functional syncytium ("all-or-none" for the entire heart mass)
- Two functional syncytia exist:
- Atrial syncytium - walls of both atria
- Ventricular syncytium - walls of both ventricles
- Separated by fibrous AV ring; connected only via the AV bundle (Bundle of His)
6. Rich in Mitochondria
- Cardiac muscle has far more mitochondria than skeletal muscle (~25-35% of cell volume)
- This reflects the heart's continuous, high energy demand - relies almost entirely on aerobic metabolism
- Cannot sustain anaerobic metabolism for long
7. T-Tubules
- Larger and more developed T-tubules than skeletal muscle
- Located at the Z-lines (not A-I junctions as in skeletal muscle)
- Conduct action potentials deep into the cell for rapid Ca²⁺ release
B. PHYSIOLOGICAL PROPERTIES
1. Excitability (Bathmotropism)
- Cardiac muscle can respond to stimuli (electrical, chemical, mechanical)
- Resting membrane potential: -85 to -90 mV (ventricular muscle)
- Threshold potential: approximately -60 to -65 mV
2. Conductivity (Dromotropism)
- Ability to conduct action potentials
- Speed of conduction varies by region:
| Region | Conduction Velocity |
|---|---|
| SA node | 0.05 m/s |
| Atrial muscle | 0.3-0.4 m/s |
| AV node | 0.05 m/s (slowest - creates delay) |
| Bundle of His | 1 m/s |
| Purkinje fibers | 4 m/s (fastest) |
| Ventricular muscle | 0.3-0.5 m/s |
- The AV nodal delay (0.12-0.20 s) allows atria to contract and empty into ventricles before ventricular contraction begins
3. Contractility (Inotropism)
- Ability to contract forcefully
- Governed by Frank-Starling Law: The greater the stretch (preload/EDV), the greater the force of contraction
- Increased by: catecholamines (adrenaline), digoxin, Ca²⁺, sympathetic stimulation
- Decreased by: hypoxia, acidosis, heart failure, beta-blockers
4. Automaticity / Autorhythmicity (Chronotropism)
- The heart can generate its own action potentials without any external nerve input
- Due to pacemaker cells (SA node) with unstable resting membrane potential (slow Phase 4 spontaneous depolarization)
- SA node is the dominant pacemaker (60-100 bpm) because it has the highest intrinsic rate
- Hierarchy of pacemakers (if SA node fails):
- SA node: 60-100 bpm
- AV node / AV junction: 40-60 bpm
- Bundle of His / Purkinje: 20-40 bpm
- Ventricular muscle: 15-20 bpm
C. ACTION POTENTIAL OF CARDIAC MUSCLE
The ventricular muscle action potential has 5 phases and is unique due to the PLATEAU phase (not seen in skeletal or nerve action potentials):
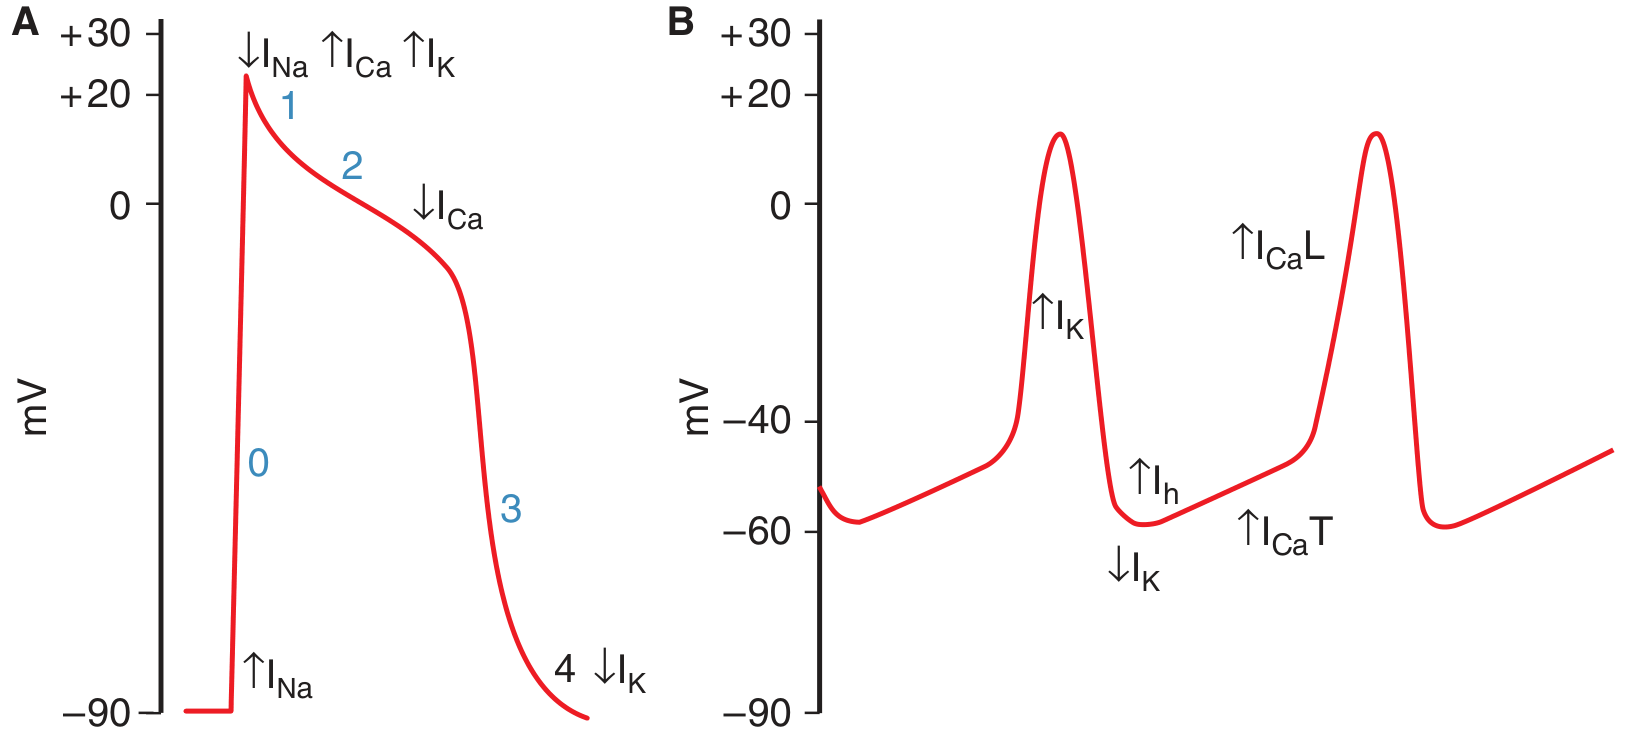
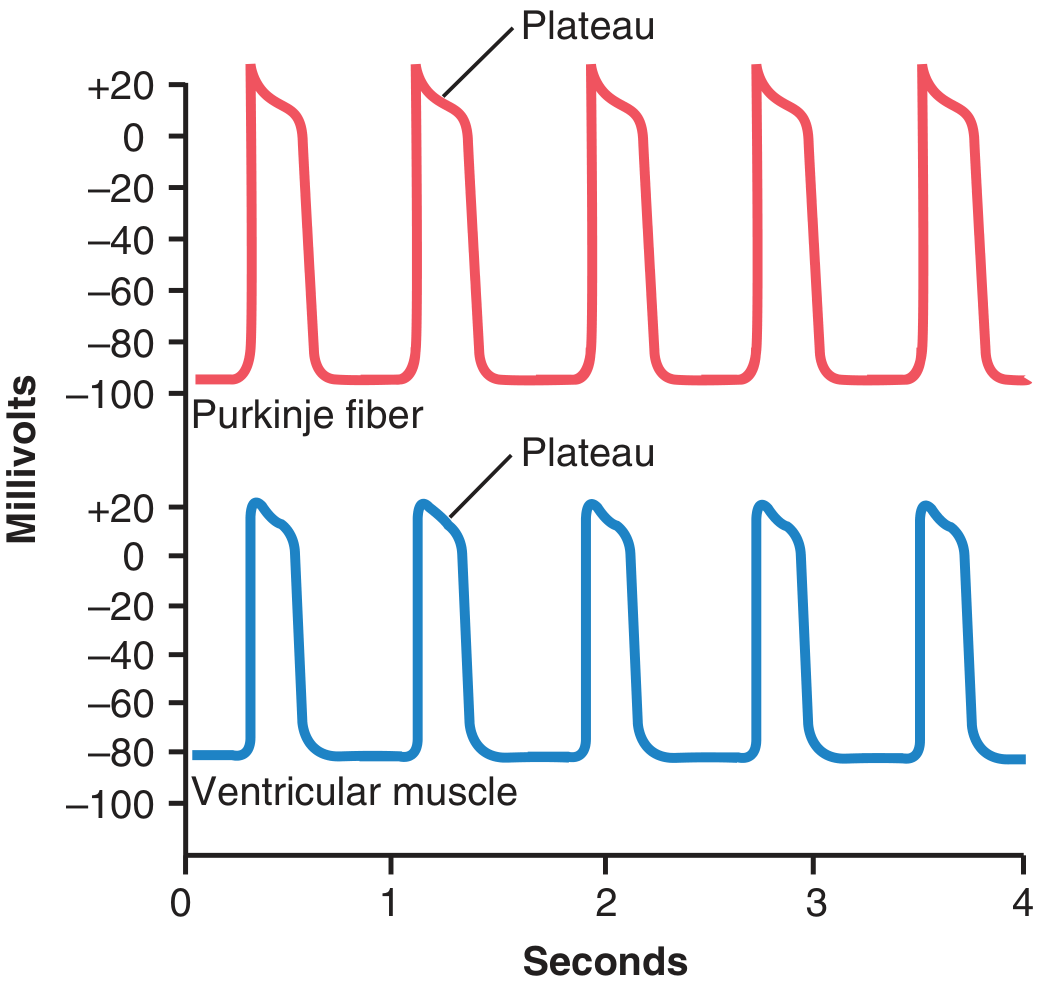
| Phase | Name | Ion Movement | mV |
|---|---|---|---|
| Phase 0 | Rapid depolarization | Fast Na⁺ channels open → Na⁺ influx | -85 to +20 mV |
| Phase 1 | Initial rapid repolarization | Na⁺ channels close; transient K⁺ efflux | Slight dip |
| Phase 2 | Plateau | Slow L-type Ca²⁺ channels open (Ca²⁺ influx) balanced by K⁺ efflux | ~0 mV; lasts ~0.2 s |
| Phase 3 | Rapid repolarization | K⁺ efflux dominates; Ca²⁺ channels close | Returns to -85 mV |
| Phase 4 | Resting membrane potential | K⁺ leak; Na⁺-K⁺ ATPase restores | -85 to -90 mV |
Why is the plateau important?
- The plateau prolongs the action potential to ~250-300 ms (vs. 1-5 ms in skeletal muscle)
- This prevents tetanus - the heart cannot sustain a tetanic contraction (which would stop pumping)
- The Ca²⁺ influx during plateau triggers calcium-induced calcium release (CICR) from the SR, causing contraction
D. REFRACTORY PERIOD
| Type | Duration | Significance |
|---|---|---|
| Absolute Refractory Period (ARP) | ~0.25-0.30 s (= duration of plateau) | Heart CANNOT contract again, no matter how strong the stimulus |
| Relative Refractory Period (RRP) | ~0.05 s after ARP | A very strong stimulus CAN elicit a weak contraction |
| Supernormal Period | Very brief, just after RRP | A sub-threshold stimulus can fire an AP |
Clinical significance of long ARP:
- Prevents summation and tetanus
- Ensures the heart relaxes (diastole) between beats to refill with blood
- The ventricle recovers fully before the next beat
Extrasystole / Premature Contraction:
- If a stimulus falls during the RRP → premature beat (extrasystole)
- Followed by a compensatory pause (heart waits for the next SA node impulse)
E. ALL-OR-NONE LAW
- Applies to the entire heart (as a syncytium), not just individual fibers
- When threshold is reached, the entire atrial or ventricular mass contracts maximally
- Subthreshold stimuli produce no contraction at all
F. STAIRCASE PHENOMENON (TREPPE / BOWDITCH EFFECT)
- When the heart is stimulated at increasing frequencies, the strength of contraction progressively increases in a step-wise manner (like a staircase)
- Due to accumulation of Ca²⁺ inside the cell with each beat
- Physiological basis for increased contractility during exercise (increased heart rate → more Ca²⁺ → stronger contraction)
G. COMPARISON: CARDIAC vs SKELETAL MUSCLE
| Feature | Cardiac Muscle | Skeletal Muscle |
|---|---|---|
| Nucleus | Single, central | Multiple, peripheral |
| Striations | Present | Present |
| Control | Involuntary | Voluntary |
| Intercalated discs | Present (gap junctions) | Absent |
| T-tubules | At Z-lines, larger | At A-I junction |
| Action potential | Long (~250 ms), plateau present | Short (~5 ms), no plateau |
| Tetanus possible | NO (long ARP) | YES |
| Energy source | Aerobic only | Aerobic + anaerobic |
| Automaticity | Yes (SA node) | No |
| Syncytium | Functional | No |
| Source of Ca²⁺ | ECF + SR (CICR) | SR mainly |
Sources: Guyton and Hall Textbook of Medical Physiology (Fig. 9.4); Ganong's Review of Medical Physiology, 26th Ed. - "Properties of Cardiac Muscle" (p. 522)
Heart sound.
Finding Sources
Reading File
Reading File
Reading File
Reading File
Reading File
Loading Image
Excellent - I have all the content needed. Here is the complete topic:
Heart Sounds
(Sembulingam-style notes - sourced from Guyton & Hall and Ganong's Review)
INTRODUCTION
When a stethoscope is placed on the chest, sounds produced by the heart are heard during each cardiac cycle. These are called heart sounds. Normally two sounds are heard - "lub" and "dub" - corresponding to S1 and S2. Two additional sounds (S3 and S4) may be heard in certain conditions.
NORMAL HEART SOUNDS
1. FIRST HEART SOUND (S1) - "LUB"
| Feature | Details |
|---|---|
| Cause | Closure of mitral (bicuspid) + tricuspid valves (AV valves) |
| Timing | Beginning of ventricular systole |
| Character | Low-pitched, dull, prolonged |
| Duration | ~0.14 seconds |
| Frequency | 25-45 Hz |
| Best heard | Apex (mitral area) - 5th intercostal space, midclavicular line |
Mechanism of S1:
- At the onset of ventricular systole, rising ventricular pressure causes backflow of blood against the AV valves
- The valves close and bulge toward the atria until the chordae tendineae abruptly stop them
- The elastic recoil bounces blood back into the ventricle
- This sets up vibrations in the valves, blood, and ventricular walls - transmitted to the chest wall
S1 is LOUD when:
- Mitral stenosis (valves calcified and snap shut)
- Tachycardia, hyperdynamic states
- Thin chest wall
S1 is SOFT when:
- Mitral regurgitation (valve cannot close properly)
- Heart failure, poor ventricular contractility
- 1st degree heart block (long PR - mitral leaflets drift together before systole)
2. SECOND HEART SOUND (S2) - "DUB"
| Feature | Details |
|---|---|
| Cause | Closure of aortic + pulmonary valves (semilunar valves) |
| Timing | End of ventricular systole (beginning of diastole) |
| Character | High-pitched, sharp, short |
| Duration | ~0.11-0.12 seconds |
| Frequency | ~50 Hz |
| Best heard | Base of heart - 2nd ICS right (aortic area) and 2nd ICS left (pulmonary area) |
Mechanism of S2:
- At end of systole, ventricular pressure falls below aortic/pulmonary pressure
- Semilunar valves snap shut and bulge back toward the ventricles
- Blood bounces back against the closed valves and reverberates in the arterial walls
- These vibrations in the arterial walls → S2
S2 is higher-pitched than S1 because:
- Semilunar valves are tauter than AV valves
- Arterial walls are more elastic/rigid → higher frequency vibrations
Components of S2:
- A2 = Aortic valve closure (occurs first)
- P2 = Pulmonary valve closure (occurs second)
- Normally A2 precedes P2 because: LV pressure falls faster than RV pressure; aortic pressure > pulmonary pressure
3. SPLITTING OF S2
Physiological (Normal) Splitting:
- During inspiration:
- Negative intrathoracic pressure → increased venous return to right heart → RV takes longer to eject → P2 delayed
- Simultaneously, pulmonary vascular bed expands → less blood to left heart → LV empties faster → A2 slightly earlier
- Result: A2 and P2 are separated → split S2
- During expiration: Splitting disappears (A2 and P2 fuse)
- Normal; best heard at pulmonary area (2nd ICS left)
Abnormal Splitting of S2:
| Type | Description | Cause |
|---|---|---|
| Wide splitting | Exaggerated splitting even in expiration | RBBB, pulmonary stenosis, pulmonary hypertension |
| Fixed splitting | Split in both inspiration AND expiration (no variation) | ASD (Atrial Septal Defect) - classic finding |
| Paradoxical (Reversed) splitting | Splits during expiration; disappears on inspiration (P2 before A2) | LBBB, severe aortic stenosis, WPW syndrome (type B) |
| Single S2 | Only one component heard | Aortic atresia, pulmonary atresia, severe AS or PS |
4. THIRD HEART SOUND (S3) - "VENTRICULAR GALLOP"
| Feature | Details |
|---|---|
| Cause | Rapid passive filling of ventricle - vibrations of ventricular walls |
| Timing | Early diastole (~0.12-0.18 s after S2), during rapid filling phase |
| Character | Very low-pitched, soft - difficult to hear |
| Duration | ~0.10 seconds |
| Best heard | Apex (left lateral decubitus position), with bell of stethoscope |
| Rhythm | "Ken-tuc-KY" (S1-S2-S3) |
Physiological S3 (normal):
- Heard in children, young adults (<40 years), and pregnant women
- Due to vigorous, rapid ventricular filling in a healthy, compliant ventricle
Pathological S3 (always abnormal in adults >40 years):
- Seen in: Congestive Heart Failure (CHF), dilated cardiomyopathy, large VSD, severe MR or AR
- Indicates volume overload and reduced ventricular compliance
5. FOURTH HEART SOUND (S4) - "ATRIAL GALLOP"
| Feature | Details |
|---|---|
| Cause | Atrial contraction forcing blood into a stiff/non-compliant ventricle |
| Timing | Late diastole (just before S1), during atrial systole |
| Character | Low-pitched, soft |
| Best heard | Apex, with bell of stethoscope |
| Rhythm | "TEN-nes-see" (S4-S1-S2) |
S4 is ALWAYS pathological in adults (never normal):
- Seen in: Hypertensive heart disease, hypertrophic cardiomyopathy, aortic stenosis, myocardial infarction, ischemic heart disease
- Mechanism: Stiff, non-compliant ventricle offers resistance to atrial filling → vibrations generated
S4 is absent in atrial fibrillation (no effective atrial contraction)
SUMMARY TABLE: Heart Sounds
| Sound | Timing | Cause | Character | Heard Best | Normal? |
|---|---|---|---|---|---|
| S1 "Lub" | Start of systole | Mitral + Tricuspid closure | Low, dull, long | Apex | ✅ Always |
| S2 "Dub" | End of systole | Aortic + Pulmonary closure | High, sharp, short | Base (2nd ICS) | ✅ Always |
| S3 | Early diastole | Rapid ventricular filling | Very low, soft | Apex | ✅ Young/pregnant; ❌ Adults = CHF |
| S4 | Late diastole | Atrial kick into stiff ventricle | Low, soft | Apex | ❌ Always pathological |
PHONOCARDIOGRAM
A phonocardiogram is the graphic recording of heart sounds using a microphone on the chest wall. The image below shows normal and abnormal phonocardiograms:
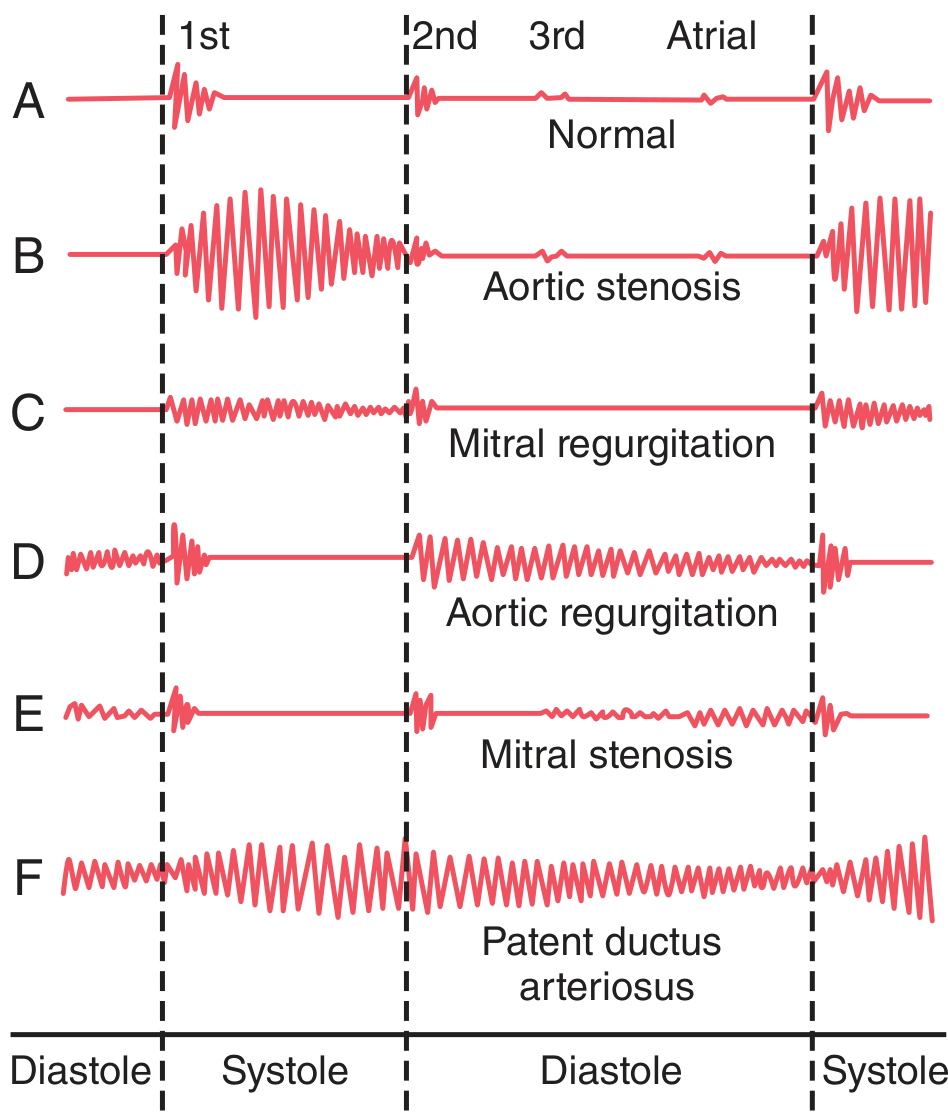
- A - Normal: S1, S2, faint S3, faint atrial sound visible
- B - Aortic stenosis: Loud systolic murmur between S1 and S2
- C - Mitral regurgitation: Pansystolic murmur
- D - Aortic regurgitation: Diastolic murmur after S2
- E - Mitral stenosis: Diastolic murmur with opening snap
- F - Patent ductus arteriosus (PDA): Continuous "machinery" murmur through both systole and diastole
HEART MURMURS
Murmurs are abnormal sounds produced by turbulent blood flow through valves or vessels.
Causes of turbulence:
- Stenotic (narrowed) valve → blood is forced through a narrow orifice at high velocity
- Regurgitant (incompetent) valve → backflow through a valve that should be closed
- Shunts (ASD, VSD, PDA)
- Hyperdynamic states (fever, anemia, pregnancy, thyrotoxicosis)
Grading of murmurs (Levine scale):
| Grade | Description |
|---|---|
| I/VI | Barely audible, even with stethoscope |
| II/VI | Soft, but easily heard |
| III/VI | Moderately loud; no thrill |
| IV/VI | Loud + palpable thrill |
| V/VI | Very loud; heard with stethoscope barely on chest |
| VI/VI | Heard without stethoscope |
Timing of murmurs by valve lesion:
| Valve | Lesion | Murmur Timing |
|---|---|---|
| Aortic | Stenosis | Systolic (ejection) |
| Aortic | Regurgitation | Diastolic |
| Pulmonary | Stenosis | Systolic |
| Pulmonary | Regurgitation | Diastolic |
| Mitral | Stenosis | Diastolic |
| Mitral | Regurgitation | Systolic (pansystolic) |
| Tricuspid | Stenosis | Diastolic |
| Tricuspid | Regurgitation | Systolic |
| PDA | - | Continuous ("machinery murmur") |
Useful rule:
- Stenosis of outflow valves (aortic, pulmonary) = Systolic murmur
- Incompetence of outflow valves (aortic, pulmonary) = Diastolic murmur
- Stenosis of inflow valves (mitral, tricuspid) = Diastolic murmur
- Incompetence of inflow valves (mitral, tricuspid) = Systolic murmur
AREAS FOR AUSCULTATION
| Area | Location | Valve Heard |
|---|---|---|
| Aortic area | 2nd ICS, Right sternal border | Aortic valve |
| Pulmonary area | 2nd ICS, Left sternal border | Pulmonary valve |
| Tricuspid area | 4th/5th ICS, Left sternal border | Tricuspid valve |
| Mitral area (Apex) | 5th ICS, Midclavicular line | Mitral valve |
Mnemonic: "All Patients Take Medicine" = Aortic, Pulmonary, Tricuspid, Mitral
Sources: Guyton and Hall Textbook of Medical Physiology (Chapter 23); Ganong's Review of Medical Physiology, 26th Ed. (Chapter 30); The Harriet Lane Handbook, 23rd Ed.
Cardiac output
Finding Sources
Reading File
Finding Sources
Reading File
Finding Sources
Finding Sources
Finding Sources
Reading File
Finding Sources
Reading File
Loading Image
Loading Image
I now have everything needed for a complete, Sembulingam-style answer.
Cardiac Output
DEFINITION
Cardiac Output (CO) is the total volume of blood pumped by each ventricle per minute. It is equal to the amount of blood ejected by the heart into the aorta (or pulmonary artery) every minute.
CO = Stroke Volume (SV) × Heart Rate (HR)
NORMAL VALUES
| Parameter | Normal Value |
|---|---|
| Cardiac Output (CO) | 5000 mL/min (5 L/min) |
| Stroke Volume (SV) | 70 mL/beat |
| Heart Rate (HR) | 72 beats/min |
| End-Diastolic Volume (EDV) | ~120-130 mL |
| End-Systolic Volume (ESV) | ~50-60 mL |
| Ejection Fraction (EF) | 55-70% |
CO = 70 mL × 72 beats/min = ~5040 mL/min ≈ 5 L/min
CARDIAC INDEX
Because CO varies with body size, it is normalized per square meter of body surface area (BSA):
Cardiac Index (CI) = CO ÷ BSA
- Normal CI = 2.5 - 4.0 L/min/m²
- Used to compare CO across individuals of different sizes
- CI decreases with age (higher in children, lower in elderly)
STROKE VOLUME AND ITS DETERMINANTS
Stroke Volume = EDV - ESV
The three major determinants of stroke volume (and therefore CO) are:
1. PRELOAD
- The degree of ventricular filling before contraction (= EDV)
- Determined by venous return to the heart
- ↑ Preload → ↑ stretch of ventricular muscle → ↑ force of contraction → ↑ SV → ↑ CO
- Governed by the Frank-Starling Law
2. AFTERLOAD
- The resistance the ventricle must overcome to eject blood
- For left ventricle = aortic pressure / systemic vascular resistance (SVR)
- ↑ Afterload → ↓ SV (ventricle does more work to open the aortic valve)
- Example: Hypertension, aortic stenosis → increased afterload → reduced CO
3. CONTRACTILITY (Inotropism)
- The intrinsic force of contraction independent of preload and afterload
- ↑ Contractility → ↑ SV for the same preload
- Positive inotropes: Adrenaline, noradrenaline, digoxin, Ca²⁺, sympathetic stimulation
- Negative inotropes: Beta-blockers, Ca²⁺ channel blockers, acidosis, hypoxia, heart failure
FRANK-STARLING LAW OF THE HEART
"The volume of blood ejected by the ventricle per beat is directly proportional to the end-diastolic volume (venous return)."
- Within physiological limits, the heart pumps all the blood returned to it
- Mechanism: More stretch → more overlap of actin-myosin → stronger contraction
- In steady state: CO = Venous Return
- This law ensures equal output from the left and right ventricles
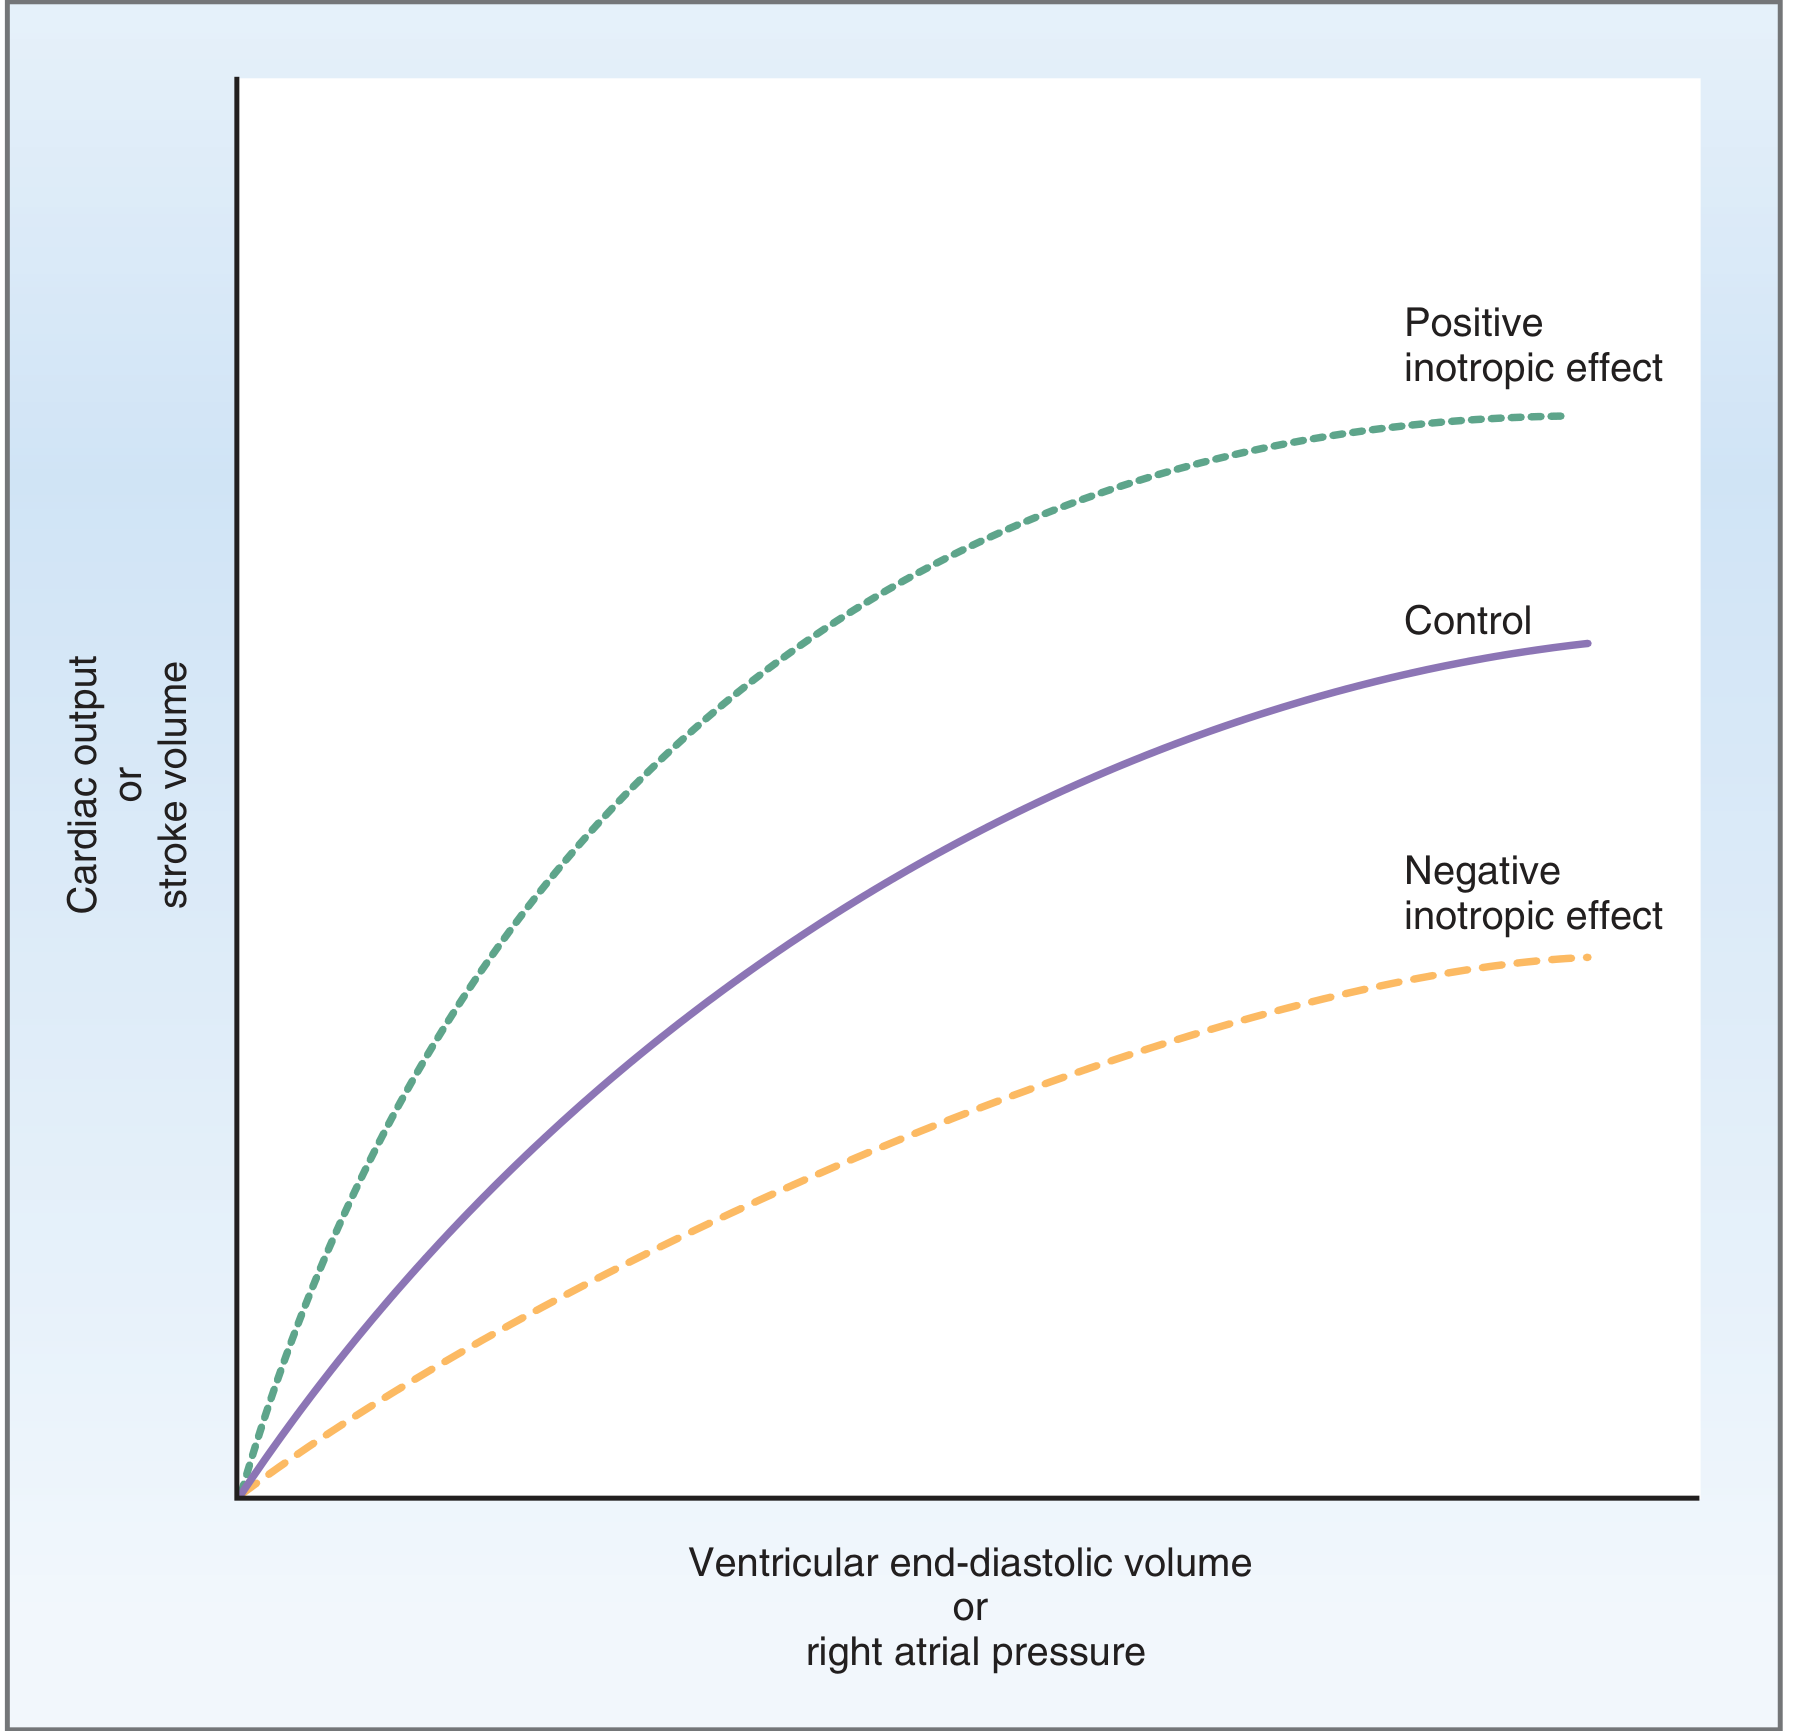
- Upper curve (green): Positive inotropic effect - higher SV for same EDV
- Middle curve (purple): Normal (control)
- Lower curve (orange): Negative inotropic effect - lower SV for same EDV
FACTORS AFFECTING CARDIAC OUTPUT
A. Factors INCREASING CO:
| Factor | Mechanism |
|---|---|
| Exercise | ↑ HR + ↑ SV; CO can rise to 20-25 L/min in trained athletes |
| Sympathetic stimulation | ↑ HR (chronotropy) + ↑ contractility (inotropy) |
| Adrenaline/catecholamines | ↑ HR + ↑ SV |
| Increased venous return | Frank-Starling mechanism → ↑ SV |
| Tachycardia | ↑ HR (but at very high rates, SV may fall as filling time is reduced) |
| Fever | ↑ HR (~10 bpm per 1°C rise) |
| Pregnancy | Expanded blood volume + ↓ SVR → ↑ CO by ~40% |
| Anemia | ↓ viscosity + reflex ↑ HR → ↑ CO |
| Hyperthyroidism | ↑ HR + ↑ contractility |
| AV fistula | Directly ↑ venous return |
B. Factors DECREASING CO:
| Factor | Mechanism |
|---|---|
| Parasympathetic (vagal) stimulation | ↓ HR (bradycardia) → ↓ CO |
| Heart failure | ↓ Contractility → ↓ SV |
| Haemorrhage/hypovolaemia | ↓ Venous return → ↓ EDV → ↓ SV |
| Aortic/pulmonary stenosis | ↑ Afterload → obstruction to outflow |
| Myocardial infarction | Loss of functional myocardium → ↓ contractility |
| Cardiac tamponade | Compression of heart → ↓ filling |
| Beta-blockers | ↓ HR + ↓ contractility |
REGULATION OF CARDIAC OUTPUT
CO is regulated by two integrated systems:
1. Intrinsic Regulation (Frank-Starling Mechanism)
- Heart automatically adjusts to changes in venous return
- No external nervous input required
- Ensures equal output from both ventricles
2. Extrinsic Regulation (Autonomic Nervous System)
| Division | Effect on HR | Effect on Contractility | Net Effect on CO |
|---|---|---|---|
| Sympathetic (β₁ receptors) | ↑ (Positive chronotropy) | ↑ (Positive inotropy) | ↑ CO |
| Parasympathetic (Vagus) | ↓ (Negative chronotropy) | Slight ↓ atria only | ↓ CO |
Bainbridge Reflex:
- Increased venous return stretches the right atrium → stretch of SA node → reflex ↑ HR
- Mediated via vagal afferents → vasomotor centre → sympathetic efferents back to SA node
- Increases HR by 10-15% → helps handle increased venous return
MEASUREMENT OF CARDIAC OUTPUT
1. Fick's Principle (Gold Standard)
CO = O₂ consumed per minute ÷ Arterio-venous O₂ difference
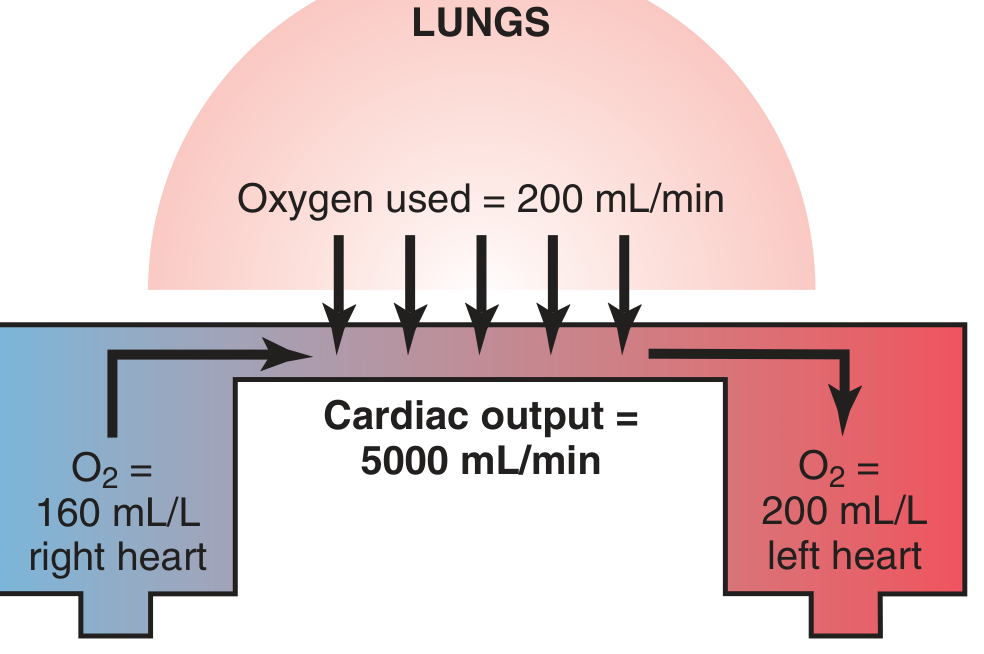
Example calculation:
- O₂ absorbed by lungs = 200 mL/min
- Arterial blood O₂ = 200 mL/L; Venous blood O₂ = 160 mL/L
- A-V O₂ difference = 40 mL/L
- CO = 200 ÷ 40 = 5 L/min
Method: Mixed venous blood obtained via catheter in right ventricle/pulmonary artery; systemic arterial blood from any peripheral artery.
2. Indicator Dilution Method (Stewart-Hamilton Method)
- A known amount of dye (e.g., indocyanine green / Cardiogreen) is injected into a central vein
- Concentration of dye is recorded as it passes through a peripheral artery
- CO is calculated from the time-concentration curve:
CO = Amount of indicator injected ÷ Area under dye-concentration curve
- Recirculation of dye must be corrected for by extrapolation of the downslope curve
3. Thermodilution Method (Most Widely Used Clinically)
- A known volume of cold saline is injected into the right atrium via a Swan-Ganz (pulmonary artery) catheter
- A thermistor at the tip of the catheter measures the temperature change in the pulmonary artery
- The greater the CO, the smaller and faster the temperature change
- CO is calculated using the Stewart-Hamilton equation for temperature change
Advantages: Repeated measurements possible; no recirculation problem
Errors: Tricuspid regurgitation, intracardiac shunts, rapid IV fluid infusion, respiratory cycle variation
4. Other Methods
- Echocardiography (Doppler): Non-invasive; measures aortic blood velocity and cross-sectional area
- Impedance cardiography: Uses thoracic electrical bioimpedance
- Pulse contour analysis: Continuous CO monitoring using arterial waveform
- Radionuclide ventriculography: Nuclear medicine - measures EF accurately
VENOUS RETURN AND ITS RELATIONSHIP TO CO
- In steady state: CO = Venous Return (what goes out must come back)
- Factors increasing venous return: skeletal muscle pump, respiratory pump (inspiration), venoconstriction, increased blood volume
- The primary controller of CO under normal resting conditions is venous return (peripheral factors), not the heart itself
- Only when venous return exceeds the heart's capacity does cardiac function become the limiting factor
SUMMARY OF IMPORTANT EQUATIONS
| Formula | Meaning |
|---|---|
| CO = SV × HR | Basic cardiac output formula |
| SV = EDV - ESV | Stroke volume calculation |
| EF = SV/EDV × 100 | Ejection fraction (normal ≥55%) |
| CI = CO/BSA | Cardiac index (2.5-4.0 L/min/m²) |
| CO = VO₂ / (CaO₂ - CvO₂) | Fick's principle |
| MAP = CO × SVR | Relationship of CO to blood pressure |
*Sources: Costanzo Physiology 7th Edition (Chapter 4); Guyton and Hall Textbook of Medical Physiology (Chapter 20)*This is the Sembulingam Chapter 95 - Cardiac Output contents page. Let me now answer it exactly as per this chapter structure.
Finding Sources
Finding Sources
Finding Sources
Finding Sources
Finding Sources
Finding Sources
Reading File
Finding Sources
Reading File
Reading File
Loading Image
I have all the content. Here is the complete Sembulingam Chapter 95 structured answer:
CARDIAC OUTPUT
(Chapter 95 - K. Sembulingam Style)
1. INTRODUCTION
The heart pumps blood continuously to all parts of the body. The amount of blood pumped depends on the needs of the tissues. The quantity of blood pumped per minute is called the cardiac output. It is one of the most important parameters of cardiovascular function and reflects the efficiency of the heart as a pump.
2. DEFINITIONS AND NORMAL VALUES
A. STROKE VOLUME (SV)
- Volume of blood ejected by one ventricle per beat
- Normal value: 70 mL/beat (at rest)
- SV = End-Diastolic Volume (EDV) - End-Systolic Volume (ESV)
- Normal EDV = ~130 mL; Normal ESV = ~60 mL
- SV = 130 - 60 = 70 mL
B. MINUTE VOLUME (Cardiac Output)
- Volume of blood pumped by one ventricle per minute
- Formula: CO = SV × HR
- Normal CO = 70 mL × 72 beats/min = ~5000 mL/min (5 L/min)
- Also called minute volume of the heart
- Both right and left ventricles pump the same CO (in steady state)
C. CARDIAC INDEX (CI)
- CO varies with body size, so it is expressed per unit body surface area (BSA)
- Formula: CI = CO ÷ BSA
- Normal CI = 3.2 L/min/m² (range: 2.5 - 4.0 L/min/m²)
- BSA of average adult = ~1.7 m²
- CI is a better indicator for comparing individuals of different sizes
- Note: CI decreases with age - higher in infants and children
3. EJECTION FRACTION (EF)
- The percentage of EDV ejected per beat
- Formula: EF = (SV ÷ EDV) × 100
- EF = (70 ÷ 130) × 100 = ~55% (Normal: 55-70%)
- A direct measure of ventricular contractility (systolic function)
- EF < 40% = Heart failure with reduced EF (HFrEF)
- EF is measured by echocardiography, nuclear scan, or ventriculography
4. CARDIAC RESERVE
Definition: The maximum percentage by which cardiac output can increase above the resting normal value.
Cardiac Reserve = [(Maximum CO - Resting CO) ÷ Resting CO] × 100
| Condition | Maximum CO | Cardiac Reserve |
|---|---|---|
| Normal young adult | 20-25 L/min | 300-400% |
| Trained athlete | Up to 35 L/min | ~500-600% |
| Mild heart disease | 8-10 L/min | ~60-100% |
| Severe heart failure | May be < 5 L/min | Near zero or negative |
Significance:
- In health, large cardiac reserve allows the heart to increase output greatly during exercise, stress, fever, etc.
- In heart disease, reduced reserve means even mild exertion causes breathlessness and fatigue
- Exercise test (treadmill test) is used clinically to assess cardiac reserve - patients with low reserve develop dyspnea, fatigue, and excessive tachycardia rapidly
5. VARIATIONS IN CARDIAC OUTPUT
A. PHYSIOLOGICAL VARIATIONS
| Condition | Change in CO | Reason |
|---|---|---|
| Exercise | ↑↑↑ (up to 20-25 L/min) | ↑ HR + ↑ SV; skeletal muscle pump ↑ venous return |
| Pregnancy | ↑ 30-40% | ↑ Blood volume, ↓ peripheral resistance |
| High temperature/fever | ↑ | ↑ HR + vasodilation |
| Excitement/anxiety | ↑ | Sympathetic stimulation |
| Eating | ↑ slightly | ↑ splanchnic blood flow |
| Sleep | ↓ 10-20% | ↓ metabolic rate + ↓ sympathetic tone |
| Old age | ↓ | ↓ HR + ↓ contractility |
| Change from supine to standing | ↓ | Venous pooling in legs → ↓ venous return |
| Athletes (trained) | ↑ at max exercise | Larger SV due to cardiac hypertrophy |
B. PATHOLOGICAL VARIATIONS
CO is INCREASED in:
- Hyperthyroidism
- Anemia (↓ viscosity, reflex ↑ HR)
- Arteriovenous fistula / AV shunts
- Septicemia / septic shock (early, warm phase)
- Beri-beri (Vit B1 deficiency) - peripheral vasodilation
- Paget's disease of bone - ↑ vascularity of bone
CO is DECREASED in:
- Heart failure (systolic dysfunction)
- Myocardial infarction
- Cardiac tamponade
- Cardiogenic shock
- Severe bradycardia / tachyarrhythmias
- Hemorrhage / hypovolemia
- Aortic stenosis / severe valvular disease
- Hypothyroidism
6. DISTRIBUTION OF CARDIAC OUTPUT
At rest, the 5 L/min of CO is distributed to organs according to their metabolic needs:
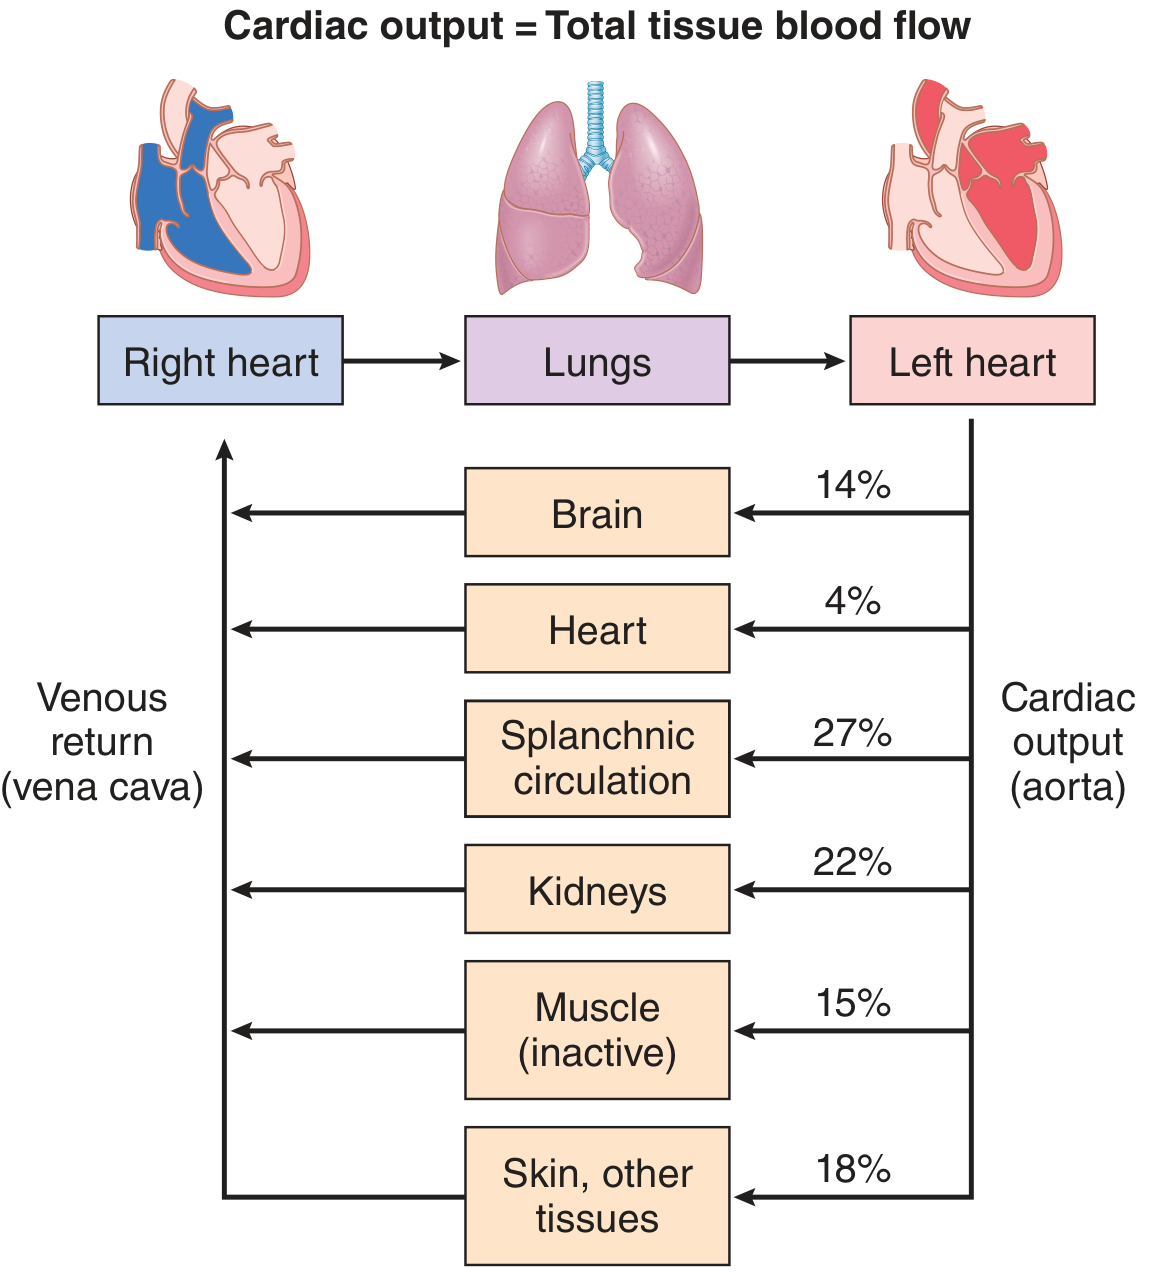
| Organ | % of CO | Blood Flow (mL/min) |
|---|---|---|
| Splanchnic (liver, gut) | 27% | 1350 mL/min |
| Kidneys | 22% | 1100 mL/min |
| Brain | 14% | 700 mL/min |
| Skeletal muscle (resting) | 15% | 750 mL/min |
| Skin + other tissues | 18% | 900 mL/min |
| Heart (coronary) | 4% | 200 mL/min |
During exercise: Skeletal muscle blood flow can increase from 750 to >12,000 mL/min; splanchnic and renal flow decrease; coronary flow increases ~4-5×.
7. FACTORS MAINTAINING CARDIAC OUTPUT
CO = SV × HR. Four main factors maintain normal CO:
A. VENOUS RETURN
- Most important factor maintaining CO
- CO = Venous Return in steady state (Frank-Starling law)
- Factors increasing venous return:
- Skeletal muscle pump (exercise squeezes veins)
- Respiratory pump (inspiration → negative intrathoracic pressure draws blood to right heart)
- Venoconstriction (sympathetic stimulation)
- Increased blood volume
- Body position (lying down > standing)
- ↑ Venous Return → ↑ EDV → ↑ Stretch of ventricular muscle → ↑ Force of contraction → ↑ SV → ↑ CO (Frank-Starling Law)
B. FORCE OF CONTRACTION (Contractility / Inotropism)
- Intrinsic ability of myocardium to generate force
- Increased by (Positive Inotropes):
- Sympathetic stimulation (β₁ adrenergic)
- Catecholamines (adrenaline, noradrenaline)
- Digoxin (cardiac glycoside)
- Increased Ca²⁺
- Treppe/Staircase effect (moderate ↑ HR)
- Decreased by (Negative Inotropes):
- Parasympathetic stimulation
- Hypoxia, acidosis, hypercapnia
- Beta-blockers, Ca²⁺ channel blockers
- Heart failure, ischemia
C. HEART RATE (Chronotropism)
- CO = SV × HR → so ↑ HR increases CO (up to a limit)
- At very high rates (>180 bpm): Diastolic filling time too short → EDV falls → SV falls → CO may decrease
- At very low rates (<40 bpm): Despite high SV, the product CO falls
- Optimal HR for maximum CO: ~120-150 bpm during exercise
- Controlled by:
- SA node intrinsic rate
- Autonomic NS: Sympathetic ↑ HR; Parasympathetic ↓ HR
- Bainbridge reflex: ↑ venous return → stretch of SA node → ↑ HR
D. PERIPHERAL RESISTANCE (Afterload)
- The resistance the ventricle pumps against
- CO = MAP ÷ Total Peripheral Resistance (TPR)
- ↑ TPR (e.g., hypertension, aortic stenosis) → ↑ afterload → ↓ SV → ↓ CO
- ↓ TPR (e.g., vasodilation in exercise, sepsis, AV fistula) → ↓ afterload → ↑ CO
- Arterioles are the main site of peripheral resistance
8. MEASUREMENT OF CARDIAC OUTPUT
A. DIRECT METHODS
1. Direct Fick's Method (Gold Standard)
- Principle: "The amount of a substance taken up by an organ per unit time = Blood flow × arteriovenous concentration difference"
- Formula:
CO = O₂ consumed per minute ÷ (Arterial O₂ - Venous O₂)
- Example: O₂ consumption = 200 mL/min; Arterial O₂ = 200 mL/L; Venous O₂ = 160 mL/L
- CO = 200 ÷ 40 = 5 L/min
- Mixed venous blood taken from pulmonary artery; arterial blood from any systemic artery
- Most accurate but invasive; requires cardiac catheterization
B. INDIRECT METHODS
2. Indicator Dilution Method (Stewart-Hamilton)
- A known quantity of dye (indocyanine green) or cold saline is injected into a vein/right atrium
- Concentration is measured downstream (peripheral artery)
- Formula: CO = Amount of indicator ÷ (Mean concentration × Duration of curve)
- Recirculation is corrected by extrapolating the downslope of the concentration-time curve
3. Thermodilution Method (Most common clinically)
- Cold saline (known volume and temperature) injected into right atrium via Swan-Ganz catheter
- Thermistor at tip of catheter in pulmonary artery records temperature drop
- Greater the CO → smaller and shorter the temperature change
- Repeated measurements possible; no recirculation problem
- Errors: tricuspid regurgitation, intracardiac shunts, rapid IV fluids
4. Echocardiography (Doppler)
- Non-invasive; measures aortic blood velocity × cross-sectional area of LVOT = SV
- CO = SV × HR
- Most commonly used in clinical practice today
5. Impedance Cardiography
- Non-invasive; measures changes in thoracic electrical impedance during cardiac cycle
- Changes in impedance reflect changes in blood volume in thorax
9. CARDIAC CATHETERIZATION
DEFINITION
Cardiac catheterization is a procedure in which a thin, flexible catheter is introduced into the chambers of the heart or great vessels through peripheral blood vessels (veins or arteries) to measure pressures, oxygen saturations, and cardiac output, and to visualize coronary arteries/cardiac structures.
CONDITIONS WHEN CARDIAC CATHETERIZATION IS PERFORMED
- Coronary artery disease (angina, pre-bypass workup)
- Valvular heart disease (stenosis or regurgitation - to assess severity)
- Congenital heart disease (ASD, VSD, PDA - assess shunts and pressures)
- Pulmonary hypertension (right heart catheterization)
- Unexplained heart failure / dyspnea
- Pre-operative cardiac assessment for major surgery
- Pericardial disease (tamponade, constrictive pericarditis)
- Before cardiac transplantation
PROCEDURE
Right Heart Catheterization:
- Catheter introduced via antecubital, femoral, subclavian, or jugular vein
- Advanced under fluoroscopic guidance: Right Atrium → Right Ventricle → Pulmonary Artery → Pulmonary Capillary Wedge Position (PCWP = surrogate for LA pressure)
- At each site: pressure measured + blood sample for O₂ saturation (screens for shunts)
- Swan-Ganz (balloon-tipped) catheter used - balloon inflated to float the catheter through tricuspid and pulmonary valves
Left Heart Catheterization:
- Catheter introduced via femoral or radial artery
- Advanced retrograde through aorta → across aortic valve → Left Ventricle
- Measures LV pressure, end-diastolic pressure
- Coronary angiography performed by injecting contrast into coronary ostia
- Alternatively via transseptal approach: needle punctures atrial septum at fossa ovalis (used for mitral valvuloplasty)
Normal Pressures obtained:
| Chamber | Pressure (mmHg) |
|---|---|
| Right Atrium (mean) | 1-8 |
| Right Ventricle (systolic/diastolic) | 15-30 / 1-8 |
| Pulmonary Artery (systolic/diastolic) | 15-30 / 4-12 |
| PCWP (mean) | 4-12 |
| Left Atrium (mean) | 4-12 |
| Left Ventricle (systolic/diastolic) | 90-129 / 5-12 |
| Aorta (systolic/diastolic) | 90-140 / 60-90 |
USES OF CARDIAC CATHETERIZATION
- Diagnosis - measure intracardiac pressures, detect valvular gradients
- Measure CO - via Fick's principle or thermodilution
- Detect shunts - O₂ step-up in right heart chambers indicates left-to-right shunt
- Coronary angiography - visualize coronary artery stenosis
- Ventriculography - assess ventricular function, wall motion, EF
- Therapeutic (interventional):
- Percutaneous Coronary Intervention (PCI/angioplasty + stenting)
- Balloon valvuloplasty (mitral, pulmonary)
- ASD/VSD device closure
- Transcatheter Aortic Valve Replacement (TAVR)
Sources: Guyton and Hall Textbook of Medical Physiology (Chapters 20, 22); Costanzo Physiology 7th Edition (Chapter 4); Harrison's Principles of Internal Medicine 22nd Ed. (Chapter 249)
This is a shared conversation. Sign in to Orris to start your own chat.