
Imaging in cardiomyopathies for nd radiology theory exam
Reading File
Now let me search the library in parallel for cardiomyopathy imaging content.
Finding Sources
Finding Sources
Excellent - I found the key radiology textbook (Grainger & Allison's) and Braunwald's. Let me read the dedicated cardiomyopathy imaging sections from those books in parallel.
Reading File
Finding Sources
Great content. Let me read more of this Grainger & Allison chapter which covers cardiomyopathy imaging comprehensively.
Reading File
Finding Sources
Excellent - very rich content. Let me read more pages and also fetch the key images.
Reading File
Loading Image
Now let me fetch more key images and read the ARVC/dilated sections.
Reading File
Loading Image
I now have rich content covering HCM, DCM, RCM, myocarditis, and Takotsubo. I have enough material to compile a comprehensive exam-oriented answer. Let me also quickly fetch a couple more key images (HCM MRI and ARVC) from what was mentioned in the text.
Loading Image
Reading File
I now have comprehensive content. Let me fetch a couple more critical images (HCM MRI, DCM MRI, ARVC) and compile the full answer.
Loading Image
Loading Image
I now have all the material needed. Let me compile the comprehensive exam answer.
Imaging in Cardiomyopathies
Source: Grainger & Allison's Diagnostic Radiology, Braunwald's Heart Disease
Classification Overview
Cardiomyopathies are classified by phenotype (ESC approach) into:
| Phenotype | Main Types |
|---|---|
| Hypertrophic | HCM, Fabry disease, amyloidosis, athlete's heart |
| Dilated | DCM (ischaemic vs non-ischaemic), myocarditis |
| Restrictive | Amyloidosis, sarcoidosis, haemochromatosis, endomyocardial fibrosis |
| Arrhythmogenic | ARVC/ARVD |
| Unclassified | Takotsubo, LVNC (non-compaction) |
Imaging Modalities: Role Summary
| Modality | Key Roles |
|---|---|
| Chest X-ray | First-line; shows cardiomegaly, pulmonary congestion |
| Echocardiography | Workhorse; structure, function, wall thickness, Doppler |
| Cardiac MRI (CMR) | Gold standard for tissue characterisation; LGE fibrosis mapping |
| Cardiac CT | Wall thickness, coronary anatomy (rule out ischaemia), ARVC |
| Nuclear (MUGA/PET) | LV function, amyloid (pyrophosphate scan) |
1. Hypertrophic Cardiomyopathy (HCM)
Definition: Autosomal dominant sarcomere disease; septal thickness >15 mm in a non-dilated LV, unexplained by other causes.
Chest X-ray
- Often unhelpful in early disease
- Concentric hypertrophy may produce a rounded third left cardiac contour (different from aortic stenosis/hypertension which cause similar but distinguishable appearance)
Echocardiography (Primary Modality)
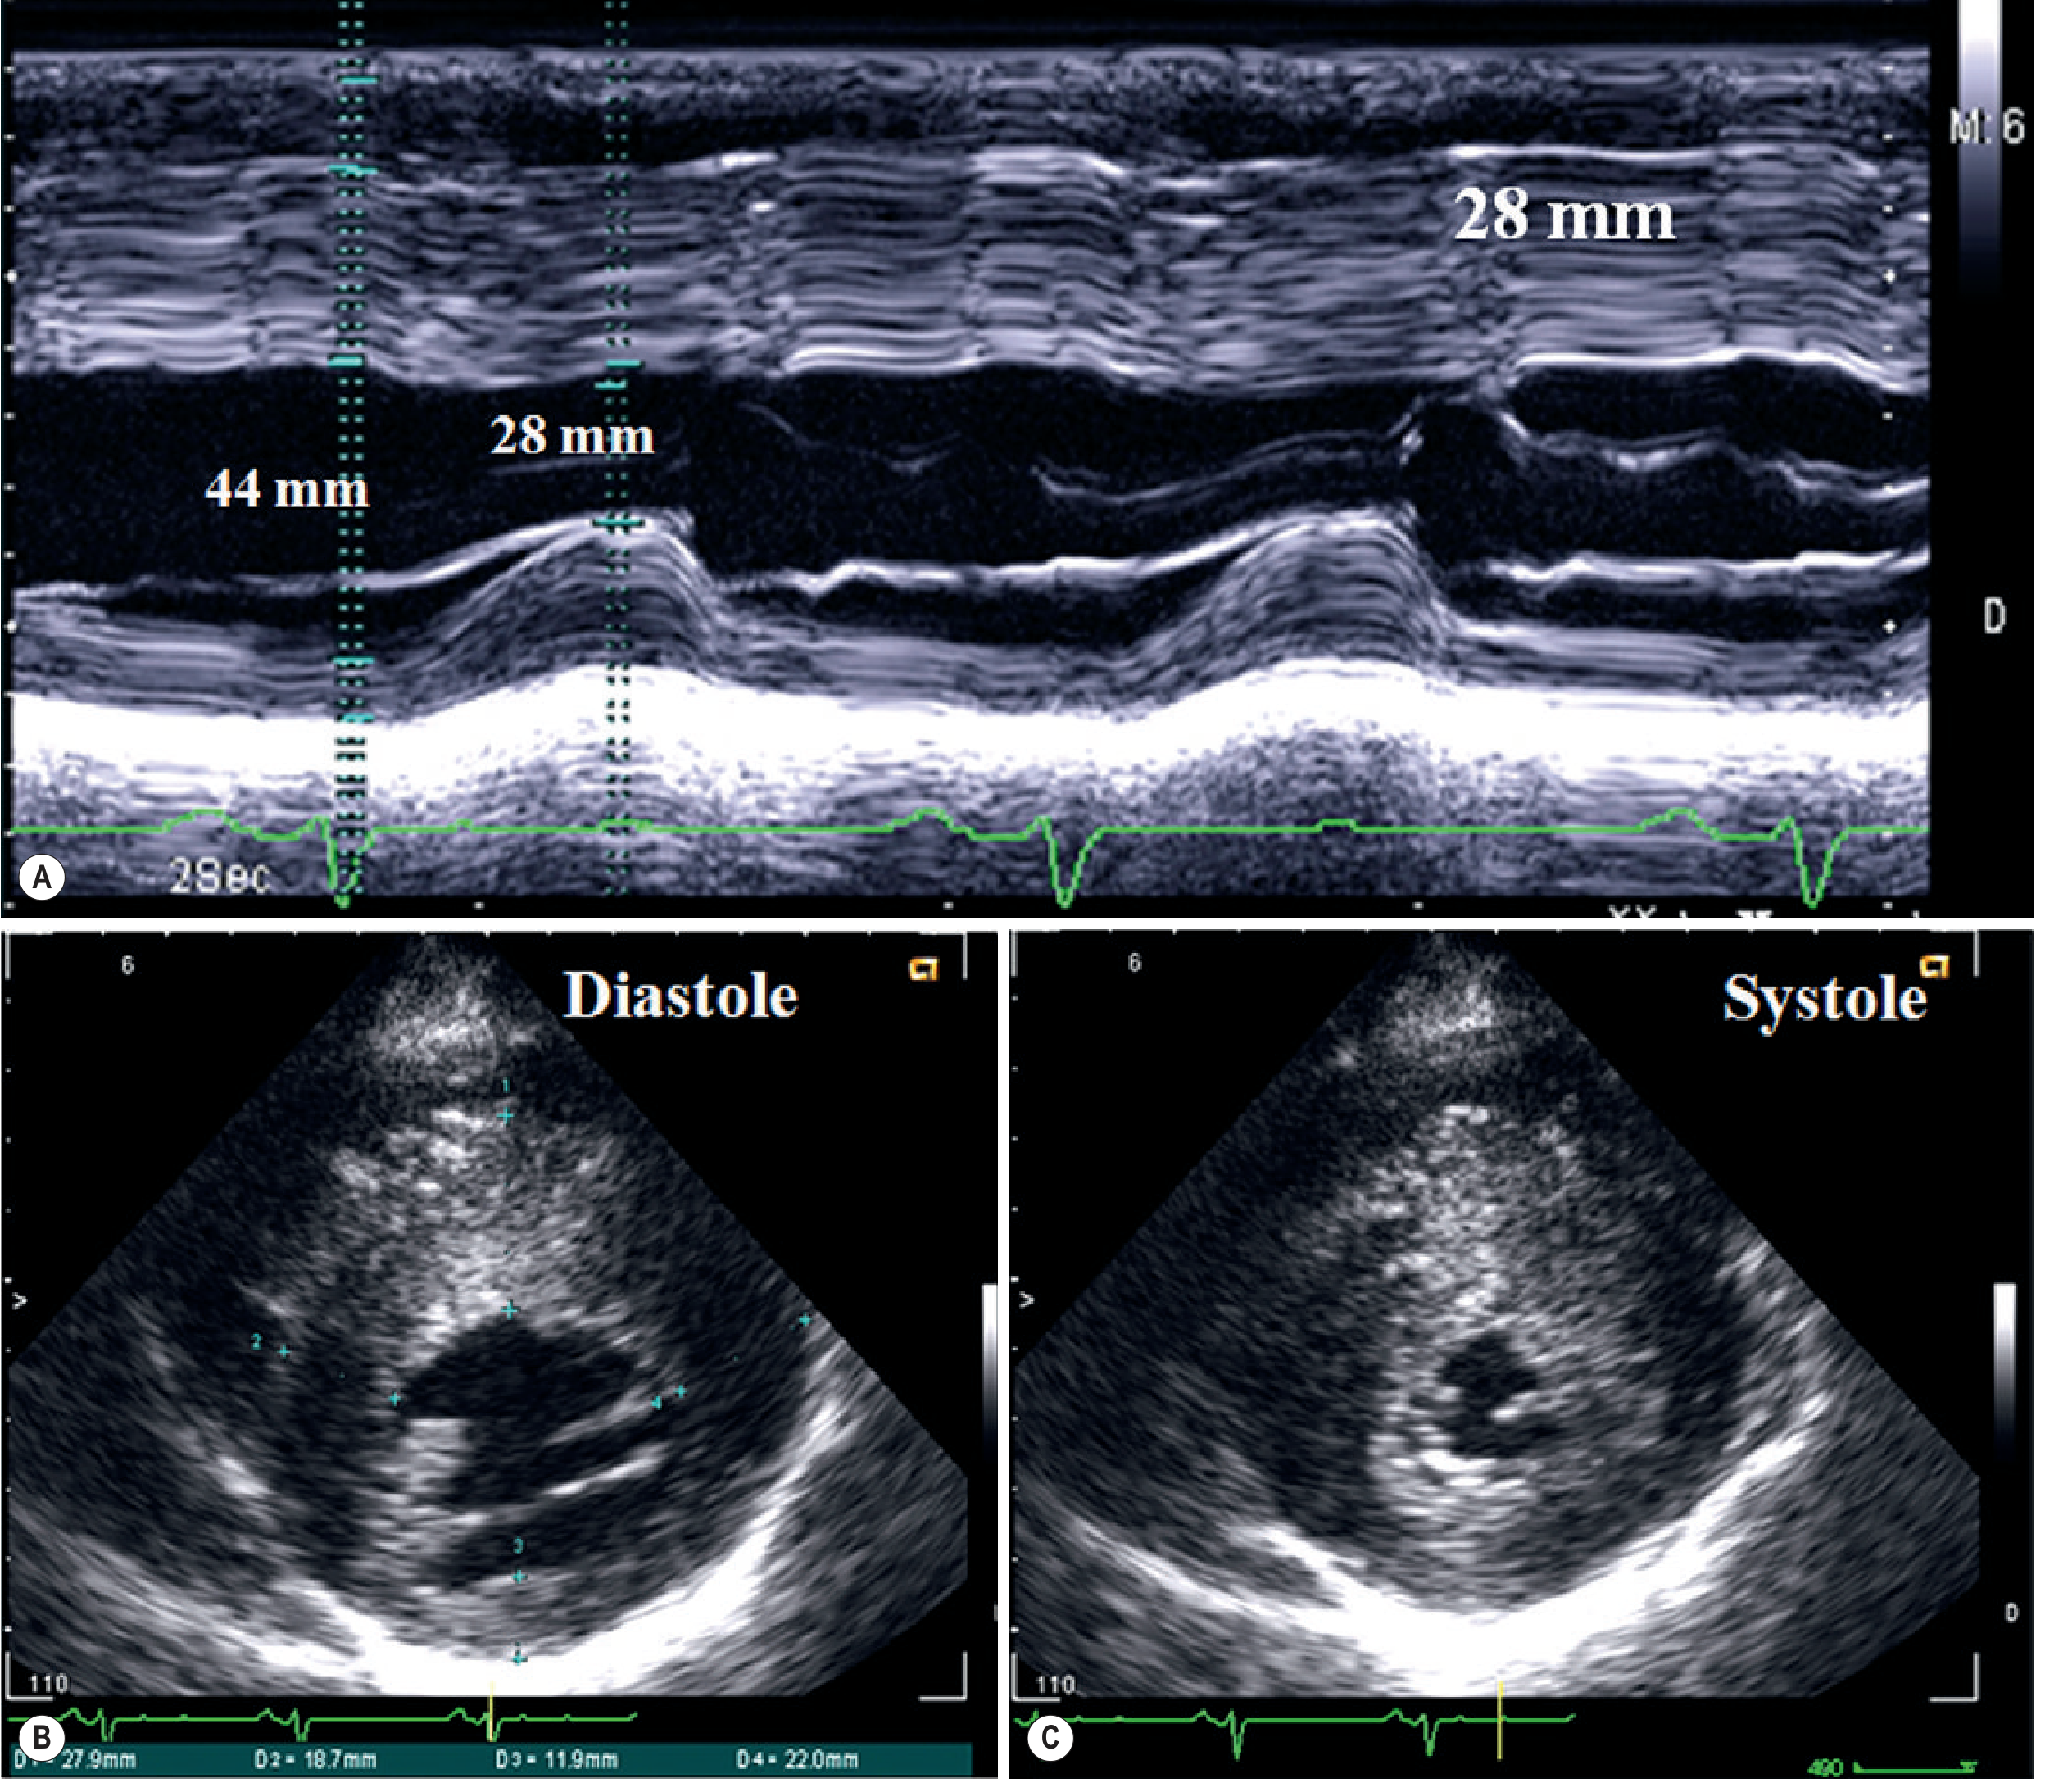
- M-mode: measures IVS and posterior wall thickness; IVS:posterior wall ratio >1.3 is diagnostic
- B-mode: asymmetric septal hypertrophy (ASH); apical/midventricular/mass-like variants
- Doppler: LVOT obstruction in 25% due to systolic anterior motion (SAM) of mitral valve (Venturi effect); rest gradient or provokable gradient; impaired diastolic function (reduced E wave, E/A equalisation)
- Limitation: apical forms near the low-frequency probe, poor acoustic window
Cardiac MRI (Gold Standard for Tissue Characterisation)
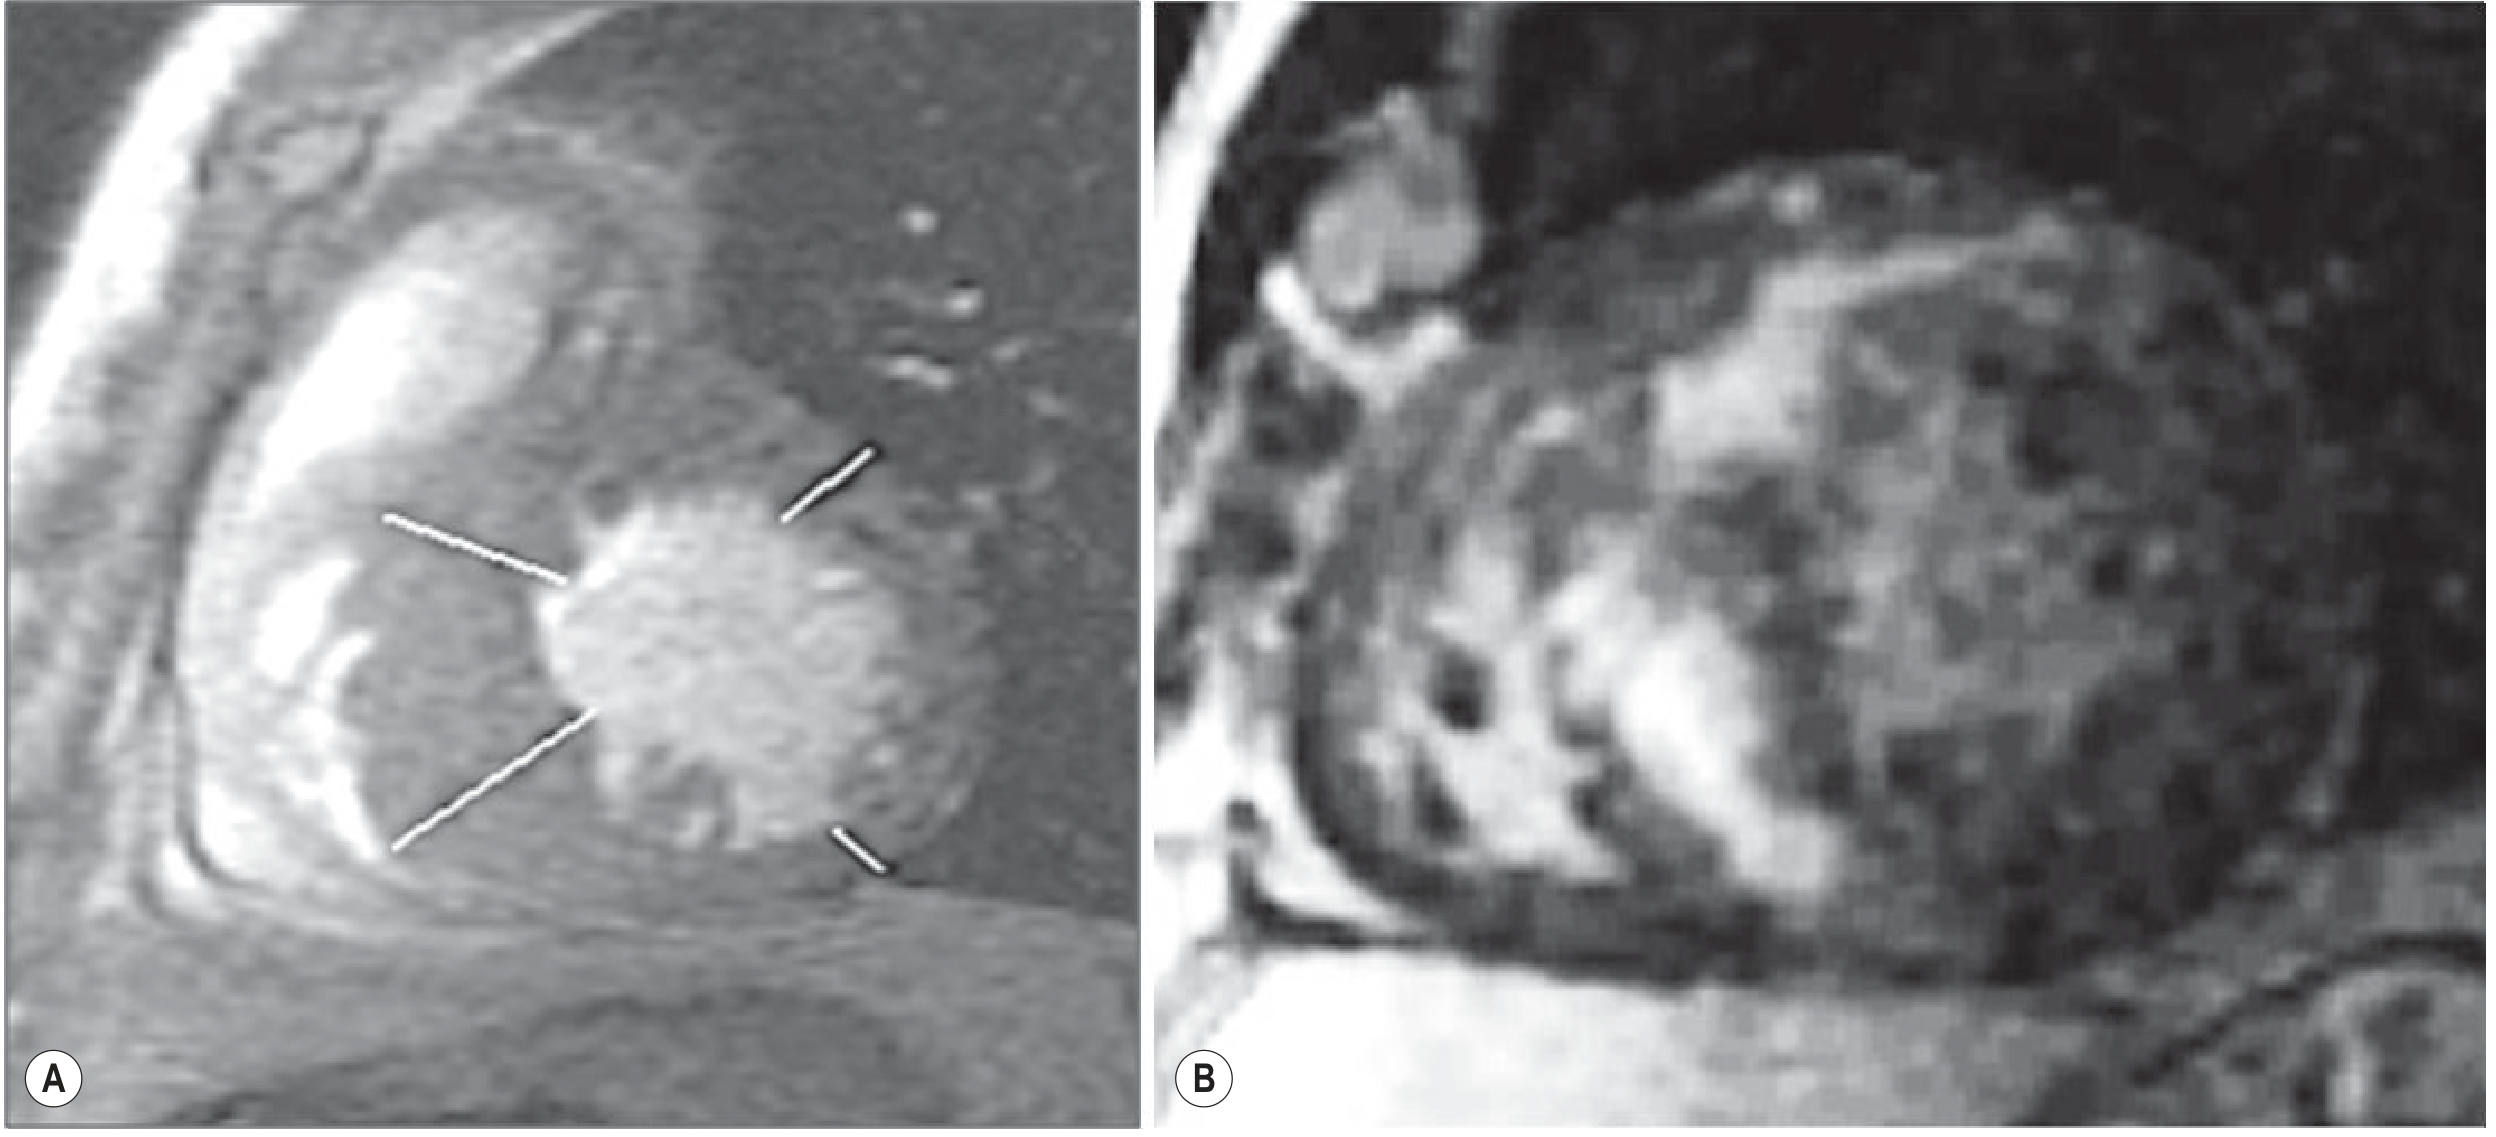
Key MRI features:
- Cine MRI: precise wall thickness measurement; all hypertrophy patterns visible; accurate LV mass quantification; RV involvement quantified
- Late gadolinium enhancement (LGE): PATHOGNOMONIC pattern = intramural fibrosis with selective septal enhancement and relative sparing of the subendocardial layer (distinguishes from MI where enhancement is subendocardial/transmural)
- Also: enhancement at anterior and inferior septal insertion points (RV insertion sites)
- Patchy large intramural foci in severe cases
- Prognostic value of LGE: Fibrosis on MRI predicts ventricular arrhythmias, sudden cardiac death (<40 years), and progression to HF (>40 years)
- T1/T2 mapping: quantitative tissue characterisation; can detect diffuse fibrosis not seen on LGE
Cardiac CT
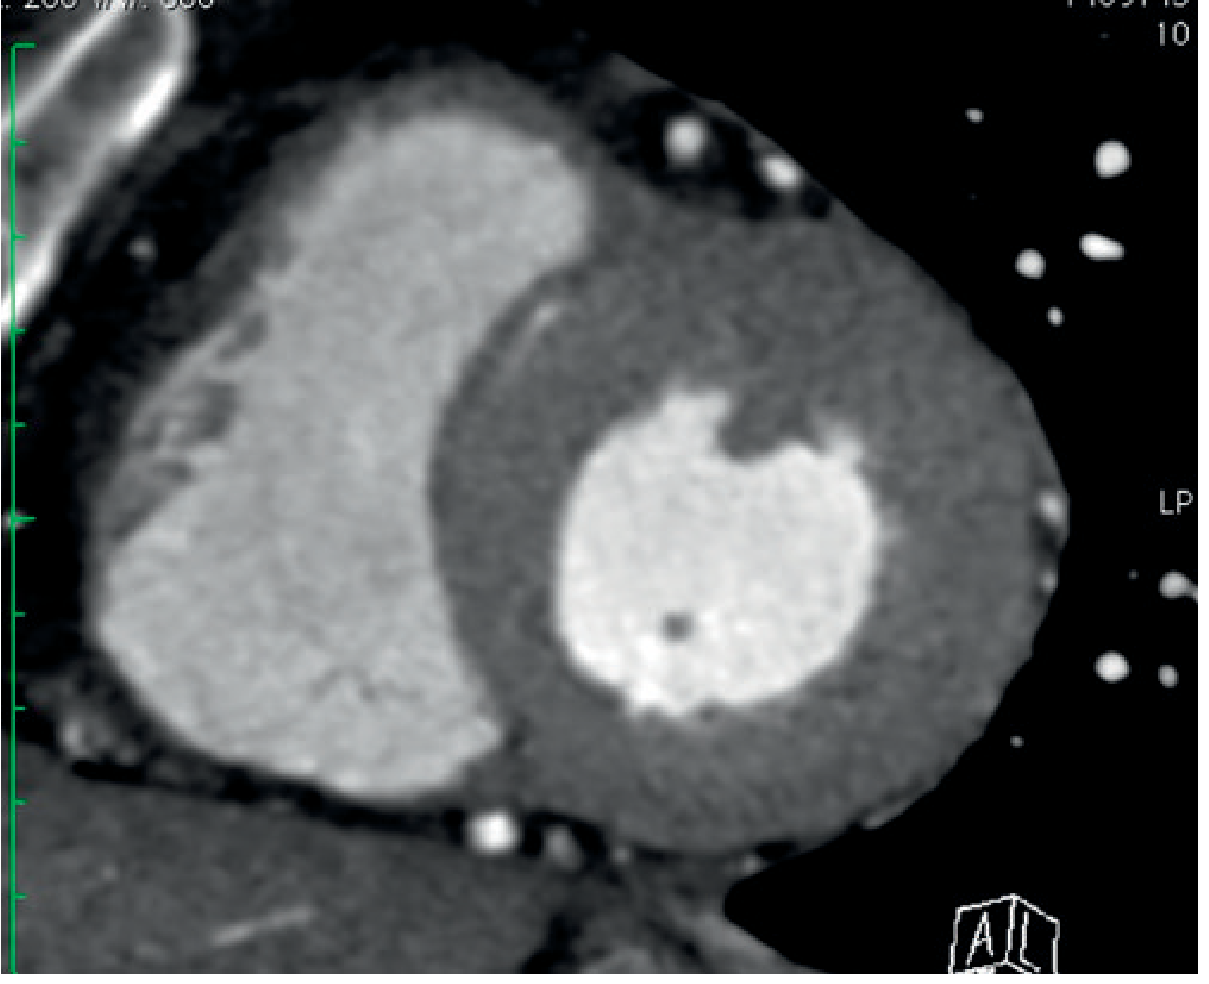
- Accurate wall thickness information at very low dose (1-3 mSv)
- Useful when MRI is contraindicated (pacemaker, claustrophobia)
- Can exclude coronary artery disease simultaneously
Special Variants of Hypertrophic Phenotype
| Disease | Imaging Pearl |
|---|---|
| Anderson-Fabry disease (AFD) | T1 mapping shows markedly LOW native T1; LGE at infero-lateral wall |
| Amyloidosis | "Sparkling" appearance on echo; LGE shows diffuse global subendocardial enhancement ("zebra pattern"); T1 mapping shows high native T1 |
| Athlete's heart | Symmetric hypertrophy; normal diastolic function; LGE absent; regresses with detraining |
| Hypertension | Concentric LVH; no LGE in pure hypertensive disease |
2. Dilated Cardiomyopathy (DCM)
Definition: Dilated, poorly contracting LV (or both ventricles) in the absence of abnormal loading conditions or coronary artery disease sufficient to cause global dysfunction.
Chest X-ray
- Cardiomegaly - cardiothoracic ratio >0.5
- Pulmonary venous congestion / pulmonary oedema in advanced disease
- Pleural effusions
Echocardiography
- Dilated LV with reduced EF (globally hypokinetic)
- Spherical LV shape
- Functional mitral regurgitation (dilated annulus)
- Diastolic dysfunction pattern
- LV thrombus detection (especially at apex)
Cardiac MRI
Key feature: Differentiating ischaemic from non-ischaemic DCM by LGE pattern
| Parameter | Ischaemic DCM | Non-ischaemic DCM |
|---|---|---|
| LGE pattern | Subendocardial or transmural; coronary territory distribution | Mid-wall/intramural striae (patchy fibrosis); subepicardial; may be absent |
| LGE distribution | Follows coronary artery territory | Non-territorial, often septal mid-wall |
| Coronaries on CTA | Atherosclerosis/occlusion | Normal |
| Clinical relevance | Guides revascularisation | Predicts arrhythmia risk |
Cardiac CT
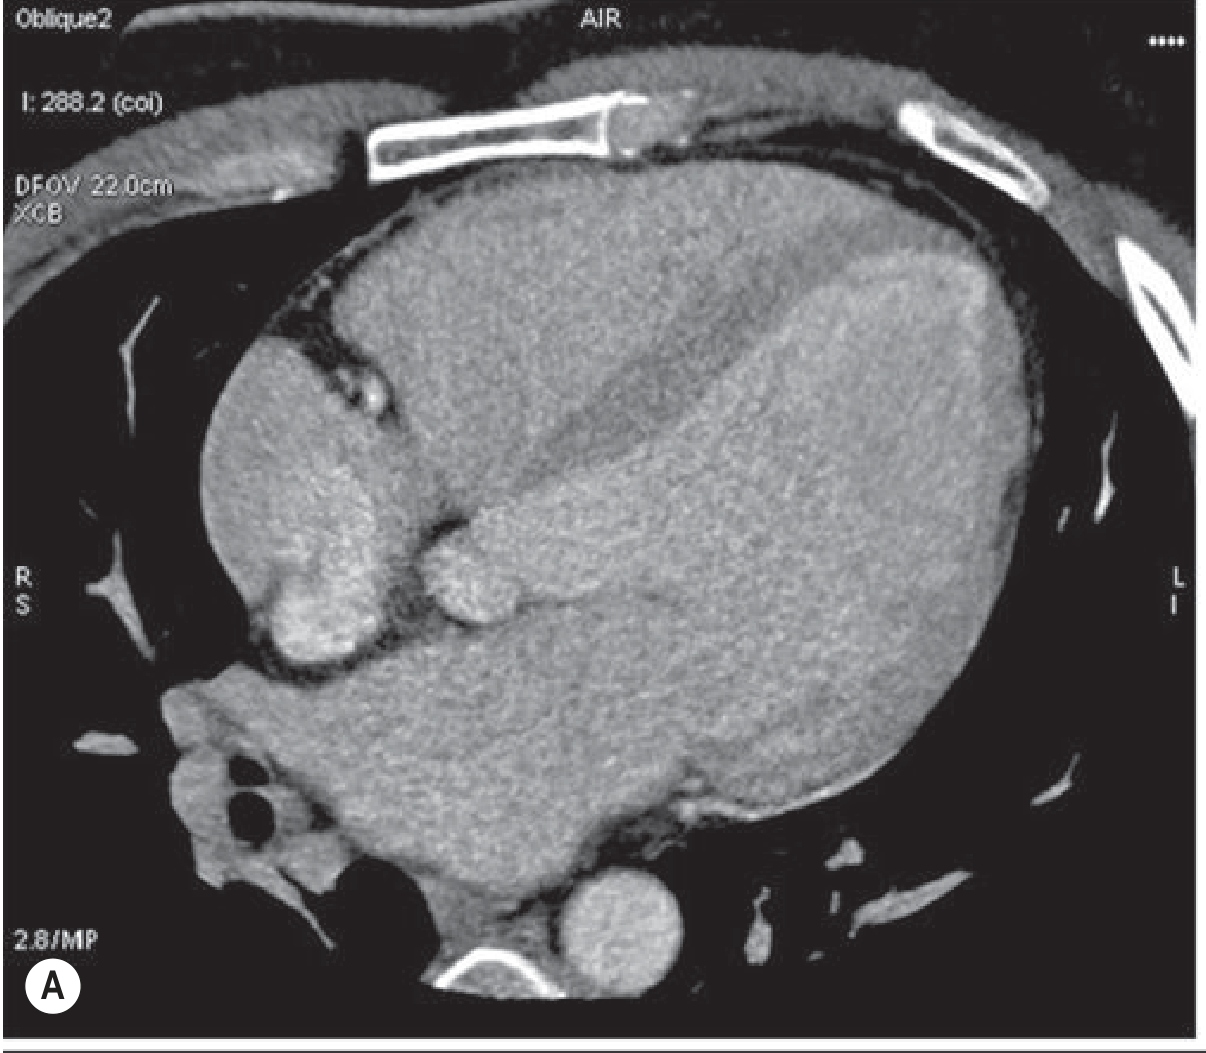
- Coronary CT angiography to exclude ischaemic cause (now first-line in many centres)
- LV dilatation on 4-chamber views
- Myocardial thinning at infero-apical segments in ischaemic DCM
3. Restrictive Cardiomyopathy (RCM)
Definition: Increased wall stiffness causing rapid pressure rise with small volume increase; both ventricles normal/reduced in size with normal wall thickness (usually); diastolic dysfunction predominates.
Causes: Amyloidosis, sarcoidosis, haemochromatosis, Anderson-Fabry disease, endomyocardial fibrosis (Loeffler syndrome), radiation, carcinoid.
Chest X-ray
- Frequently unremarkable in early stages
- Advanced: left atrial enlargement, signs of elevated pulmonary venous pressure (similar to mitral stenosis)
Echocardiography
- Normal-sized or minimally enlarged ventricles with enlarged atria
- Normal or mildly decreased EF
- In Loeffler/endomyocardial fibroelastosis/carcinoid: endocardial thickening visible
- Doppler: elevated early diastolic velocity (E wave), short deceleration time, low atrial velocity (A wave) = restrictive filling pattern
- KEY challenge: must differentiate from constrictive pericarditis - similar Doppler findings
Key differentiating features (RCM vs Constrictive Pericarditis):
| Feature | RCM | Constrictive Pericarditis |
|---|---|---|
| Pericardial thickness | Normal (<4 mm) | Thickened (>4 mm) |
| IVS kinetics | Normal | Septal bounce |
| IVC on inspiration | No significant change | Collapses (>50%) |
| Myocardial LGE | Present (amyloid, sarcoid) | Absent |
| Pericardial enhancement | Absent | May be present |
Cardiac MRI
- Gold standard for pericardial thickness measurement: >4 mm predicts constriction
- T1 and T2 weighted: tissue characterisation of infiltrative diseases
- LGE patterns by specific diseases:
- Amyloidosis: diffuse global subendocardial enhancement; classic "zebra" or "leopard" pattern; rest T1 elevated; early blood-pool nulling
- Sarcoidosis: patchy, non-coronary territory LGE; predilection for basal septum and lateral wall; T2 high in active disease
- Haemochromatosis: LOW T2* signal (iron deposition causes susceptibility effect - myocardium appears dark on T2*)
- T1/T2 mapping: promising for differential diagnosis of infiltrative forms
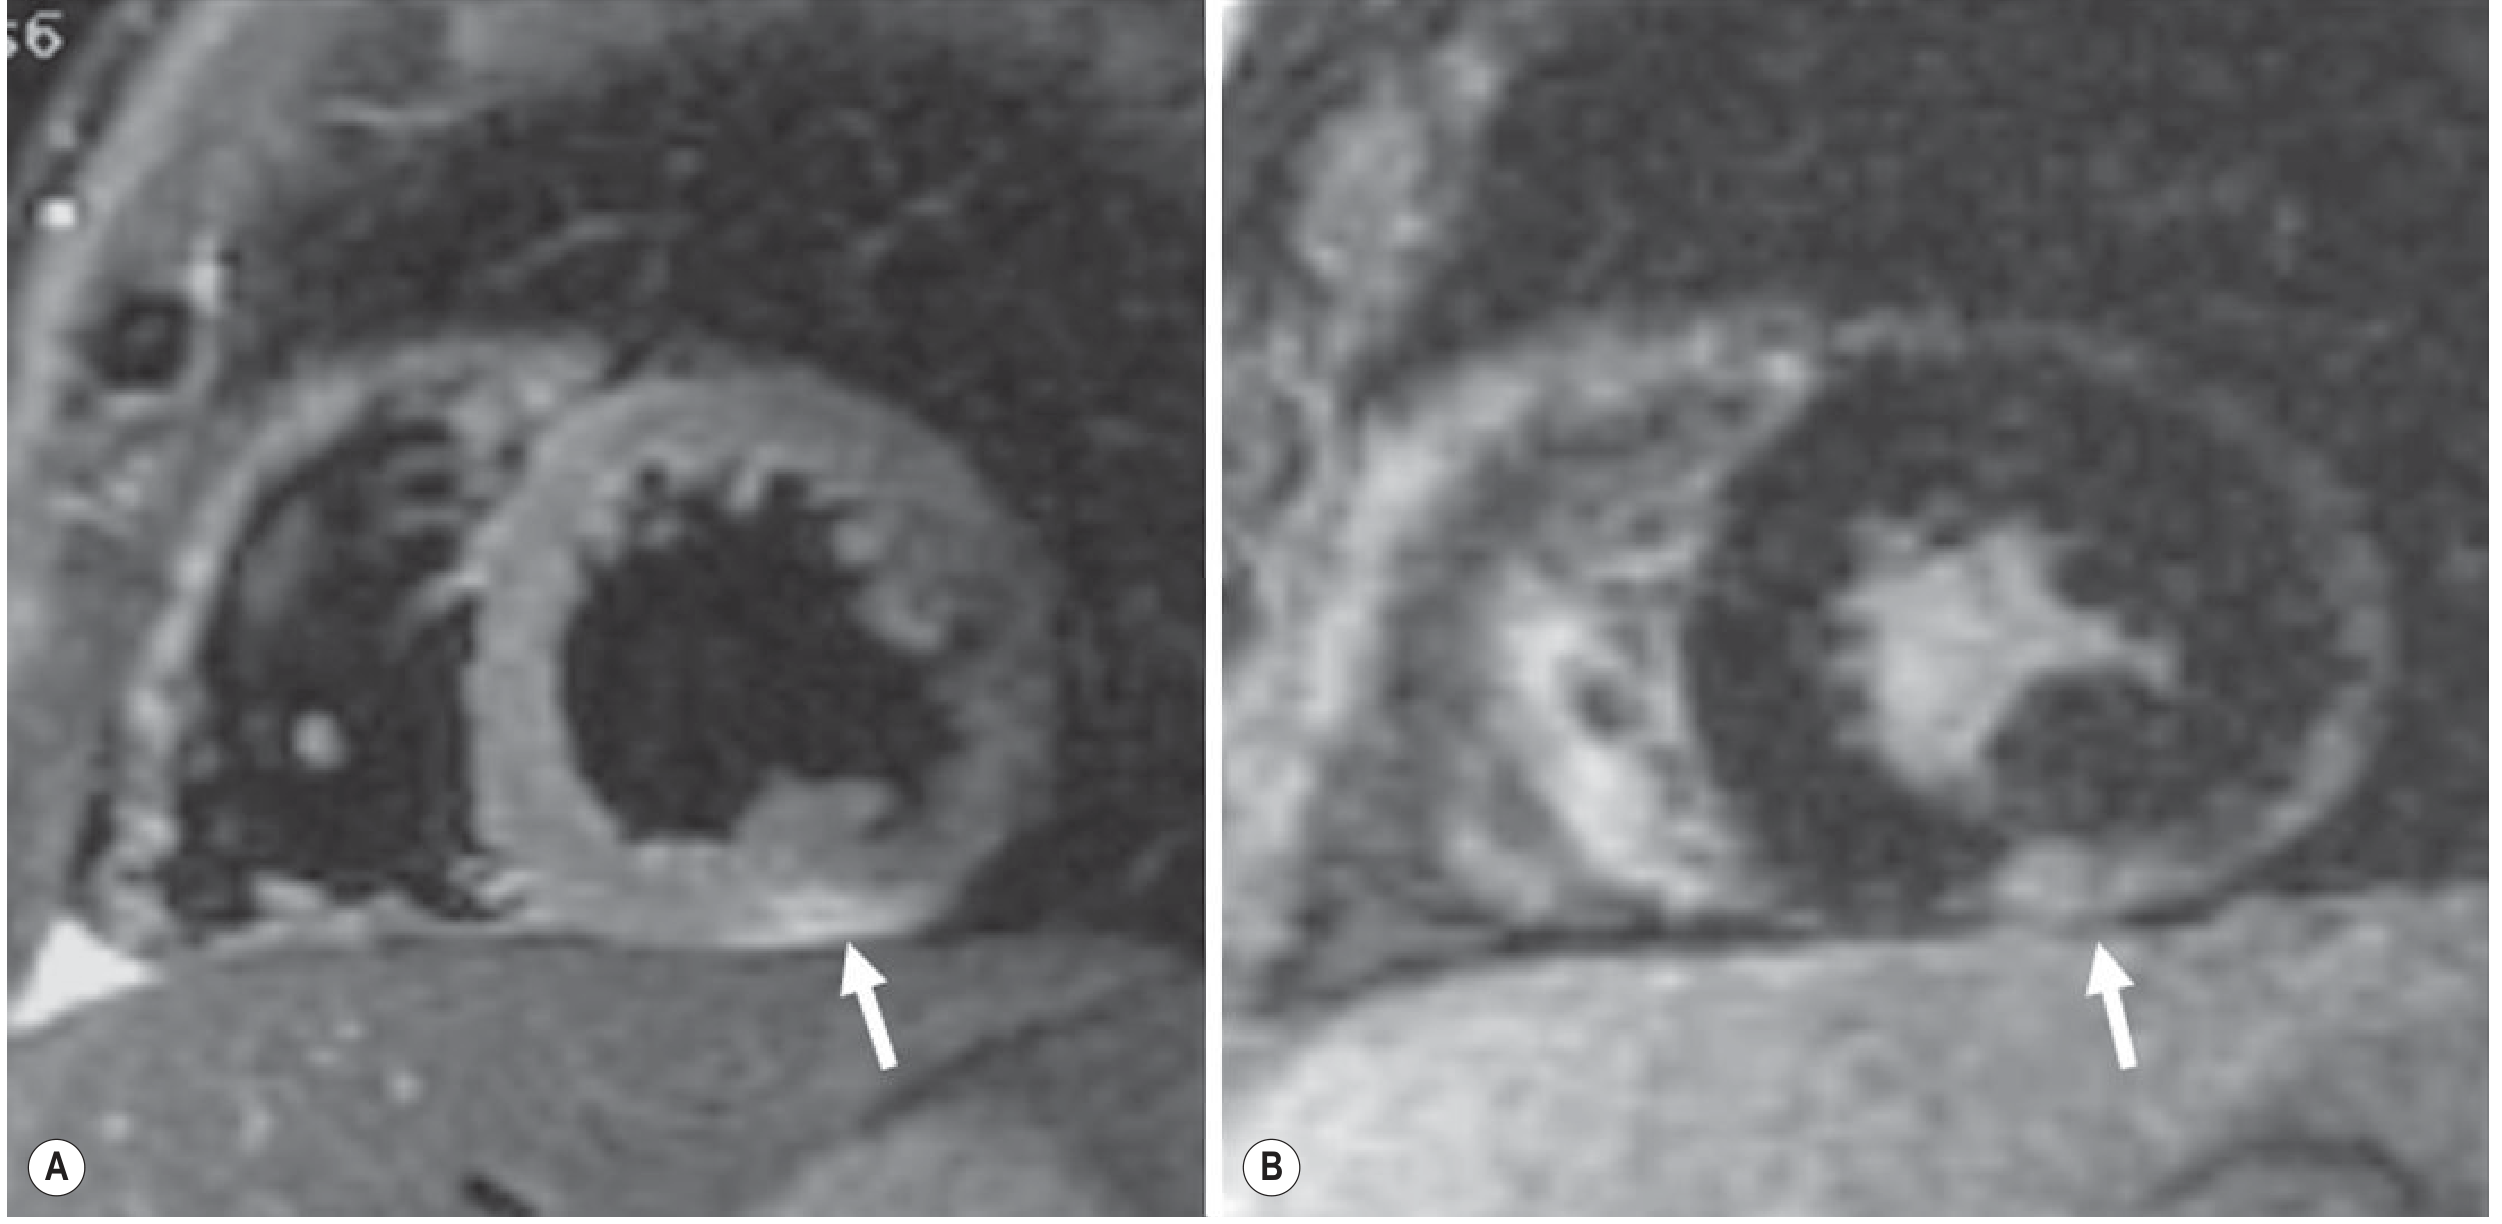
4. Arrhythmogenic Right Ventricular Cardiomyopathy (ARVC)
Definition: Progressive replacement of RV myocardium by fibrofatty tissue; leads to RV dysfunction, ventricular arrhythmias, and sudden death in young athletes.
Chest X-ray
- May be normal or show mild cardiomegaly
- RV enlargement in advanced disease
Echocardiography
- RV dilatation and dysfunction (reduced RVEF)
- RV wall motion abnormalities (focal akinesis, dyskinesis)
- RVOT dilatation
- Limitation: poor RV acoustic window
Cardiac MRI (Modality of Choice)
- Gold standard for ARVC diagnosis
- Key findings:
- RV fatty infiltration: T1 high signal (fat) in RV free wall; however fat is also present in normal subjects, so presence alone is non-specific
- RV dilatation and dysfunction: reduced RVEF, increased RVEDV
- Regional wall motion abnormalities: focal akinesia, dyskinesia, or aneurysm of the RV free wall (triangle of dysplasia: RV inflow, outflow, and apex)
- LGE: fibrosis in RV wall; LV involvement in advanced cases
- Task Force Criteria (2010): structural/functional abnormalities on MRI are part of major and minor diagnostic criteria
Cardiac CT
- Can detect fatty infiltration in RV wall
- Structural assessment if MRI contraindicated
5. Myocarditis (Inflammatory Cardiomyopathy)
Echocardiography
- LV systolic dysfunction (regional or global)
- Pericardial effusion suggests inflammatory process
- Non-specific; cannot provide tissue diagnosis
Cardiac MRI - Lake Louise Criteria (Cornerstone)
Three-sequence protocol (must meet ≥2 criteria for diagnosis):
| Sequence | Finding | Meaning |
|---|---|---|
| T2-weighted (STIR) | Regional/global T2 signal increase | Myocardial oedema |
| Early gadolinium enhancement (EGE) | Global relative enhancement ratio >4 (blood pool vs myocardium) | Inflammatory hyperaemia/capillary leak |
| Late gadolinium enhancement (LGE) | Non-ischaemic distribution enhancement | Myocyte necrosis/fibrosis |
LGE pattern in myocarditis: classically subepicardial, most frequently in lateral and/or inferior wall.
- Easily distinguishable from MI (subendocardial/transmural, follows coronary territory)
- In Takotsubo CMP: LGE is typically absent - key differentiator
Important: Negative LGE does NOT exclude myocarditis - early/hyperaemic phase may show abnormality only on T2 and EGE without LGE.
6. Takotsubo (Stress) Cardiomyopathy
- Echo/CMR: Apical LV ballooning with hypercontractile basal segments (reverse apical ballooning pattern in atypical forms)
- LGE: Characteristically absent (no necrosis - distinguishes from STEMI and myocarditis)
- CMR: T2 elevation in apical segments (oedema); resolves with recovery
- Coronary angiography: normal coronaries
7. LV Non-Compaction (LVNC)
- Echo/CMR: Excessive trabeculation in LV; ratio of non-compacted to compacted layer >2.3 (MRI criterion); typically apical
- CMR is superior for trabeculation quantification
- LGE may be present in trabeculated segments
LGE Pattern Summary Table (High-Yield for Exam)
| Disease | LGE Location | Pattern |
|---|---|---|
| MI (ischaemic) | Subendocardial → transmural | Coronary territory |
| HCM | Intramural septum; RV insertion | Patchy, spares subendocardium |
| DCM (non-ischaemic) | Mid-wall septum | Linear/striae |
| Myocarditis | Subepicardial lateral/inferior | Non-territorial |
| Amyloidosis | Global subendocardial | "Zebra/leopard" pattern |
| Sarcoidosis | Basal septum, lateral wall | Patchy, non-territorial |
| ARVC | RV free wall | Fibrofatty |
| Haemochromatosis | Low T2* (dark) | Not LGE; T2* mapping |
| Takotsubo | Absent | - |
Key MRI Sequences and What They Show
| Sequence | Information |
|---|---|
| Cine (SSFP) | Morphology, function, volumes, EF, wall motion |
| T1-weighted | Anatomy; fat (bright); delayed enhancement (fibrosis) |
| T2-weighted (STIR) | Oedema detection; active inflammation |
| LGE (10-15 min post Gd) | Fibrosis, necrosis, infiltration |
| T1 mapping (native) | Elevated in amyloid/oedema; low in haemochromatosis/fat |
| T2 mapping | Oedema quantification |
| T2 mapping* | Iron overload (haemochromatosis - low T2*) |
| EGE (early gadolinium) | Hyperaemia/capillary leak (myocarditis) |
Exam Pearls
- CMR is the gold standard for tissue characterisation in all cardiomyopathies
- LGE spares subendocardium in HCM - key distinction from MI
- Myocarditis = subepicardial LGE laterally; Takotsubo = no LGE
- Amyloidosis: global subendocardial LGE + high native T1 + early blood-pool nulling + "sparkling" echo
- Haemochromatosis: low T2* (iron causes susceptibility artefact making myocardium dark)
- ARVC: RV fatty infiltration + RV dilatation/dysfunction + CMR Task Force Criteria
- Constrictive pericarditis vs RCM: pericardial thickness >4 mm on CT/MRI favours constriction
- DCM ischaemic vs non-ischaemic: subendocardial LGE in coronary territory = ischaemic; mid-wall septal LGE = non-ischaemic
- Cardiac CT provides coronary anatomy + wall thickness at low dose; used when MRI contraindicated or to exclude ischaemic cause in DCM
- Lake Louise Criteria require ≥2 of 3 (T2, EGE, LGE) for CMR diagnosis of myocarditis
Sources: Grainger & Allison's Diagnostic Radiology, Chapter 14 (Cardiomyopathies) | Braunwald's Heart Disease, 12th Ed.
Imaging in bone tumors in detail
Finding Sources
Finding Sources
Finding Sources
Finding Sources
Excellent - Grainger & Allison block 8 and 14 are the key radiology sources. Let me read them in parallel along with the TOC to map all sections.
Finding Sources
Reading File
Finding Sources
Reading File
I can see the block structure now. Block 8 has the chapter on malignant bone tumours starting at line ~810 with the metastases section, and the TOC shows the full benign tumour chapter. Let me read the key sections in parallel - the radiological assessment section and the malignant tumour sections.
Reading File
Reading File
I now have the full radiological assessment section and key tumour sections. Let me read the osteosarcoma, Ewing, and GCT sections along with key images.
Reading File
Reading File
Excellent content. Now let me fetch key images and read the Ewing/GCT sections.
Loading Image
Reading File
Reading File
Loading Image
I now have comprehensive content on bone tumour imaging from Grainger & Allison. Let me read a bit more on the Ewing sarcoma and GCT sections and fetch one more key image.
Reading File
Loading Image
I now have rich, comprehensive content from Grainger & Allison covering all the key aspects of bone tumour imaging. Let me also quickly fetch the Ewing sarcoma radiograph image, then compile the full answer.
Loading Image
I now have all the material needed. Let me compile the comprehensive exam answer.
Imaging in Bone Tumours - Detailed Notes for ND Radiology Theory Exam
Source: Grainger & Allison's Diagnostic Radiology, Chapters 40 & 41
PART 1: RADIOLOGICAL ASSESSMENT - THE SYSTEMATIC APPROACH
When analysing any bone lesion, six key radiological parameters must be assessed before making a diagnosis.
1. Age of Patient
| Age Group | Most Likely Lesion |
|---|---|
| <5 years | Metastatic neuroblastoma, leukaemia |
| 5-15 years | Ewing sarcoma, osteosarcoma |
| 10-25 years | Osteosarcoma, Ewing sarcoma, osteoblastoma |
| 20-40 years | GCT, fibrosarcoma/UPS |
| >40 years | Metastases (commonest!), myeloma, chondrosarcoma, Paget sarcoma |
2. Location within Skeleton & Bone
Skeletal site:
- Axial > appendicular (metastases, myeloma prefer red marrow)
- Long bones: osteosarcoma (distal femur, proximal tibia, proximal humerus)
- Flat bones / diaphysis: Ewing sarcoma (pelvis, ribs)
Location within the bone:
| Position | Tumours |
|---|---|
| Epiphysis | GCT (mature skeleton), chondroblastoma (open physis), clear cell chondrosarcoma |
| Metaphysis | Osteosarcoma, chondrosarcoma, NOF, ABC, SBC |
| Diaphysis | Ewing sarcoma, fibrous dysplasia, adamantinoma (tibia), myeloma |
| Epiphysis + Metaphysis | GCT (crosses physis in adults) |
| Intramedullary | Most primary bone tumours |
| Intracortical | Osteoid osteoma, adamantinoma |
| Surface/juxtacortical | Parosteal osteosarcoma, periosteal chondroma |
3. Rate of Growth - Lodwick Classification (Zone of Transition)
| Type | Description | Significance |
|---|---|---|
| Type 1A | Sharp, geographic, sclerotic margin | Slow growth; benign |
| Type 1B | Well-defined lytic, no marginal sclerosis | Slow growth; benign/low-grade |
| Type 1C | Slightly less sharp, non-sclerotic | Transitional |
| Type 2 | Moth-eaten - multiple lucent areas 2-5 mm, separated by intact bone | More aggressive |
| Type 3 | Permeative - multiple coalescing tiny (<1 mm) ill-defined lesions, zone of transition >several cm | Most aggressive; Ewing, lymphoma, myeloma |
- Benign/low-grade tumours: remain in medullary cavity, endosteal scalloping + expansion without cortical destruction
- High-grade malignant: cortical destruction + extra-osseous soft-tissue mass by presentation
4. Periosteal Reaction Types
| Type | Description | Significance |
|---|---|---|
| Solid/thick | Well-formed, uniform | Slow growth; NOT necessarily benign (can see in grade 2 chondrosarcoma) |
| Laminated ("onion skin") | Multiple parallel layers | Subperiosteal tumour extension, infection, haematoma; CLASSIC in Ewing sarcoma |
| Codman triangle | Interrupted periosteal reaction at edge of tumour | Marks limit of subperiosteal tumour in longitudinal direction; indicates aggressive lesion |
| Sunburst/hair-on-end (spiculated) | Radiating perpendicular spicules | Most aggressive; CLASSIC in osteosarcoma; also Ewing |
| Multilaminated | Periodic growth pattern | Repeated episodes of tumour growth |
Exam Pearl: No periosteal reaction is pathognomonic for any tumour - it indicates aggressiveness, not histological type.
5. Matrix Mineralisation
| Matrix Type | Appearance | Tumour |
|---|---|---|
| Osteoid/tumour bone | Dense, fluffy, cloud-like, "ivory" | Osteosarcoma |
| Chondroid | Rings, arcs, C-shapes, "pop-corn" calcification | Chondrosarcoma, enchondroma, osteochondroma |
| No matrix | Purely lytic | GCT, myeloma, metastases (renal, thyroid), fibrosarcoma |
| Ground glass | Hazy, "smoke-filled" | Fibrous dysplasia |
6. CT and MRI Role
CT:
- Best for: cortical detail, matrix mineralisation characterisation, periosteal reaction details
- Identifies subtle endosteal scalloping, cortical destruction
- CT-guided biopsy
MRI (Gold Standard for Local Staging):
- T1W: anatomy, medullary extent (normal marrow = bright; tumour = dark, intermediate)
- T2W/STIR: tumour extent, oedema, soft-tissue component (tumour = bright); identifies skip lesions
- Contrast (Gd): tumour enhancement pattern; solid vs cystic components; vascular supply
- Key MRI roles:
- Defines intramedullary extent - always underestimated on X-ray
- Cortical saucerisation by Ewing sarcoma visible
- Soft-tissue extension and neurovascular bundle proximity (surgical planning)
- Skip lesions (transarticular/intramedullary discontinuous foci)
- Response to chemotherapy assessment
PART 2: CLASSIFICATION OF BONE TUMOURS
WHO Classification - Key Benign Tumours (Table 40.1, Grainger & Allison)
| Origin | Benign | Intermediate/Locally Aggressive |
|---|---|---|
| Chondrogenic | Osteochondroma, enchondroma | ACT/grade 1 chondrosarcoma, chondroblastoma |
| Osteogenic | Osteoma, osteoid osteoma | Osteoblastoma |
| Giant cell-rich | GCL small bones | Giant cell tumour |
| Fibrogenic | NOF, benign fibrous histiocytoma | Desmoplastic fibroma |
| Undefined | Simple bone cyst, FD, ABC | - |
WHO Classification - Malignant Bone Tumours
| Origin | Malignant Tumour |
|---|---|
| Chondrogenic | Chondrosarcoma (grade 1-3), dedifferentiated |
| Osteogenic | Osteosarcoma (7 subtypes) |
| Fibrogenic | Fibrosarcoma, UPS (undifferentiated pleomorphic sarcoma) |
| Marrow | Ewing sarcoma, myeloma, lymphoma |
| Notochordal | Chordoma |
| Metastatic | (Most common overall >40 yrs) |
PART 3: INDIVIDUAL TUMOURS IN DETAIL
A. OSTEOSARCOMA
Epidemiology: Commonest non-haematological primary bone malignancy; 4/million/year; bimodal - peak at 10-14 years (adolescent growth spurt), second peak in elderly (Paget-related). Male:female = 1.35:1.
Associations: Li-Fraumeni syndrome, Rothmund-Thomson syndrome, familial retinoblastoma, Paget disease, prior radiotherapy, bone infarction, fibrous dysplasia.
WHO Subtypes (7):
- Conventional (75%) - high-grade intramedullary
- Telangiectatic
- Low-grade central
- Small cell
- Parosteal - surface, low grade
- Periosteal - surface, intermediate grade
- High-grade surface
Conventional Osteosarcoma:
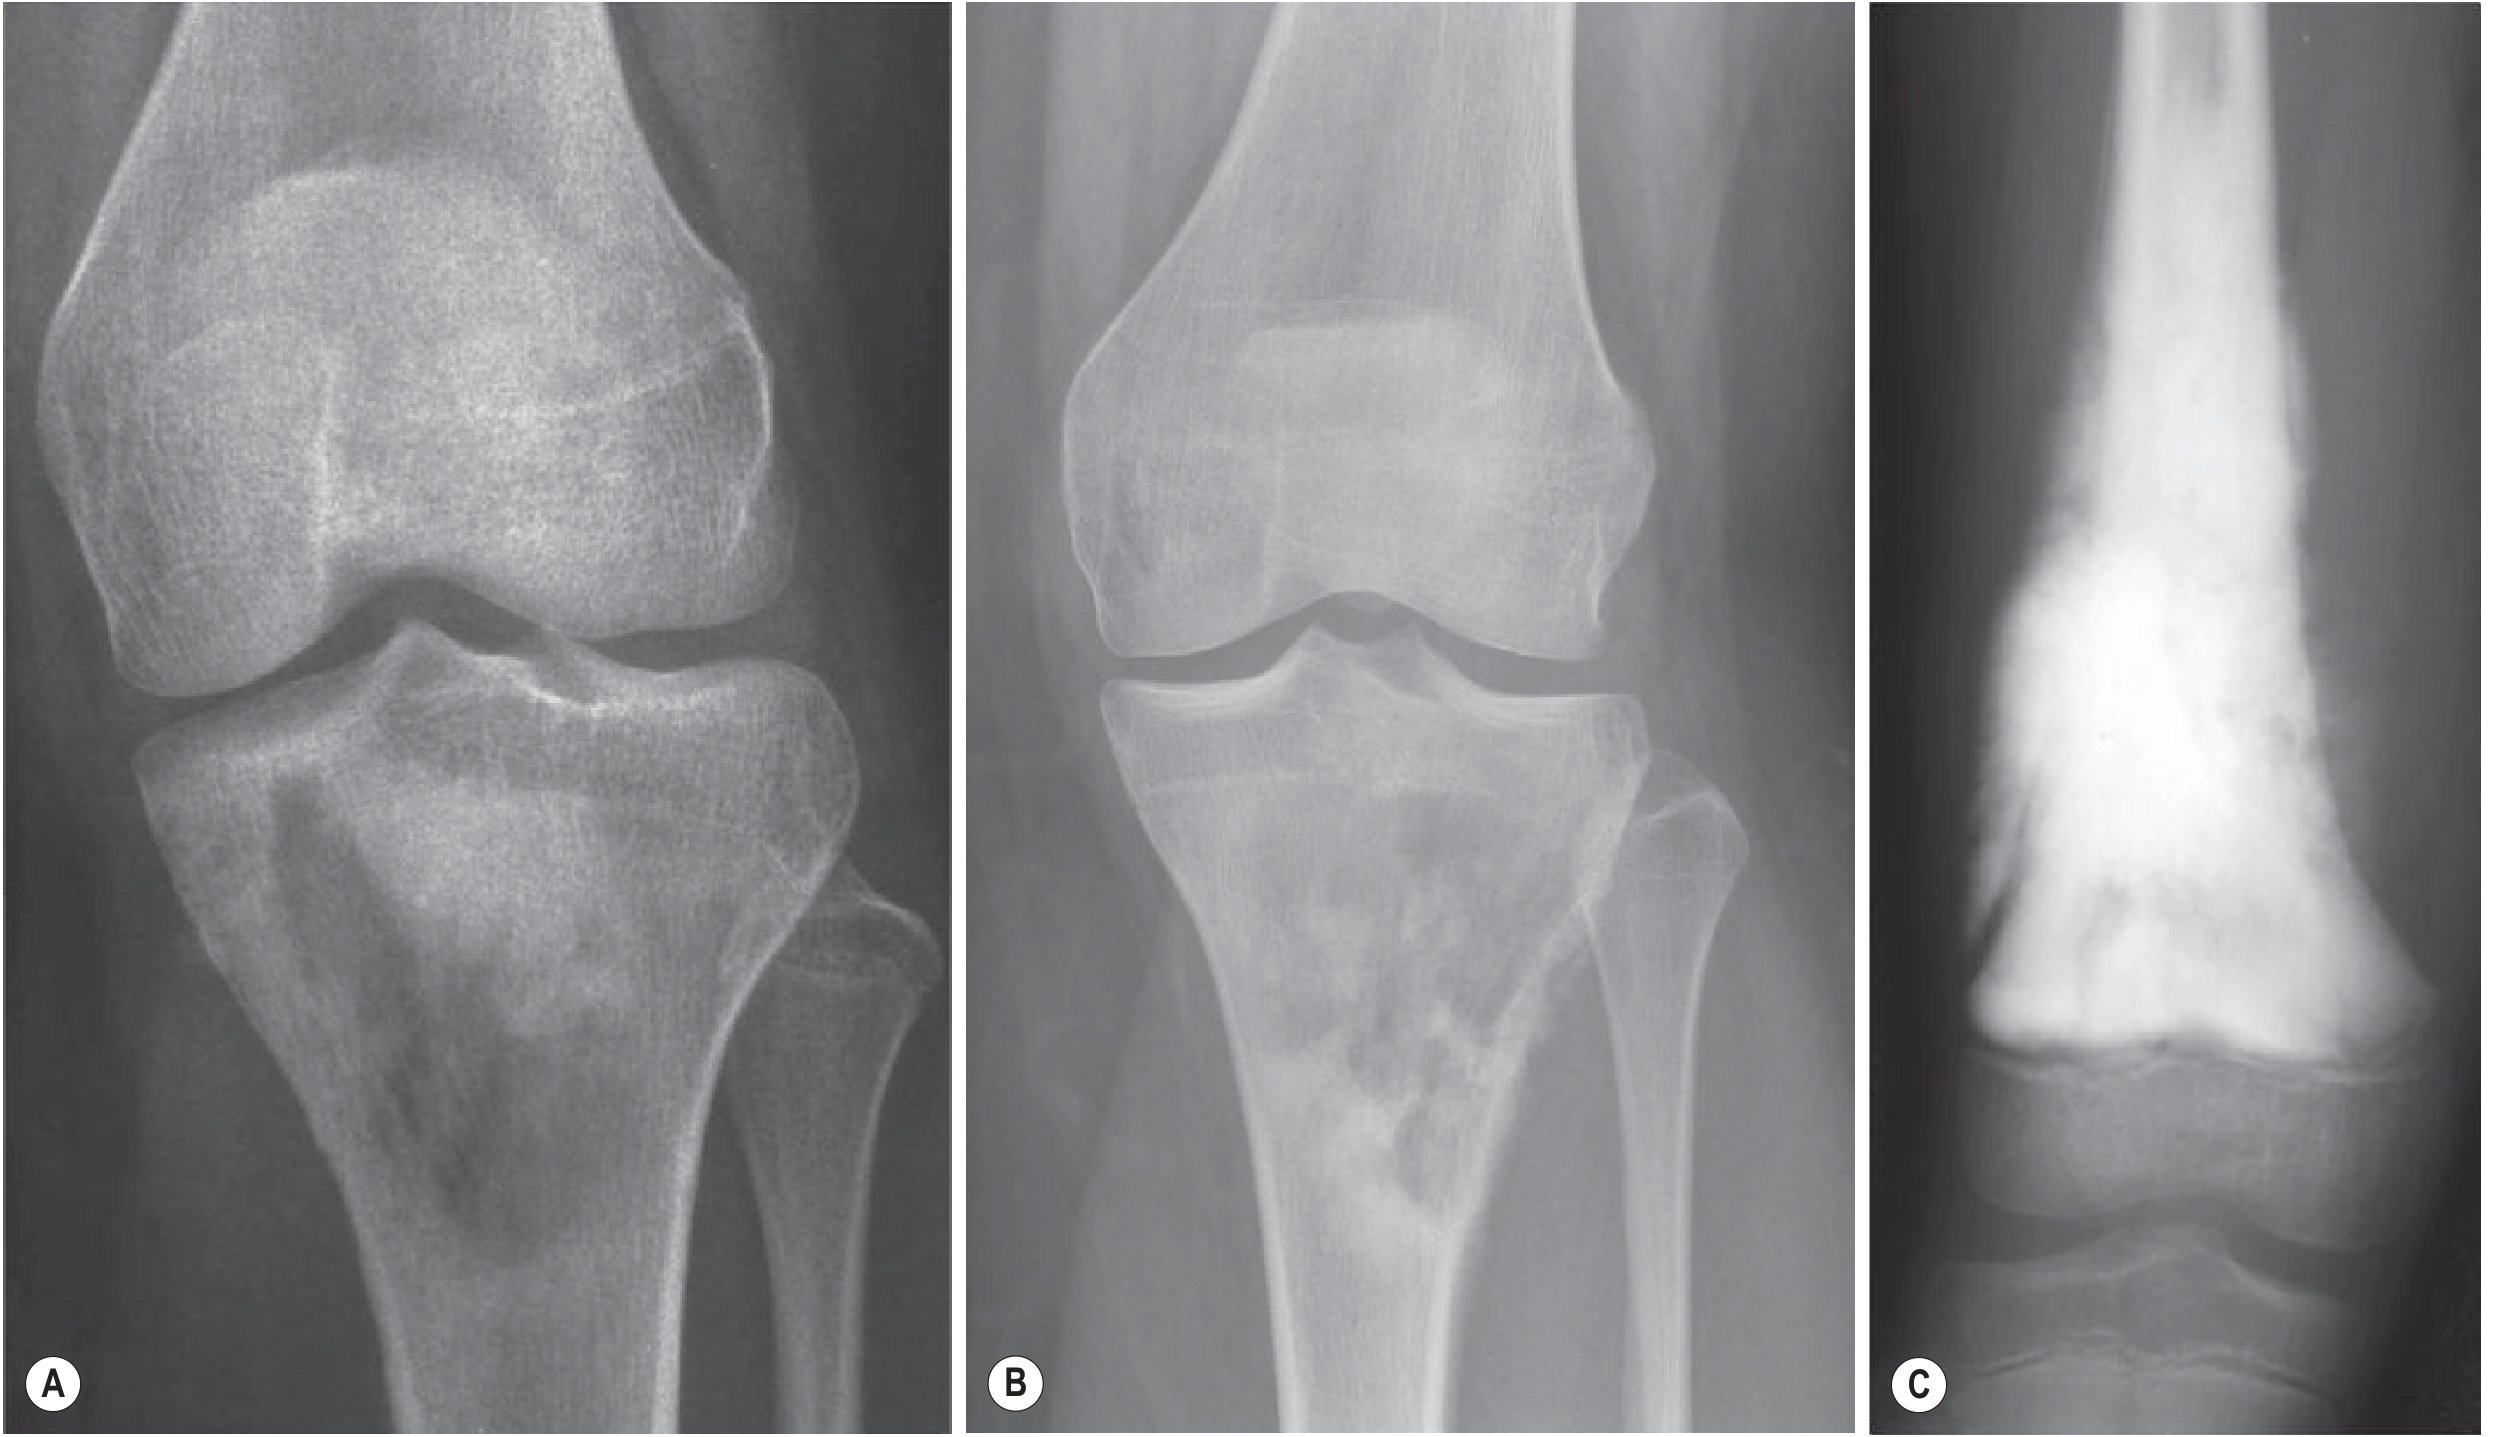
Conventional osteosarcoma - X-ray appearances: (A) early normal appearing; (B) lytic permeative metaphyseal; (C) sclerotic with sunburst periosteal reaction - distal femur/proximal tibia (most common site = around knee)
| Feature | Detail |
|---|---|
| Site | Metaphysis of long bones; distal femur (40%), proximal tibia (20%), proximal humerus (10%) - around the knee in 60% |
| X-ray | Mixed sclerotic-lytic lesion; permeative/moth-eaten destruction; sunburst periosteal reaction (most aggressive); Codman triangle; soft-tissue mass with tumour bone formation (fluffy/cloud-like density) |
| Matrix | Osteoid matrix - dense, fluffy, amorphous sclerosis (differentiate from reactive host bone!) |
| MRI T1 | Low-intermediate SI tumour; dark on T1; medullary extent clearly shown |
| MRI T2/STIR | Heterogeneous high SI; soft-tissue extension; skip lesions |
| Key MRI features | Defines extent for limb salvage surgery; neurovascular bundle proximity; skip lesions (intramedullary discontinuous foci within same bone or transarticular) |
| CT | Matrix mineralisation detail; periosteal reaction characterisation |
Telangiectatic Osteosarcoma:
- Purely lytic, large, expansile; no matrix mineralisation
- Multiple fluid-fluid levels (FFLs) on MRI - mimics ABC!
- Key distinction: solid nodular tissue in walls + Gd enhancement = malignant
- DDx: ABC has no solid enhancing component
Parosteal Osteosarcoma:
- Surface lesion; posterior distal femur most common
- Dense ossified surface mass; may encircle bone; normal medullary cavity (until late)
- X-ray: densely ossified lobulated surface lesion
- MRI: low SI ossified centre; cleavage plane between lesion and cortex useful prognostically
Periosteal Osteosarcoma:
- Surface, intermediate grade (chondroblastic)
- X-ray: spiculated periosteal reaction + ossified soft-tissue component
- MRI: confirms extensive surface lesion + intramedullary signal change
B. EWING SARCOMA
Epidemiology: 2nd most common bone sarcoma in children; 6-8% primary malignant bone tumours; 75% under age 20 (peak 5-15 yrs); male:female = 1.4:1; rare in non-Caucasians. Translocation t(11;22).
Family includes: Ewing sarcoma, PNET, adult neuroblastoma, Askin tumour (chest wall).
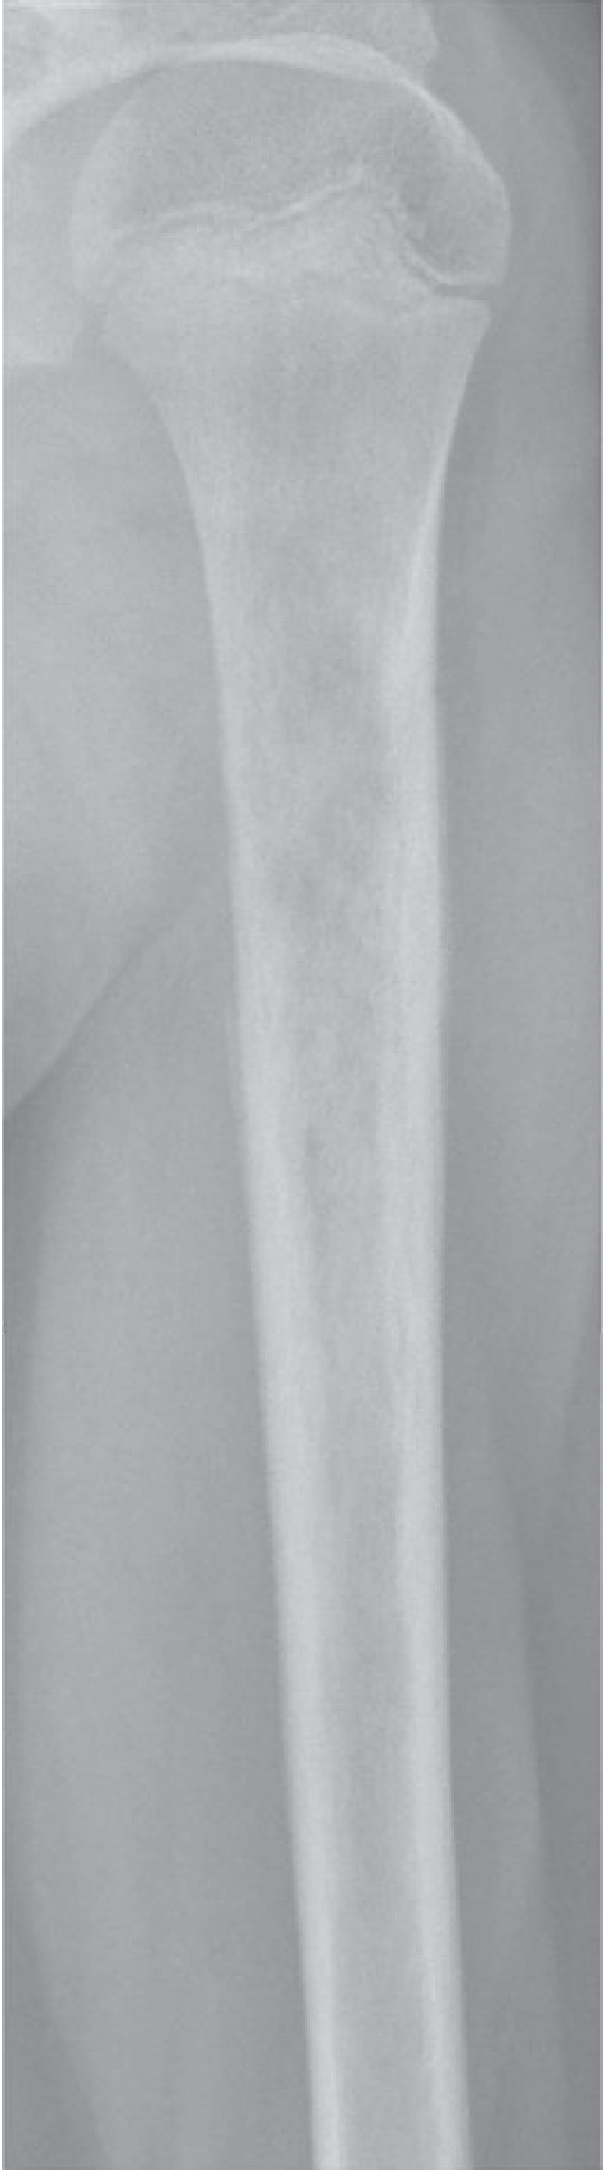
| Feature | Detail |
|---|---|
| Site | Diaphysis (35%) or metadiaphysis (60%) - classic diaphyseal unlike osteosarcoma (metaphyseal); femur + humerus (31%), pelvis (21%, ilium), ribs (<8%) |
| X-ray | Permeative/moth-eaten destruction; wide zone of transition; "onion-skin" (multilamellar) periosteal reaction; soft-tissue mass in 80% |
| Codman triangle | Present |
| Sunburst | Can occur but less typical than in osteosarcoma |
| MRI | Large soft-tissue mass (often disproportionate to bone destruction); may show "cortical saucerisation"; T2 bright; intermediate T1 |
| Mimics infection | Systemic features (fever, raised ESR) + diaphyseal lytic lesion - DDx osteomyelitis |
| Pelvic Ewing | Large soft-tissue mass; can be very large with iliac bone destruction |
C. CHONDROSARCOMA
Epidemiology: 2nd most common primary bone malignancy; 4th-5th decade (unlike osteosarcoma); male predominance.
Types:
- Central (conventional) - most common; arises in medullary cavity
- Secondary - from osteochondroma or enchondroma
- Dedifferentiated - high-grade component within low-grade; worst prognosis
- Clear cell - epiphyseal; low grade
- Mesenchymal - young patients; highly malignant
Imaging:
| Feature | Detail |
|---|---|
| Site | Pelvis, proximal femur, proximal humerus, ribs (unlike osteosarcoma = distal femur) |
| X-ray | Lytic lesion with chondroid matrix (rings and arcs calcification, "popcorn"); endosteal scalloping; slow-growing; no aggressive periosteal reaction in low-grade |
| Size | Mean 8 cm (vs enchondroma 5 cm) |
| Endosteal scalloping >2/3 cortical thickness | Seen in 67% chondrosarcomas vs 11% enchondromas - key imaging sign |
| Bone scintigraphy | >80% chondrosarcomas show increased uptake; normal activity favours enchondroma |
| MRI | Lobulated; T2 very bright (high water content cartilage); septal enhancement post-contrast; dynamic CE-MRI for dedifferentiation foci |
| CT | Best for calcification pattern and cortical erosion |
| Cartilage cap (secondary from osteochondroma) | Cap >2 cm on US/CT/MRI = malignant transformation likely; <2 cm = unlikely |
| FDG-PET | Low SUVmax = benign; elevated SUVmax = higher-grade; not yet routine |
D. GIANT CELL TUMOUR (GCT) OF BONE
Epidemiology: Locally aggressive (intermediate); 20-40 years; rare in skeletally immature; female preponderance. ~1-2% metastasise to lung.
| Feature | Detail |
|---|---|
| Site | Epiphysis (closed physis required); distal femur, proximal tibia, distal radius; extends to subchondral bone |
| X-ray | Purely lytic ("soap bubble" appearance); eccentric, epiphyseal/subchondral; no matrix; no periosteal reaction in uncomplicated cases; type 1B/1C zone of transition; cortical expansion; may break cortex |
| MRI T1 | Low-intermediate SI |
| MRI T2 | Heterogeneous; areas of low SI (haemosiderin); fluid-fluid levels (25%) |
| MRI Gd | Solid enhancement (distinguishes from ABC) |
| CT | No internal calcification (distinguishes from chondroid lesions); cortical thinning; soft-tissue extension |
| Recurrence | High local recurrence rate after curettage |
E. OSTEOID OSTEOMA
Epidemiology: Young adults (10-35 years); male:female = 3:1; night pain relieved by aspirin/NSAIDs (classic clinical feature from prostaglandin production).
| Feature | Detail |
|---|---|
| Site | Cortex of long bone diaphysis/metaphysis (femur, tibia); posterior elements of spine (scoliosis) |
| X-ray | Small (<1.5 cm) radiolucent nidus surrounded by dense reactive sclerosis; nidus may be hard to see |
| CT | Modality of choice - shows nidus precisely; central calcification in 50% of nidus; surrounding sclerosis; localises lesion for radiofrequency ablation guidance |
| MRI | Marked surrounding reactive marrow oedema (can be confusing - overestimates lesion); nidus T1 iso, T2 high; Gd enhancement |
| Bone scan | Intense "double density" hot spot |
F. OSTEOBLASTOMA
- Similar to osteoid osteoma but >2 cm in diameter
- Posterior spinal elements (common site)
- Less reactive sclerosis; more expansile
- No aspirin-relief (typically)
- May be locally aggressive
G. ENCHONDROMA
| Feature | Detail |
|---|---|
| Site | Short tubular bones of hands/feet (>50%); metaphysis |
| X-ray | Lytic lesion with chondroid calcification (rings/arcs/stippled); expansion in small bones; minimal or no endosteal scalloping |
| DDx Chondrosarcoma | Size >5 cm; deep endosteal scalloping (>2/3 cortical thickness); pain; soft-tissue mass |
| Syndromes | Ollier disease (multiple enchondromatosis - non-hereditary; increased risk of malignancy); Maffucci syndrome (enchondromas + soft-tissue haemangiomas; high malignancy risk) |
H. OSTEOCHONDROMA (MOST COMMON BENIGN BONE TUMOUR)
| Feature | Detail |
|---|---|
| Site | Metaphysis of long bones (distal femur, proximal tibia, proximal humerus); may be pedunculated or sessile |
| X-ray | Bony excrescence with cortex and medullary cavity continuous with parent bone (pathognomonic); grows away from physis; cartilage cap not visible on X-ray |
| MRI | Cartilage cap: T2 bright; measure cap thickness perpendicular to bony component: cap >2 cm = suspicious for secondary chondrosarcoma |
| US | Can measure cap thickness |
| Malignant change | Pain after skeletal maturity; continued growth; cap >2 cm; dispersal of calcifications in soft-tissue mass |
| Multiple hereditary | Multiple hereditary exostoses (MHE) - autosomal dominant; higher risk of malignancy |
I. BONE METASTASES
Most common bone malignancy in >40 years. Bone is 3rd commonest site of metastatic spread (after lung and liver).
"BLT Kidney Thyroid" (Breast, Lung, Thyroid, Kidney, Prostate) = 80% of all bone metastases.
Prevalence at death: Breast + Prostate = 80-85%; Lung = 40-80%; Thyroid = 50-60%; Renal = 20-35%.
Distribution: Axial skeleton (red marrow sites): spine (thoracic > lumbar > cervical), pelvis, proximal femur/humerus, ribs, sternum, skull.
Batson venous plexus = valveless vertebral venous plexus explains spinal predilection.
| Type | Primary Tumour | X-ray Appearance |
|---|---|---|
| Lytic | Kidney, thyroid, lung, breast, GI | Destructive, permeative; no matrix |
| Sclerotic | Prostate (most common), breast (some), carcinoid, medulloblastoma | Dense, "ivory" vertebrae; diffuse sclerosis |
| Mixed | Breast (most common), lung | Both lytic and sclerotic |
Ivory vertebra: Prostate >> lymphoma, Paget disease (common causes); dense sclerotic vertebral body.
Imaging Modalities for Metastases:
| Modality | Role |
|---|---|
| X-ray | First-line; insensitive (requires 30-50% bone loss) |
| Bone scintigraphy (Tc-99m MDP) | Sensitive screening tool; detects osteoblastic activity; false-negative in lytic mets (renal, thyroid, myeloma) |
| CT | Cortical detail; pathological fracture risk; biopsy guidance |
| MRI | Most sensitive for marrow involvement; STIR/T1 for diffuse marrow disease; whole-body MRI replacing bone scan |
| FDG-PET-CT | Functional + anatomical; excellent for lytic mets; less sensitive for purely sclerotic |
| Specific tracers | NaF-PET (bone); PSMA-PET (prostate); I-131 (thyroid) |
Superscan: Diffuse, uniformly increased uptake on bone scan with absent renal activity and absent soft-tissue background - seen with widespread diffuse sclerotic metastases (prostate, breast).
J. MULTIPLE MYELOMA
| Feature | Detail |
|---|---|
| Age | >40 years (97% present after 40) |
| X-ray | "Punched out" lytic lesions (no reactive sclerosis); skull ("pepper-pot" skull); diffuse osteoporosis; vertebral compression fractures |
| Bone scan | Often FALSE NEGATIVE (no osteoblastic reaction) - bone scan not useful! |
| MRI | Modality of choice; focal or diffuse marrow involvement; T1 low SI, T2/STIR high SI |
| Whole-body MRI | Now recommended for staging in guidelines |
| FDG-PET-CT | Detects active disease; used for treatment response |
| X-ray skeletal survey | Traditional staging method |
K. SIMPLE BONE CYST (SBC) / UNICAMERAL BONE CYST
| Feature | Detail |
|---|---|
| Age | Children/adolescents |
| Site | Proximal humerus (most common), proximal femur; metaphyseal; central |
| X-ray | Central lytic lesion, slightly expansile, well-defined margins; thin cortex; may have "fallen fragment" sign (fallen cortical fragment inside cyst after pathological fracture) |
| MRI | Homogeneous fluid signal; T1 low, T2 high; no solid component |
L. ANEURYSMAL BONE CYST (ABC)
| Feature | Detail |
|---|---|
| Age | <20 years |
| Site | Metaphysis long bones; posterior spinal elements |
| X-ray | Eccentric, expansile, "blown out" lytic lesion; thin cortical shell; "soap bubble" |
| MRI | Multiple fluid-fluid levels (FFLs) - blood products of different ages; thin septa; T1 and T2 components from haemorrhage |
| DDx | Telangiectatic osteosarcoma (has solid enhancing nodules); GCT (older age, epiphysis) |
| Primary vs Secondary | Secondary ABC arises in GCT, chondroblastoma, fibrous dysplasia, osteoblastoma |
M. NON-OSSIFYING FIBROMA (NOF)
| Feature | Detail |
|---|---|
| Site | Metaphysis/metadiaphysis; cortically based; distal femur, tibia |
| X-ray | Eccentric, cortically based lytic lesion with sclerotic margin (type 1A); no matrix; multilobulated; "bubbly" |
| MRI | T1/T2 low-intermediate SI (fibrous tissue); no oedema |
| Natural history | Usually involutes spontaneously (fills in with bone) |
| Jaffe-Campanacci | Multiple NOFs + café-au-lait spots |
N. FIBROUS DYSPLASIA
| Feature | Detail |
|---|---|
| Site | Rib (most common overall), proximal femur, skull/facial bones; mono or polyostotic |
| X-ray | "Ground-glass" matrix (hazy, "smoke-filled"); geographic lytic lesion with "rind" of sclerosis (thick sclerotic margin); bone expansion; NO periosteal reaction (unless fractured); "shepherd's crook" deformity (varus proximal femur - late) |
| CT | Best demonstrates ground-glass matrix |
| MRI T1 | Iso-intermediate SI; areas of hyperintensity from haemorrhage |
| MRI T2 | Variable (intermediate-low if fibrous; high if cystic change); FFLs possible |
| Bone scan/Whole body MRI | Polyostotic disease mapping |
| McCune-Albright | Polyostotic FD + café-au-lait spots + precocious puberty (GnRH-independent) |
PART 4: STAGING & BIOPSY IMAGING
Enneking Staging System (Musculoskeletal Tumour Society)
| Stage | Grade | Site | Metastasis |
|---|---|---|---|
| IA | Low grade (G1) | Intracompartmental (T1) | None (M0) |
| IB | Low grade (G1) | Extracompartmental (T2) | None |
| IIA | High grade (G2) | Intracompartmental (T1) | None |
| IIB | High grade (G2) | Extracompartmental (T2) | None |
| III | Any grade | Any | Regional/distant mets |
MRI is essential for Enneking staging - defines compartmental involvement.
Biopsy Planning
- MRI guides biopsy site (viable, non-necrotic, non-haemorrhagic tissue)
- Biopsy tract must lie in the planned surgical resection field
- CT-guided for axial/deep lesions
- US-guided for soft-tissue component
PART 5: RESPONSE TO TREATMENT
Post-chemotherapy MRI assessment:
- Decrease in T2 SI = good response
- Decrease in soft-tissue mass size
- Peripheral ossification around soft-tissue component
- Dynamic contrast-enhanced MRI: reduced enhancement = tumour necrosis
- Histological necrosis >90% = good response (Huvos grading)
EXAM SUMMARY: HIGH-YIELD IMAGING PEARLS
| Feature | Tumour |
|---|---|
| Sunburst periosteal reaction | Osteosarcoma (most classic) |
| Onion-skin periosteal reaction | Ewing sarcoma |
| Codman triangle | Any aggressive tumour (non-specific) |
| Fluid-fluid levels on MRI | ABC (primary), telangiectatic osteosarcoma, GCT |
| "Popcorn" calcification | Enchondroma, chondrosarcoma (chondroid matrix) |
| Ground-glass matrix | Fibrous dysplasia |
| "Sunray" spiculation + metaphyseal mixed lesion around knee | Conventional osteosarcoma |
| Purely lytic + epiphyseal + subchondral + no sclerosis | GCT |
| Punched-out lytic + no reactive sclerosis + false -ve bone scan | Myeloma |
| Diaphyseal lytic + fever + elevated ESR + periosteal reaction | Ewing sarcoma (DDx osteomyelitis) |
| Posterior distal femur surface mass + ossified + middle-aged | Parosteal osteosarcoma |
| Cortical based + small nidus + dense sclerosis + night pain | Osteoid osteoma |
| Endosteal scalloping >2/3 cortical thickness | Chondrosarcoma (not enchondroma) |
| Cartilage cap >2 cm on MRI | Secondary chondrosarcoma from osteochondroma |
| "Fallen fragment" sign | Simple bone cyst |
| Shepherd's crook deformity | Fibrous dysplasia (proximal femur) |
| Ivory vertebra | Prostate metastasis, Paget, lymphoma |
| Superscan on bone scan | Diffuse sclerotic metastases |
| False-negative bone scan | Myeloma, lytic metastases (renal, thyroid) |
Source: Grainger & Allison's Diagnostic Radiology, Chapters 40 (Benign Bone Tumours) & 41 (Malignant Bone Tumours), 6th/current edition
Retroperitoneal lesions in detail
Finding Sources
Finding Sources
Your credits are exhausted. You can purchase a top-up or subscribe to a plan to continue using Orris. If you're already subscribed, your daily credits will reset tomorrow.
This is a shared conversation. Sign in to Orris to start your own chat.