
epidemiology of tetanus
tetanus epidemiology incidence global
tetanus global epidemiology incidence 2024 WHO statistics
https://ourworldindata.org/tetanus
tetanus global distribution neonatal tetanus epidemiology map

Geospatial epidemiology visualization of leprosy prevalence at a global scale. This global choropleth map uses 2016 data from the World Health Organization and related health authorities to depict registered leprosy cases per 10,000 population. High-prevalence clusters appear in the Indian subcontinent, parts of Brazil and Indonesia, with substantial tropical distribution extending into other endemic regions; several African countries show lower to moderate rates or data limitations. The color ramp typically ranges from light tones in low-prevalence areas to deep red in countries with the highest reported burden, enabling rapid visual assessment of endemic regions. The map integrates standard geographic boundaries and presents a snapshot suitable for public health surveillance, travel medicine risk assessment, epidemiology education, and resource planning for diagnosis, treatment, and prevention programs. Limitations include reporting bias, variation in case definitions, and differences in surveillance capacity across countries; thus, prevalence per 10,000 is influenced by case finding and health system coverage. This visualization supports hypothesis generation about transmission dynamics, regional health priorities, and the impact of leprosy control initiatives over time. It can be used in academic settings, policy discussions, and clinical education to contextualize individual patient presentations within population-level risk landscapes.
Educational composite illustrating the global epidemiology and clinical pathology of Angiostrongylus cantonensis, the primary cause of eosinophilic meningitis in humans. Panel (a) is a global distribution map highlighting regions endemic to the parasite. Green-shaded areas (including parts of North America, South America, and East Asia) indicate confirmed presence with available cox1 genetic sequences, while red-shaded areas (sections of South America, Africa, South Asia, and Australia) indicate presence without cox1 genetic confirmation. Black stars mark specific study collection sites: Hawaii (HAW.1), Fatu Hiva (FH.1), Tenerife (TEN.1), and Sydney (SYD.1). Panel (b) is a high-magnification clinical photograph of a dissected pulmonary artery from a Polynesian rat (Rattus exulans), a definitive host. It demonstrates multiple adult female worms within the vascular lumen. The worms exhibit a characteristic 'barber-pole' appearance due to the intertwining of the dark intestine and white uterine tubes. A 2 mm scale bar is provided for morphological reference. The image is designed for parasitology and infectious disease education regarding zoonotic foodborne nematodiasis.
This infographic is a world cartogram illustrating the global distribution of human poverty according to the United Nations Development Programme (UNDP). In this visualization, the land area of each territory is distorted to be proportional to its share of the global poverty index rather than its true geographic size. This clinical epidemiology tool uses a heat transfer algorithm to represent the density of the variable. Visually, the map shows a massive expansion of the African continent (shaded in red and pink) and South Asia (including India, Pakistan, and Bangladesh, shaded in yellow and orange), indicating a high prevalence of poverty-related health risks. Conversely, North America and Europe (shaded in blue and purple) are significantly diminished, appearing as thin slivers, which reflects their lower proportion of the global poverty index. This representation is used in public health education to demonstrate the correlation between socioeconomic status and health outcomes, such as mortality from preventable nutritional deficiencies and communicable diseases.
Epidemiology of Tetanus
1. Causative Agent and Reservoir
- Goldman-Cecil Medicine, p. 1334
2. Global Burden
Overall magnitude
| Metric | Value |
|---|---|
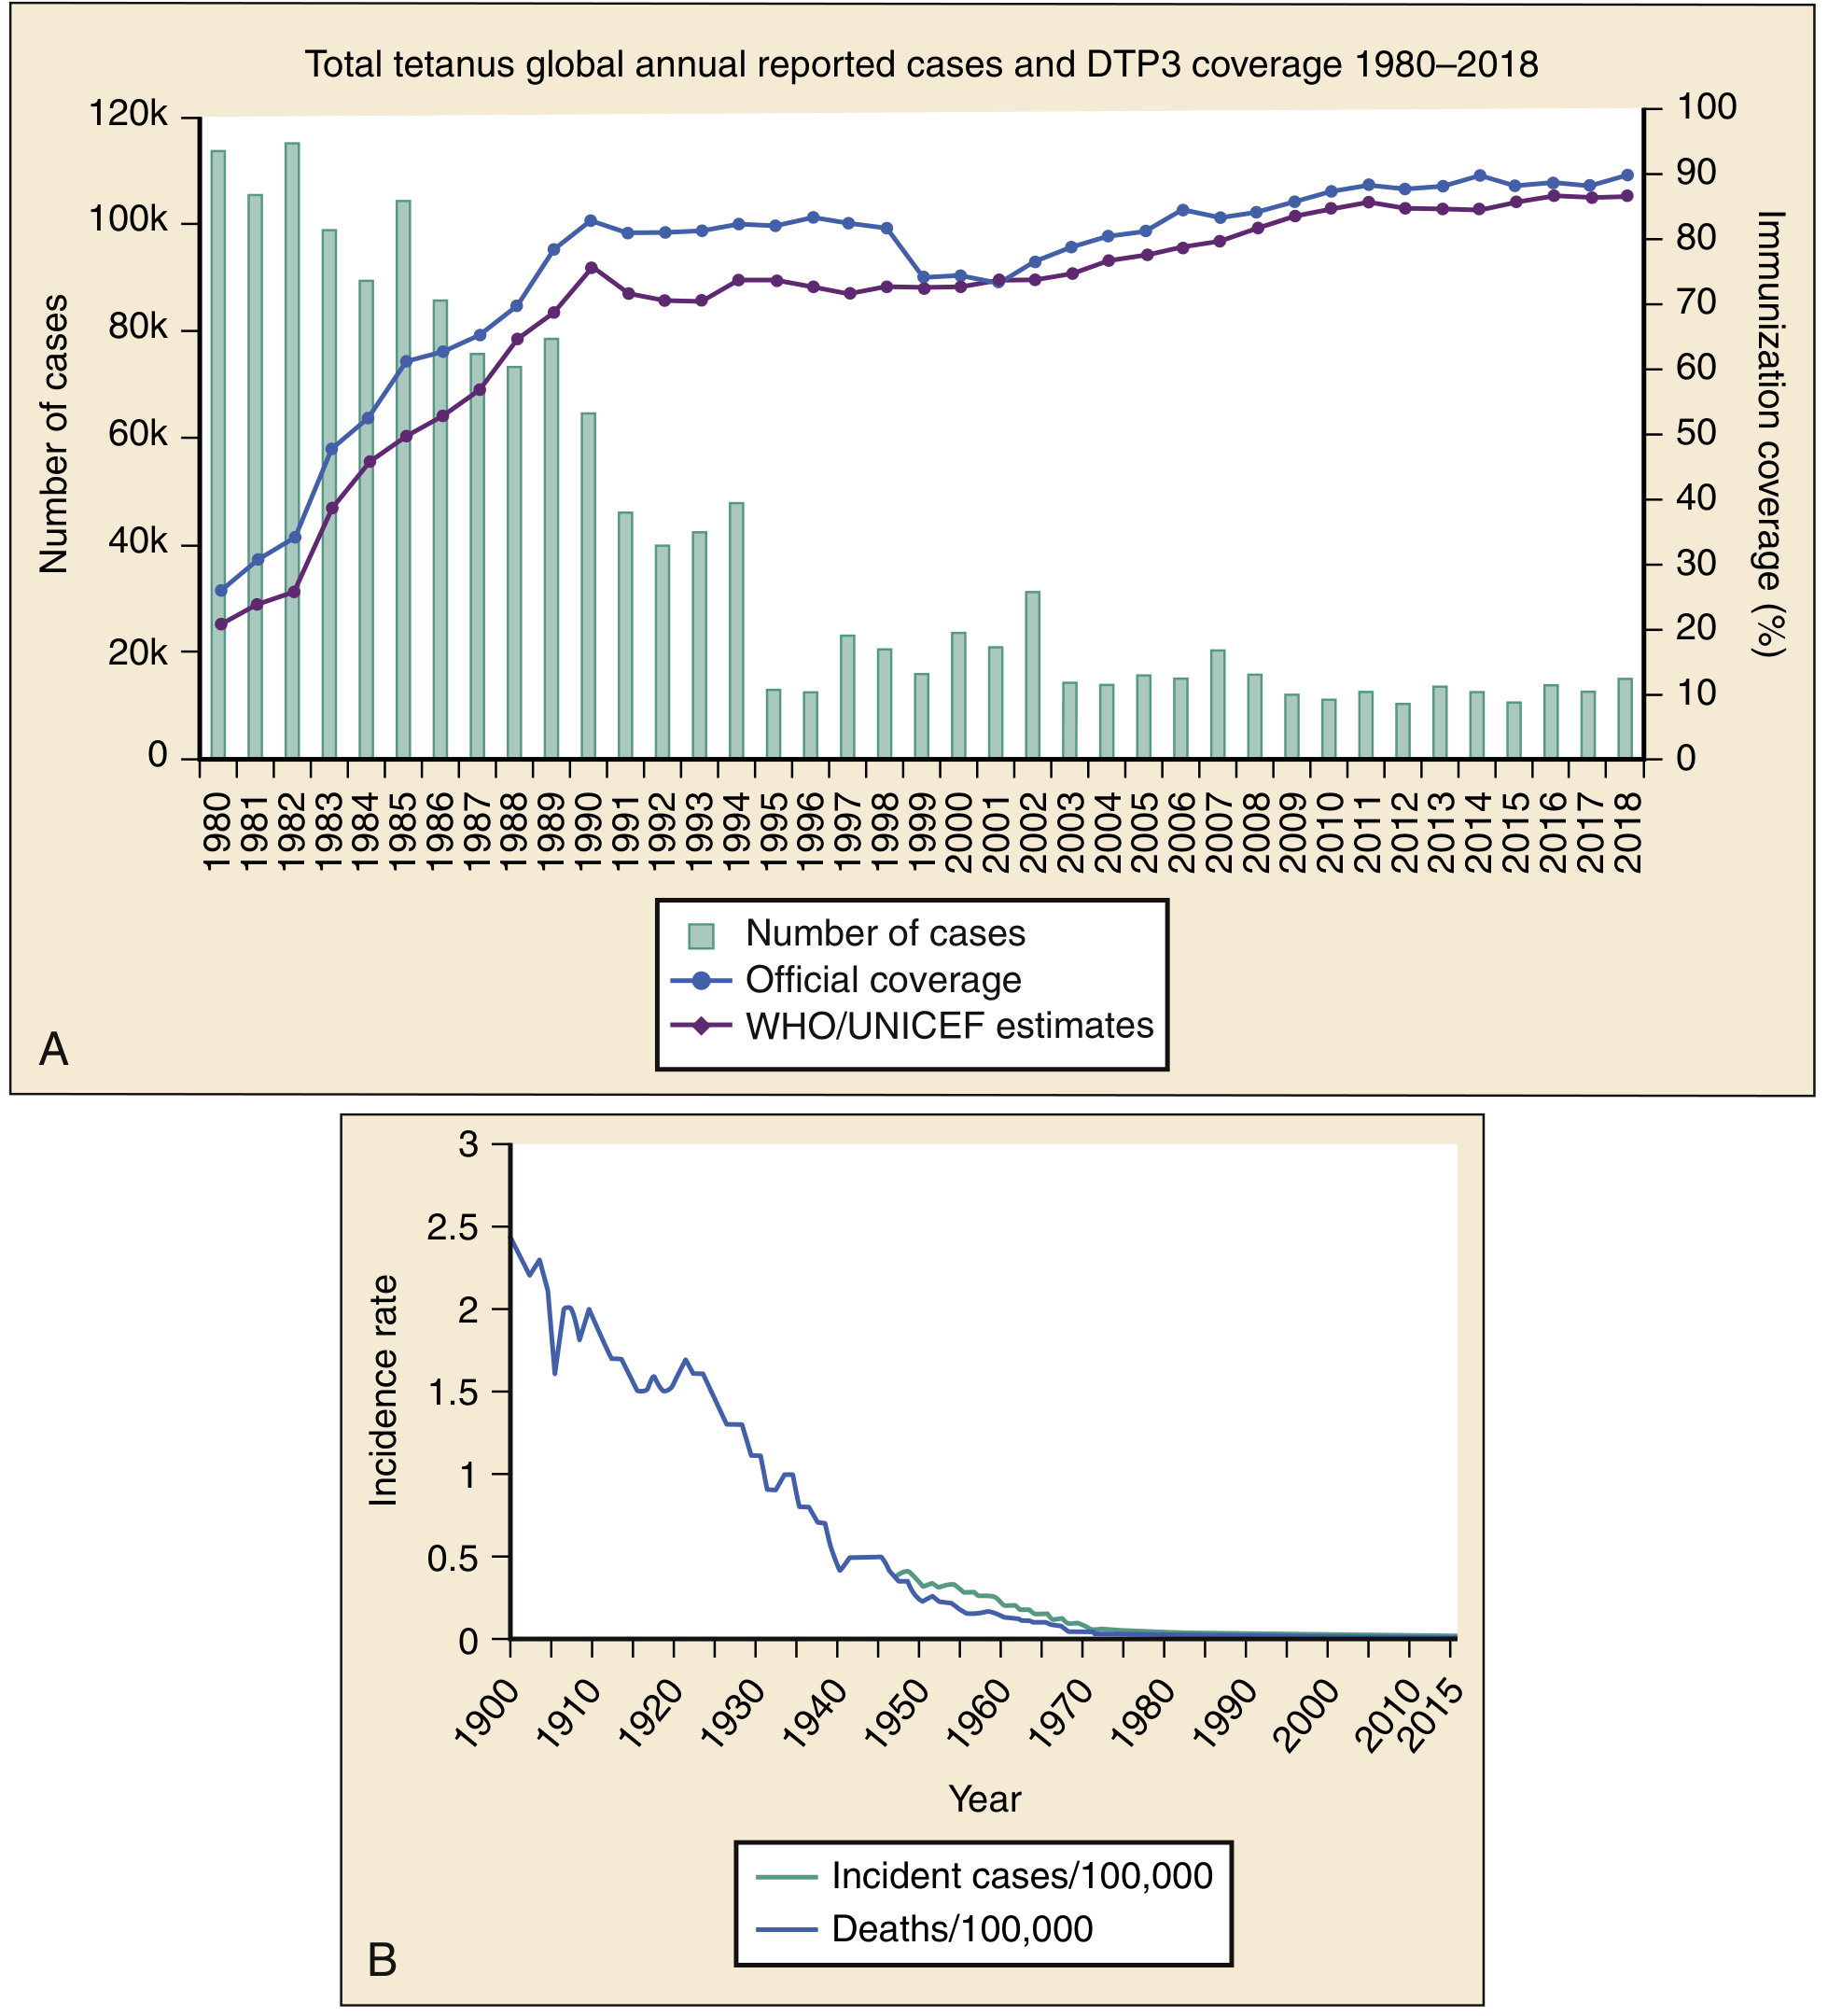
| WHO reported cases (2018) | ~15,100 |
| WHO reported cases (2023) | ~16,300 |
| WHO reported cases (2024) | ~17,670 |
| Estimated unreported cases | Tens of thousands annually |
| Annual deaths (current estimate) | ~50,000 globally |
| Neonatal deaths (WHO estimate) | ~34,000 annually |
- Rosen's Emergency Medicine, p. 2589
3. Geographic Distribution
- Sub-Saharan Africa and South Asia - these two regions account for the majority of global cases and deaths
- South Asia's burden has fallen massively (from ~400,000 infections in 1990 to ~30,000 in 2019), but it remains the highest-burden region
- Disease is more common in warm, damp climates and highly cultivated rural areas of developing countries
- Cold regions have relatively low rates
- Countries with low immunization coverage and poor sanitation carry the greatest burden
4. Neonatal Tetanus (Tetanus Neonatorum)
-
An estimated 60,000 neonatal cases occur annually in low-income countries (Goldman-Cecil) with ~34,000 deaths (WHO/Rosen's estimate)
-
Caused by contamination of the umbilical cord during unclean delivery (using non-sterile instruments, applying contaminated substances to the cord stump)
-
Most affected infants are 6-9 days old at presentation - with a history of continuous crying, then cessation of sucking, followed by convulsions
-
Case fatality rates are extremely high in resource-poor settings
-
Prevention: maternal immunization with tetanus toxoid, clean delivery practices, and proper cord care
-
Creasy & Resnik's Maternal-Fetal Medicine, p. 4132-4136
5. Risk Factors and Portals of Entry
- Puncture wounds (e.g., nail injuries, needle sticks)
- Lacerations and abrasions
- Contaminated soil wounds
- Chronic skin ulcers, pressure sores
- Burns
- Inadequate primary immunization (the dominant risk factor)
- Waning immunity (especially in adults >65 years)
- Intravenous drug use (accounts for ~50% of US cases)
- Diabetes mellitus
- Immunosuppression
- Obstetric/postabortal tetanus (uterine trauma, especially in developing countries)
- Postoperative tetanus after intestinal procedures
- Foreign bodies, otitis media, corneal abrasions, dental procedures
- Rosen's Emergency Medicine, p. 2589
6. Age Distribution
- In developing countries, neonates bear the highest burden (tetanus neonatorum)
- In the US and other high-income countries, cases have shifted to older adults: those >65 years have the highest incidence (0.23 cases/million population) due to waning vaccine immunity
- Cases also concentrate in injection drug users (50% of US cases)
- Children vaccinated under national programs are well protected, but unvaccinated or incompletely vaccinated adults remain vulnerable
7. Case Fatality Rate (CFR)
| Group | CFR |
|---|---|
| Overall (US) | ~18% |
| Age >70 years (US) | Approaches 50% |
| Obstetric tetanus | Often >50% |
| Neonatal tetanus (low-income settings) | Very high (majority die without ICU care) |
8. Transmission
- Not person-to-person - tetanus is NOT transmitted between humans
- Infection results from contamination of wounds with C. tetani spores from the environment (soil, feces, dust)
- Entry requires a wound site with low oxygen tension (devitalized tissue, deep punctures, necrotic areas)
- This explains why tetanus cannot be eradicated - the reservoir is environmental, not human
9. Impact of Vaccination
- Global DTP3 coverage rose from <25% in 1980 to ~88% by 2018, with a corresponding steep fall in cases
- In the US, cases fell from ~600/year pre-vaccine era to ~30/year currently
- MNT elimination (defined as <1 case/1,000 live births per district) has been achieved in many countries through maternal immunization campaigns
- EU/EEA DTP3 coverage averaged 92.8% in 2023 (range: Romania 79% to Luxembourg/Portugal/Hungary 99%)
- Goldman-Cecil Medicine, p. 1330-1340
- Rosen's Emergency Medicine, p. 2589-2590
- Creasy & Resnik's Maternal-Fetal Medicine, p. 4112-4136
- Bailey & Love's Short Practice of Surgery, 28th Ed.
- WHO Immunization Data Portal - Tetanus
- Our World in Data - Tetanus
epidemiology of tetanus
tetanus epidemiology incidence global
tetanus global epidemiology WHO 2024 2025 incidence deaths statistics
https://www.thelancet.com/journals/lancet/article/PIIS0140-6…
Epidemiology of Tetanus
Agent and Environmental Reservoir
- Found in up to 25% of soil samples, especially where animal manure has been applied
- Present in feces of domestic and farm animals, poultry
- Carried asymptomatically in the colon of ~10% of humans
- Spores survive indefinitely in the environment
- Goldman-Cecil Medicine, p. 1332
Global Burden
| Metric | Figures |
|---|---|
| WHO reported cases (2018) | ~15,100 |
| WHO reported cases (2023) | ~16,300 |
| WHO reported cases (2024) | ~17,670 |
| Estimated annual global deaths | 30,000-50,000 |
| Estimated annual neonatal deaths | ~34,000 |
| Estimated neonatal cases in LMICs | ~60,000/year |
- Rosen's Emergency Medicine, p. 2589
- Goldman-Cecil Medicine, p. 1334
Geographic Distribution
-
Sub-Saharan Africa and South Asia account for the majority of global cases and deaths
-
South Asia: incidence fell from ~400,000 new infections in 1990 to ~30,000 in 2019 - still the highest-burden region
-
Disease is most common in warm, damp climates and highly cultivated rural areas of developing nations
-
Cold regions have low rates
-
High-income countries (US, EU) have near-eliminated the disease through routine immunization
-
Rosen's Emergency Medicine, p. 2589; Our World in Data - Tetanus
Epidemiology in High-Income Countries
- Pre-vaccine era (1940s): ~4 cases/million population
- By 2010: <0.01 cases/million population
- Currently: ~20-30 reported cases/year
- US mortality among 2009-2017 cases: 7% overall
- Adult vaccination coverage (18-64 yrs): only 63%; adults ≥65 yrs: only 61% (CDC data)
-
Average DTP3 coverage: 92.8% (range: Romania 79% - Luxembourg/Portugal/Hungary 99%)
-
Campbell's Operative Orthopaedics 15th Ed, p. 3279-3284; Rosen's Emergency Medicine, p. 2589
Neonatal Tetanus (Tetanus Neonatorum)
- Results from umbilical cord contamination during unclean deliveries (non-sterile instruments, application of contaminated substances to cord stump)
- Most affected neonates present at 6-9 days of age with a history of continuous crying for up to 48 hours, then cessation of sucking, convulsions, and fever
- Clinical features are more severe than in adults: prominent dysphagia, respiratory complications, high fever, rapid fulminating course
- Case fatality is very high in resource-poor settings without ICU access
- Maternal tetanus (post-delivery or abortion): CFR often exceeds 50%
- Creasy & Resnik's Maternal-Fetal Medicine, p. 4132-4136
Risk Factors and Portals of Entry
- Inadequate primary immunization (dominant risk factor worldwide)
- Waning immunity in adults (especially those >65 years) - the primary driver in high-income countries
- Intravenous drug use - accounts for ~50% of US cases
- Diabetes mellitus
- Immunosuppression
| Category | Examples |
|---|---|
| Traumatic wounds | Puncture wounds, lacerations, abrasions, crush injuries |
| Tetanus-prone wound features | Depth ≥1 cm, >6 hours old, bite injuries, stellate/avulsion wounds, burns, frostbite |
| Drug-related | IV injection sites, skin-popping |
| Obstetric | Childbirth, abortion, umbilical cord (neonates) |
| Surgical | Intestinal operations, abdominal/pelvic procedures |
| Miscellaneous | Chronic ulcers, otitis media, dental procedures, corneal abrasions, foreign bodies |
- Rosen's Emergency Medicine, p. 2588; Campbell's Operative Orthopaedics, p. 3306-3307
Age Distribution
| Setting | Most Affected Age Group |
|---|---|
| Low/middle-income countries | Neonates (tetanus neonatorum) |
| USA/high-income countries | Adults >65 years (0.23 cases/million - highest incidence in the US) + injection drug users |
| General unvaccinated/under-vaccinated | Any age |
- Rosen's Emergency Medicine, p. 2586
Case Fatality Rates
| Population | CFR |
|---|---|
| Overall (USA, 2009-2017) | 7% |
| Overall (USA, Rosen's data) | ~18% |
| Patients >70 years | Approaches 50% |
| Obstetric/puerperal tetanus | Often >50% |
| Neonatal tetanus (low-resource settings) | Very high without ICU |
| Fully vaccinated patients | Cases reported; no deaths |
Impact of Vaccination - Key Epidemiologic Points
- Tetanus toxoid is one of the most effective vaccines ever developed
- Global DTP3 coverage rose from <25% (1980) to >88% (2018) - directly mirroring case decline
- Immunity is NOT lifelong: booster doses (Td) are needed every 10 years; poor adult compliance is the main driver of residual cases in high-income settings
- Maternal and neonatal tetanus (MNT) elimination (goal: <1 case/1,000 live births per district) has been achieved in many countries through targeted maternal immunization campaigns
- Tetanus can never be eradicated due to the environmental spore reservoir - surveillance and vaccination must be permanent
- Goldman-Cecil Medicine (International Edition), p. 1330-1340
- Rosen's Emergency Medicine: Concepts and Clinical Practice, p. 2589-2590
- Creasy & Resnik's Maternal-Fetal Medicine, p. 4112-4136
- Campbell's Operative Orthopaedics 15th Ed 2026, p. 3276-3307
- WHO Immunization Data Portal
- The Lancet (2025) - Tetanus review