
Write assignment on visual pathway
visual pathway diagram optic nerve chiasm tract radiation cortex
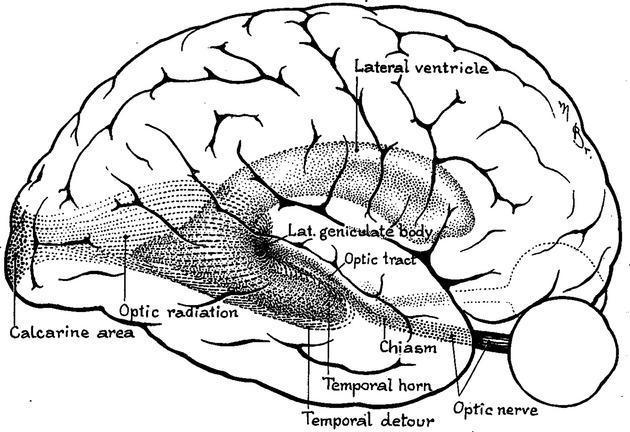
This anatomical diagram provides a lateral view of the human brain, specifically illustrating the visual pathway and the spatial distribution of the optic radiation. Based on Harvey Cushing's 1921 drawing, the illustration highlights the geniculocalcarine tract from its origin at the lateral geniculate body (LGB) to its termination in the primary visual cortex (calcarine area). A key educational focus is the 'temporal detour' or Meyer’s loop, where the ventral fibers of the optic radiation arc anteriorly around the temporal horn of the lateral ventricle before heading posteriorly toward the occipital lobe. Other labeled anatomical landmarks include the optic nerve, optic chiasm, optic tract, and the main body of the lateral ventricle. This diagram is significant for understanding neuroanatomy related to visual field deficits (e.g., quadrantanopia) that may arise from lesions or neurosurgical procedures in the temporal lobe, such as epilepsy surgery or tumor resection.
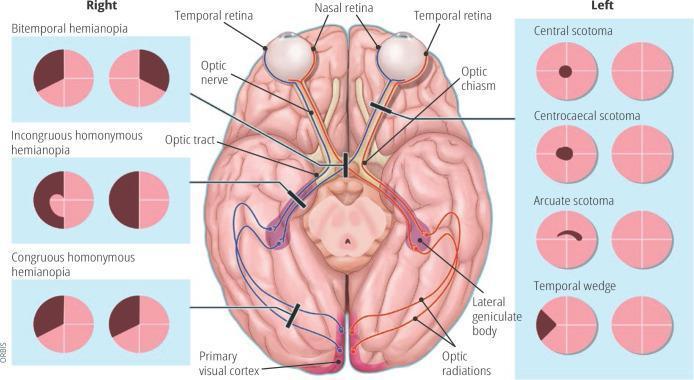
Anatomical diagram and educational infographic detailing the human visual pathway and associated visual field defects. The central illustration shows a superior (dorsal) view of the brain, highlighting the optic nerve, optic chiasm (decussation point), optic tract, lateral geniculate body, optic radiations, and the primary visual cortex in the occipital lobes. Pathways are color-coded (red and blue) to demonstrate the transition from nasal and temporal retinal fibers to the contralateral and ipsilateral hemispheres. Black lesion bars indicate specific sites of damage along this pathway. Flanking the central diagram are clinical representations of visual field loss patterns. The 'Right' panel displays bilateral defects including bitemporal hemianopia, incongruous homonymous hemianopia, and congruous homonymous hemianopia. The 'Left' panel displays unilateral or localized defects including central scotoma, centrocaecal scotoma, arcuate scotoma, and temporal wedge. This diagram serves as a neuro-ophthalmological guide for localizing lesions within the central nervous system based on perimetry findings.
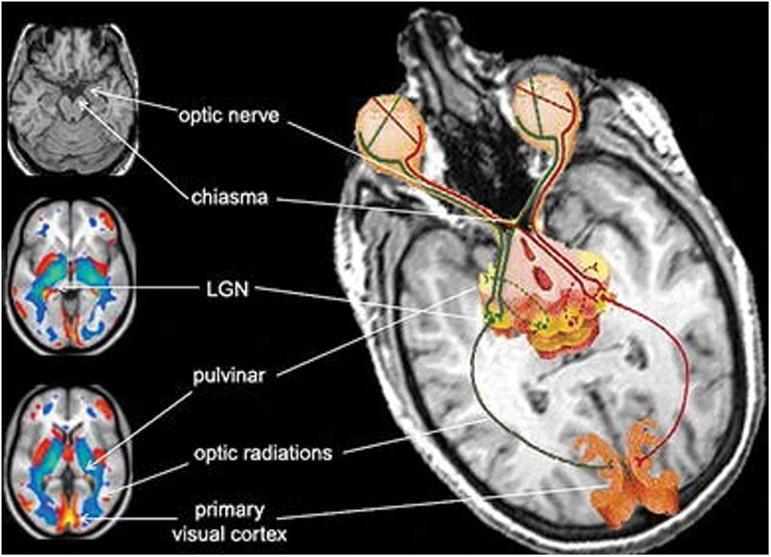
This composite diagnostic and pathophysiology diagram illustrates the anatomical structures and neuroplastic changes of the human visual pathway, specifically focusing on atrophy in congenitally blind individuals. The primary image is a transversal T1-weighted MRI slice with a superimposed schematic of the visual system. Key structures are labeled: the optic nerves originating from the globes, the optic chiasm, the lateral geniculate nucleus (LGN) and pulvinar of the thalamus, the optic radiations (geniculocalcarine tract), and the primary visual cortex in the occipital lobe. Three smaller axial brain scans on the left provide additional context. The top scan is a structural MRI identifying the optic nerve and chiasm. The middle and bottom scans are color-coded statistical parametric maps (likely VBM or PET) showing regional brain volume differences. Blue shading indicates areas of significant gray matter volume reduction (atrophy) in the thalamic relays and visual cortex, while red/yellow highlights show areas of metabolic or structural divergence. This visual is designed for advanced medical education regarding neuroanatomy and the effects of long-term sensory deprivation on the central nervous system.
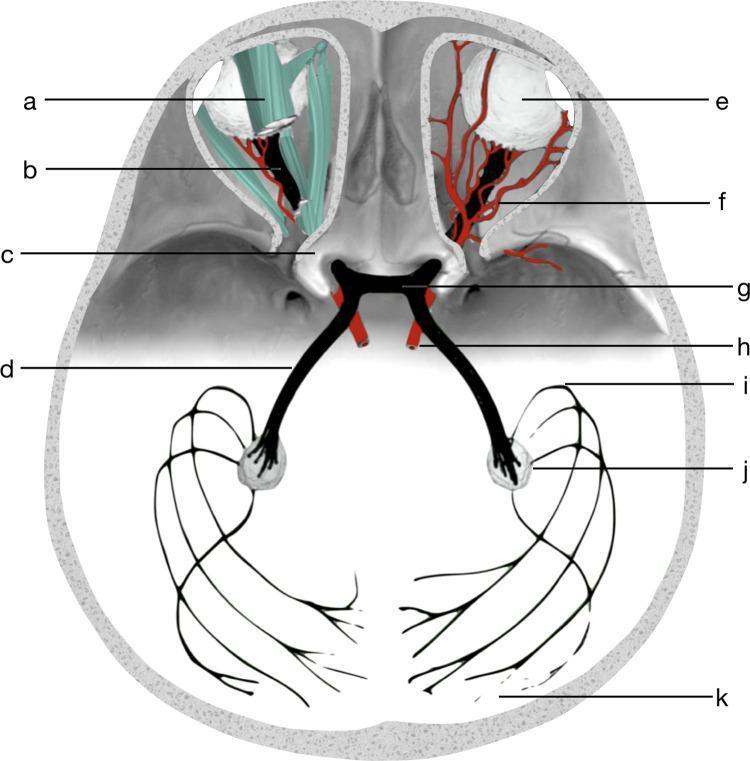
An anatomical diagram illustrating the human visual pathway and its surrounding cranial structures. The schematic highlights the progression from the anterior globes (eyeballs) to the posterior visual cortex. Key structures labeled include the optic nerves (b) extending from the eyeballs, passing through the bony optic canals (c) to converge at the central optic chiasm (g). The diagram demonstrates the decussation of fibers continuing as optic tracts (d) toward the lateral geniculate nuclei (j). The final segment depicts the optic radiation (k), including Meyer’s loop (i), projecting to the primary visual cortex. Surrounding clinical anatomy is integrated, showing the extraocular muscles and tendons (a), orbital blood vessels (f), and the ophthalmic artery (h) in close proximity to the neural structures. This visual summarizes the neuroanatomical relationships essential for understanding visual field defects and imaging diagnostics like CT and MRI tractography.
visual field defects lesions optic nerve chiasm tract bitemporal hemianopia homonymous
Anatomical diagram and educational infographic detailing the human visual pathway and associated visual field defects. The central illustration shows a superior (dorsal) view of the brain, highlighting the optic nerve, optic chiasm (decussation point), optic tract, lateral geniculate body, optic radiations, and the primary visual cortex in the occipital lobes. Pathways are color-coded (red and blue) to demonstrate the transition from nasal and temporal retinal fibers to the contralateral and ipsilateral hemispheres. Black lesion bars indicate specific sites of damage along this pathway. Flanking the central diagram are clinical representations of visual field loss patterns. The 'Right' panel displays bilateral defects including bitemporal hemianopia, incongruous homonymous hemianopia, and congruous homonymous hemianopia. The 'Left' panel displays unilateral or localized defects including central scotoma, centrocaecal scotoma, arcuate scotoma, and temporal wedge. This diagram serves as a neuro-ophthalmological guide for localizing lesions within the central nervous system based on perimetry findings.
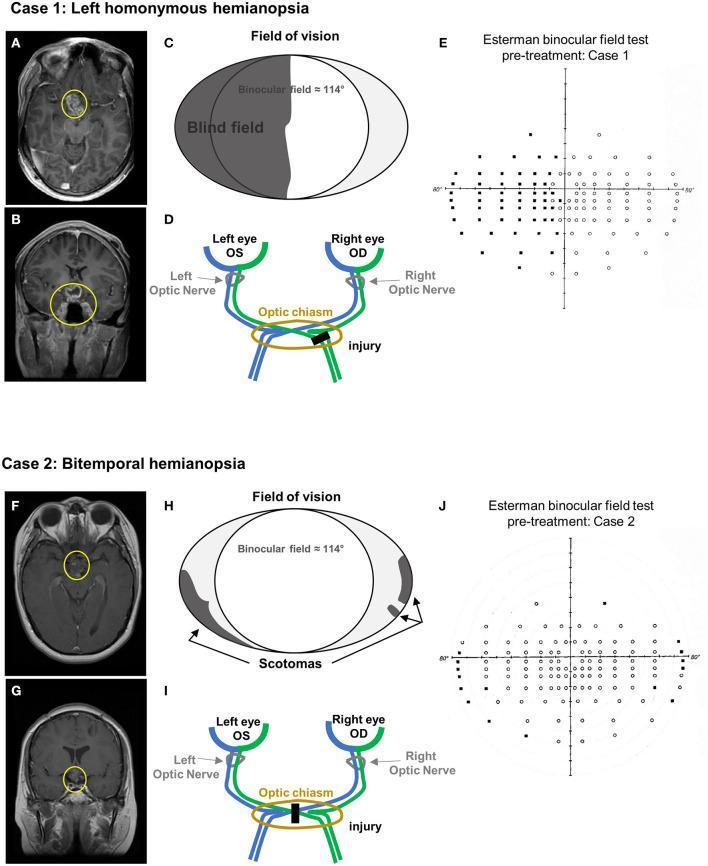
This composite educational image presents two clinical cases correlating neuroimaging findings with visual field defects. Case 1 (A-E) depicts left homonymous hemianopia. T1-weighted contrast-enhanced MRI in axial (A) and coronal (B) planes shows a heterogeneously enhancing mass in the suprasellar region (yellow circles), involving the optic chiasm and third ventricle floor. Schematic (C) and anatomical diagram (D) illustrate the corresponding lesion in the right optic tract and the resulting left hemifield blindness. The Esterman binocular field test (E) confirms significant unseen points (black dots) in the left visual field. Case 2 (F-J) depicts bitemporal hemianopia. MRI scans (F, G) reveal a residual suprasellar mass (yellow circles) inseparable from the hypothalamus and optic chiasm. The schematic (H) and optic pathway diagram (I) show a midline chiasmal injury, leading to peripheral scotomas. The Esterman test (J) demonstrates peripheral blind spots consistent with bitemporal vision loss. This comparison illustrates how specific anatomical injuries along the optic pathway correlate with distinct patterns of binocular visual impairment.
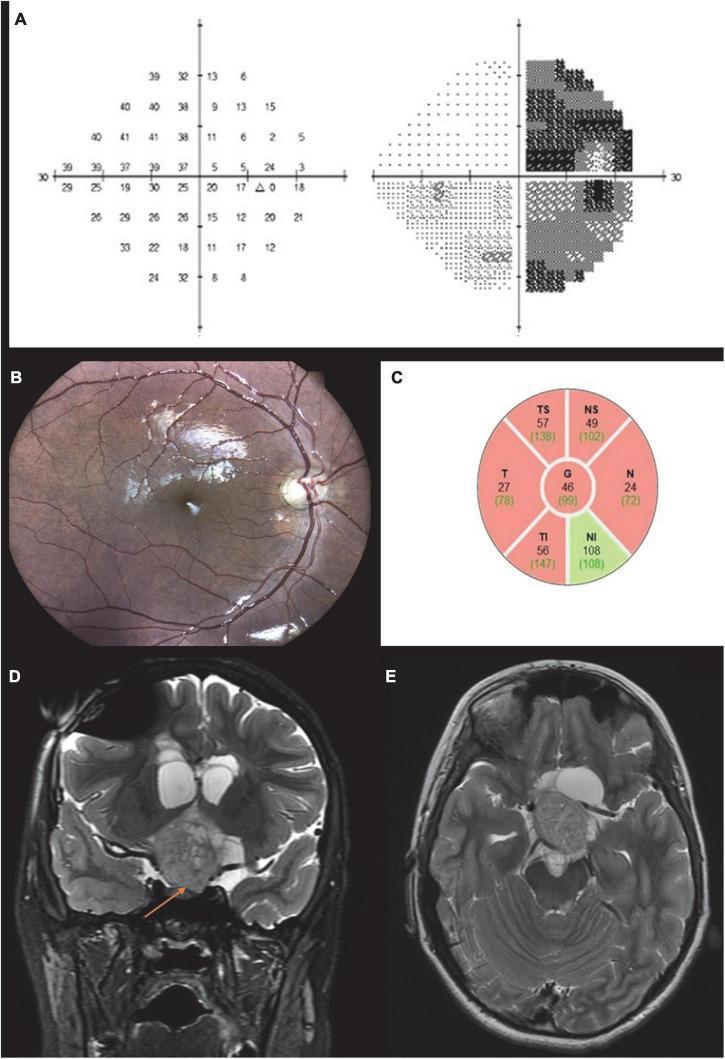
This composite medical image illustrates clinical and diagnostic findings of an optic tract lesion causing visual field and structural changes. Panel A displays a Humphrey automated perimetry result for the right eye, showing a temporal hemianopia (right hemianopia) with dense vision loss respecting the vertical meridian. Panel B is a fundus photograph of the right eye demonstrating 'bow-tie' atrophy of the optic disc, characterized by horizontal pallor involving the nasal and temporal sectors. Panel C provides an Optical Coherence Tomography (OCT) retinal nerve fiber layer (RNFL) map, showing significant thinning (indicated in red) in the temporal, nasal, and superior sectors, correlating with the visual field loss. Panels D and E show T2-weighted MRI scans in coronal and axial views, respectively, revealing a large heterogeneous mass at the optic chiasm and left optic tract, compressing the third ventricle. The collection demonstrates the characteristic clinical correlation between chiasmal/retrochiasmal lesions, specific patterns of optic nerve atrophy, and corresponding visual field defects.
The Visual Pathway: A Comprehensive Assignment
1. Introduction
2. Overview of the Visual Pathway
- Retina (photoreceptors → bipolar cells → retinal ganglion cells)
- Optic nerve (CN II)
- Optic chiasm
- Optic tract
- Lateral geniculate nucleus (LGN) of the thalamus
- Optic radiations (geniculocalcarine tract)
- Primary visual cortex (V1, striate cortex - calcarine sulcus, occipital lobe)
3. The Retina: Origin of the Visual Signal
3.1 Photoreceptors
- Rods - 120 million; sensitive to low-light (scotopic) conditions; concentrated in the peripheral retina
- Cones - ~6 million; responsible for color and high-acuity (photopic) vision; densest at the fovea centralis
3.2 Retinal Cell Layers and Processing
3.3 Parallel Processing Begins Here
3.4 Retinal Ganglion Cell Types
| Cell Type | Properties | Pathway |
|---|---|---|
| M cells (Magnocellular) | Large, fast-conducting; motion, depth, low contrast | Magnocellular (M) pathway |
| P cells (Parvocellular) | Small, slow; fine detail, color | Parvocellular (P) pathway |
| K cells (Koniocellular) | Intermediate; color (blue-yellow) | Koniocellular (K) pathway |
4. The Optic Nerve (Cranial Nerve II)
- Acquires a myelin sheath from oligodendrocytes (not Schwann cells), making it a true CNS white matter tract - Gray's Anatomy for Students, p. 1346
- Covered by the cranial meninges (dura, arachnoid, pia), with subarachnoid space continuous with the intracranial space - this is why raised ICP causes papilloedema
- Passes through the optic canal in the lesser wing of the sphenoid bone
- Total length ~50 mm (intraocular 1 mm, intraorbital 25 mm, intracanalicular 9 mm, intracranial 16 mm)
- Contains approximately 1.2 million ganglion cell axons per nerve
5. The Optic Chiasm
5.1 Fiber Decussation
- Axons from the nasal (medial) retina cross to the contralateral optic tract
- Axons from the temporal (lateral) retina remain ipsilateral (do not cross)
5.2 Why Does Nasal Retina Cross?
6. The Optic Tract
- Each optic tract contains fibers from the ipsilateral temporal retina AND the contralateral nasal retina
- Therefore, each tract carries information from the entire contralateral visual hemifield
- The optic tracts curve posterolaterally around the cerebral peduncles (midbrain) to reach the thalamus
7. The Lateral Geniculate Nucleus (LGN)
7.1 Laminar Organization
| Layers | Cell Type | Input |
|---|---|---|
| 1, 2 | Magnocellular (M) | Contralateral (1) and ipsilateral (2) eye |
| 3, 4, 5, 6 | Parvocellular (P) | Alternating ipsilateral/contralateral eye |
| K layers (between each) | Koniocellular | Mixed inputs |
- Layers 1, 4, 6 receive input from the contralateral eye
- Layers 2, 3, 5 receive input from the ipsilateral eye
7.2 Non-Geniculate Targets (~10% of fibers)
- Pretectal area and Edinger-Westphal nucleus - pupillary light reflex (afferent limb)
- Superior colliculus - reflex eye movements, orienting responses
- Suprachiasmatic nucleus (SCN) of hypothalamus - circadian rhythms (via melanopsin-containing intrinsically photosensitive RGCs)
- Accessory optic nuclei - optokinetic reflexes
8. Optic Radiations (Geniculocalcarine Tract)
8.1 Three Divisions
| Division | Fibers | Route | Visual Field Represented |
|---|---|---|---|
| Superior (dorsal bundle) | Upper retinal fibers (= lower visual field) | Through parietal lobe | Contralateral inferior quadrant |
| Middle | Macular/central fibers | Direct posterior route | Central vision |
| Inferior (ventral bundle = Meyer's loop) | Lower retinal fibers (= upper visual field) | Sweeps anteriorly around temporal horn of lateral ventricle | Contralateral superior quadrant |
8.2 Meyer's Loop (Archambault-Meyer Loop)
- First described by Harvey Cushing
- A temporal lobe lesion (e.g., temporal lobectomy for epilepsy, tumor) interrupts Meyer's loop
- Produces a contralateral superior homonymous quadrantanopia ("pie in the sky" defect) - Adams and Victor's Neurology, p. 270
9. Primary Visual Cortex (V1 / Striate Cortex / Area 17)
9.1 Retinotopic Organization
- Upper optic radiations terminate on the upper lip (cuneus) of the calcarine fissure → inferior visual field
- Lower optic radiations terminate on the lower lip (lingual gyrus) → superior visual field
- The posterior pole of the occipital lobe represents the macula (fovea) - Gray's Anatomy for Students, p. 1347
- The peripheral retina is represented anteriorly
9.2 Cortical Magnification
9.3 Ocular Dominance Columns
9.4 Orientation Selectivity
10. Higher Visual Processing: Dorsal and Ventral Streams
| Stream | Name | Pathway | Function |
|---|---|---|---|
| Dorsal stream | "Where/How" pathway | V1 → V2 → V5 (MT) → parietal cortex | Motion, spatial location, visuomotor guidance |
| Ventral stream | "What" pathway | V1 → V2 → V4 → IT (inferotemporal cortex) | Object recognition, color, face recognition |
- V4 - color processing; lesion causes cerebral achromatopsia
- V5/MT - motion processing; lesion causes akinetopsia (inability to perceive motion)
- IT cortex - object recognition; lesion causes visual agnosia
11. Visual Field Defects and Lesion Localization
| Site of Lesion | Visual Field Defect | Common Cause |
|---|---|---|
| Optic nerve | Monocular visual loss / central scotoma | Optic neuritis, glaucoma, ischemia |
| Optic chiasm (central) | Bitemporal hemianopia | Pituitary adenoma (most common), craniopharyngioma, meningioma, aneurysm |
| Optic tract | Incongruous contralateral homonymous hemianopia | Craniopharyngioma, aneurysm |
| Meyer's loop (temporal lobe) | Contralateral superior quadrantanopia ("pie in the sky") | Temporal lobe tumor, epilepsy surgery |
| Parietal radiation | Contralateral inferior quadrantanopia ("pie on the floor") | Parietal lobe tumor, stroke |
| Optic radiation / occipital cortex | Congruous contralateral homonymous hemianopia ± macular sparing | Posterior cerebral artery infarction |
| Occipital pole (macular cortex) | Central homonymous scotoma | Small occipital infarct |
- Congruous defects (identical in both eyes) = more posterior lesion (occipital cortex)
- Incongruous defects (different in each eye) = more anterior lesion (optic tract, proximal radiations)
- Macular sparing in occipital infarcts = dual blood supply to the posterior pole from both PCA and MCA
12. The Pupillary Light Reflex
- Light in ONE eye causes bilateral constriction (direct and consensual responses) due to bilateral EW input
- An afferent pupillary defect (APD/Marcus Gunn pupil) - reduced direct response with intact consensual - indicates an ipsilateral optic nerve or retinal lesion
- A relative APD (RAPD) is tested with the swinging flashlight test
13. Blood Supply of the Visual Pathway
| Structure | Blood Supply |
|---|---|
| Optic nerve (intraocular) | Central retinal artery (branch of ophthalmic artery) |
| Optic nerve (orbital) | Ophthalmic artery branches |
| Optic chiasm | Anterior communicating artery, ICA |
| Optic tract | Anterior choroidal artery, posterior communicating artery |
| LGN | Anterior choroidal artery, posterior choroidal arteries |
| Optic radiations | Middle cerebral artery (anterior), posterior cerebral artery (posterior) |
| Visual cortex | Posterior cerebral artery (PCA); occipital pole also supplied by MCA |
14. Clinical Applications
14.1 Pituitary Adenoma
14.2 Posterior Cerebral Artery Infarction
14.3 Multiple Sclerosis (Optic Neuritis)
14.4 Temporal Lobe Epilepsy Surgery
14.5 Glaucoma
15. Summary Table: The Visual Pathway at a Glance
| Structure | Location | Cell Type | Key Features |
|---|---|---|---|
| Retina | Eye | Photoreceptors, bipolar, ganglion cells | Parallel processing begins; fovea highest density |
| Optic nerve | Orbit → skull | RGC axons (myelinated by oligodendrocytes) | CNS structure; covered by meninges; ~1.2M axons |
| Optic chiasm | Base of brain, sella | Mixed nasal + temporal fibers | Nasal fibers cross; partial decussation |
| Optic tract | Lateral to midbrain | Ipsilateral temporal + contralateral nasal | Carries full contralateral hemifield |
| LGN (thalamus) | Posterior thalamus | 6 laminae (M and P layers) | Retinotopic map maintained |
| Optic radiations | Internal capsule → occipital | LGN axons | Meyer's loop in temporal lobe |
| Primary visual cortex (V1) | Calcarine sulcus, occipital | Layers 1-6 with ocular dominance columns | Orientation selectivity; cortical magnification |
| Extrastriate cortex | Parietal (dorsal) / Temporal (ventral) | Complex feature detectors | "Where/How" and "What" pathways |
16. Conclusion
References
- Gray's Anatomy for Students, 4th Ed. (Elsevier) - Central Visual Pathway, p. 1346-1347
- Kandel ER et al. Principles of Neural Science, 6th Ed. - Visual Processing, pp. 544-560
- Bear MF et al. Neuroscience: Exploring the Brain, 5th Ed. - The Optic Nerve, Optic Chiasm, and Optic Tract, pp. 919-925
- Ropper AH et al. Adams and Victor's Principles of Neurology, 12th Ed. - Lesions of the Chiasm, Optic Tract, and Geniculocalcarine Pathway, pp. 269-272
- Goldman-Cecil Medicine, 26th Ed. - Chiasm and Optic Tract, p. 1266
It is physiology
phototransduction cascade rhodopsin cGMP dark current rod photoreceptor
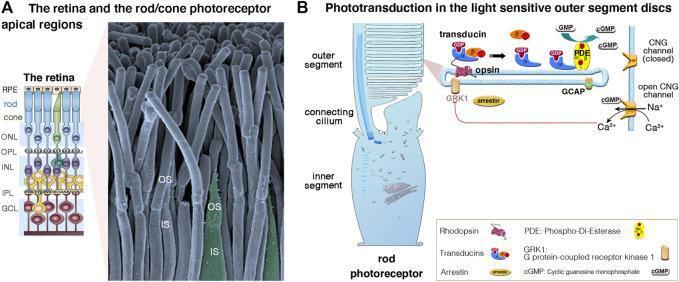
This educational composite focuses on the microanatomy and pathophysiology of retinal photoreceptor cells. Panel A includes a cross-sectional retinal diagram and a high-magnification scanning electron micrograph (SEM). The diagram identifies the laminated structure of the neuroretina, including the retinal pigment epithelium (RPE), outer nuclear layer (ONL), inner nuclear layer (INL), and ganglion cell layer (GCL). The corresponding SEM provides a detailed view of rod and cone apical compartments, showing densely packed, cylindrical outer segments (OS) and wider inner segments (IS) separated by the connecting cilium. Panel B presents a schematic of a rod photoreceptor, detailing the phototransduction cascade within the outer segment's membrane discs. Key molecular components illustrated include rhodopsin (opsin), transducin (G-protein), cGMP phosphodiesterase (PDE), and cGMP-gated channels (CNG). The diagram demonstrates the light-activated biochemical pathway that converts cGMP to GMP, leading to the closure of CNG channels and the regulation of sodium (Na+) and calcium (Ca2+) influx, which governs photoreceptor hyperpolarization and visual signaling.
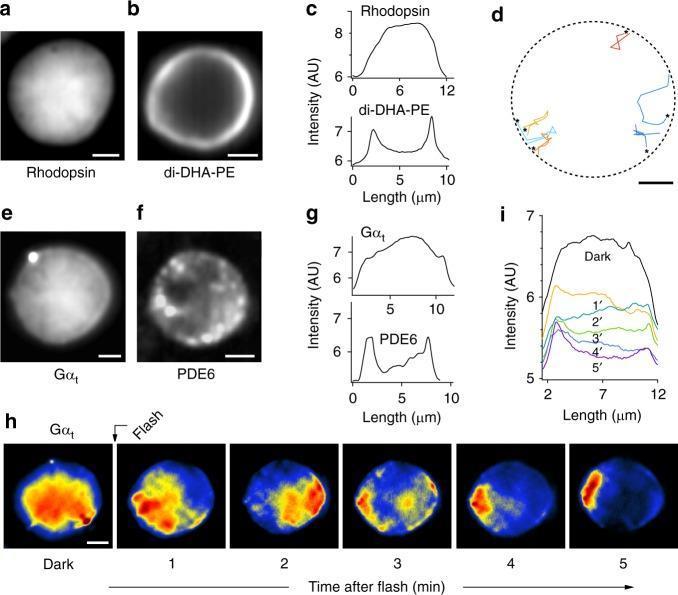
This composite educational graphic illustrates the concentric heterogeneity and protein spatial dynamics within the rod outer segment disc membrane of photoreceptor cells. Panels (a, b, e, f) provide averaged fluorescence microscopy images showing distinct protein localization: rhodopsin and Gͱt exhibit centrally confined distributions, while the phospholipid di-DHA-PE and the enzyme PDE6 show annular or marginal distributions focused at the disc periphery. Corresponding fluorescence intensity profiles (panels c, g) quantify these patterns, contrasting the convex central peaks of rhodopsin/Gͱt with the bimodal peripheral peaks of di-DHA-PE/PDE6. Panel (d) displays single-molecule trajectories of di-DHA-PE, illustrating raftophobic behavior as molecules return to the disc rim after excursions toward the center. Lower panels (h, i) present a time-series montage and intensity plots showing the lateral translocation of Gͱt following light-dependent activation (flash photolysis), demonstrating the dynamic shift of transducin from the central disc region to the periphery over five minutes. This material is designed for advanced study of visual phototransduction and membrane microdomain organization.
![This diagnostic image set consists of six high-magnification Transmission Electron Microscopy (TEM) frames illustrating the ultrastructure of rod photoreceptor outer segments in a mouse model of rhodopsin mutation (F220C). The panels are organized into a comparative grid: genotypes (Wild-type [WT], Heterozygous [F220C/+], and Homozygous [F220C/F220C]) are shown at two temporal stages (1 month and 15 months). The specimens are stained with tannic acid, which acts as a heavy metal contrast agent to specifically highlight the nascent, open membranous discs at the base of the outer segment. Key visible features include the highly organized, stacked disc architecture and the connecting cilium. Across all genotypes and ages, the images demonstrate a lack of gross ultrastructural pathology, showing preserved disc morphogenesis and membrane stacking. The educational focus is on retinal cell biology, specifically the preservation of photoreceptor integrity despite the presence of F220C rhodopsin mutations over time. Scale bar: 0.5 μm.](https://cdn.orris.care/cdss_images/pmc_clinical_VQA_9320df37d118c2b6035d653c4b73f83b0044f0087582d33e855ba02513fb2ed3.jpg)
This diagnostic image set consists of six high-magnification Transmission Electron Microscopy (TEM) frames illustrating the ultrastructure of rod photoreceptor outer segments in a mouse model of rhodopsin mutation (F220C). The panels are organized into a comparative grid: genotypes (Wild-type [WT], Heterozygous [F220C/+], and Homozygous [F220C/F220C]) are shown at two temporal stages (1 month and 15 months). The specimens are stained with tannic acid, which acts as a heavy metal contrast agent to specifically highlight the nascent, open membranous discs at the base of the outer segment. Key visible features include the highly organized, stacked disc architecture and the connecting cilium. Across all genotypes and ages, the images demonstrate a lack of gross ultrastructural pathology, showing preserved disc morphogenesis and membrane stacking. The educational focus is on retinal cell biology, specifically the preservation of photoreceptor integrity despite the presence of F220C rhodopsin mutations over time. Scale bar: 0.5 μm.
retinal ganglion cell on off center surround receptive field lateral inhibition
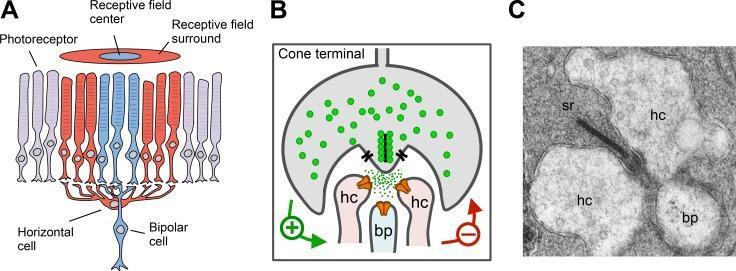
Educational panel illustrating the neurobiology of lateral inhibition in the vertebrate retina. (A) Anatomical diagram showing horizontal cells (HCs) integrating input from photoreceptors across the receptive field center and surround to modulate bipolar cell (bp) activity. (B) Pathophysiology diagram of an invaginating synapse, detailing a reciprocal negative feedback loop where glutamate release from the cone terminal activates HCs, which in turn feed back to inhibit the photoreceptor. (C) Transmission electron micrograph (TEM) of an invaginating cone synapse at high magnification. The micrograph identifies the synaptic triad: a characteristic arrangement comprising two lateral horizontal cell dendrites (hc) and a central bipolar cell dendrite (bp). A prominent electron-dense presynaptic synaptic ribbon (sr) is visible within the cone terminal, directed toward the triad. The horizontal cells appear larger and less electron-dense compared to the smaller, more electron-dense bipolar cell process. This visual aids in understanding neurotransmitter modulation and visual signal processing in ophthalmology and neuroanatomy.
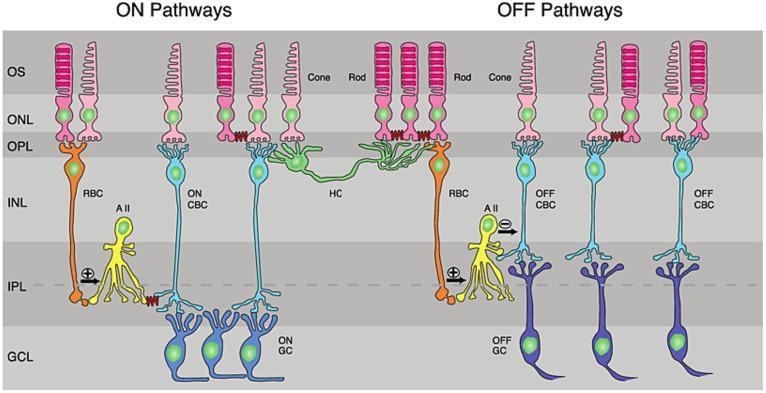
This pathophysiology diagram illustrates the functional retinal circuitry of the ON and OFF pathways. The vertical organization of the retina is shown across six distinct layers: Outer Segments (OS), Outer Nuclear Layer (ONL), Outer Plexiform Layer (OPL), Inner Nuclear Layer (INL), Inner Plexiform Layer (IPL), and Ganglion Cell Layer (GCL). The diagram depicts key cell types and their synaptic relationships: Rods and Cones (photoreceptors) in the outer layers; Rod Bipolar Cells (RBC) and Cone Bipolar Cells (ON CBC and OFF CBC) in the INL; Horizontal Cells (HC) providing lateral inhibition in the OPL; and AII Amacrine Cells facilitating signal transfer. The ON pathway demonstrates rod signals traversing RBCs to AII cells, which سپس stimulate ON Ganglion Cells (ON GC). The OFF pathway shows direct transmission from photoreceptors via OFF CBCs to OFF Ganglion Cells (OFF GC). This schematic serves as a high-level educational resource for understanding neuro-ophthalmology, visual signal processing, and the stratification of the human retina.
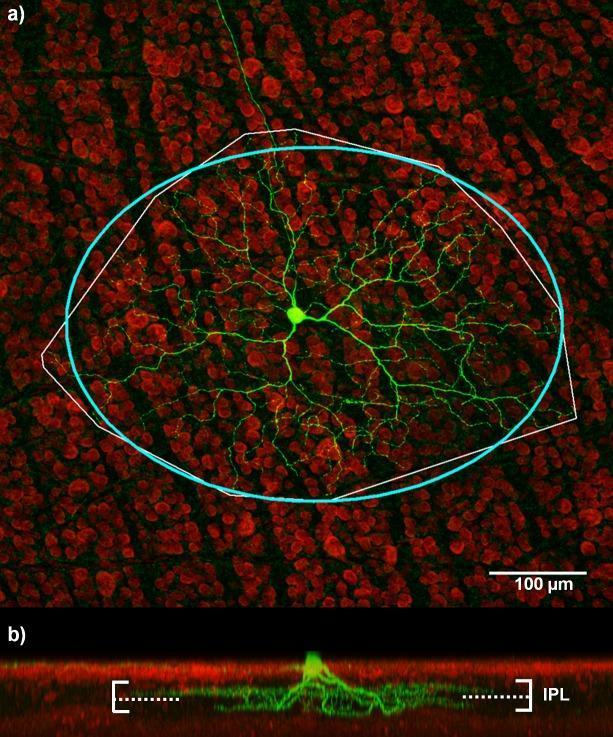
This diagnostic image provides a microscopic analysis of an ON-OFF retinal ganglion cell (RGC) using immunofluorescence staining. Panel (a) shows a top-down (en face) view where the RGC is stained green, revealing a central soma with an extensive, branching dendritic arbor. The background consists of red-stained retinal cells. Overlaid annotations include a thin white polygonal bounding box defining the dendritic field and a thick light-blue ellipse used to estimate the dendritic field size (calculated at 508 μm). Panel (b) illustrates a cross-sectional view of the same cell, demonstrating dendritic stratification within the Inner Plexiform Layer (IPL). The green dendrites bifurcate into two distinct horizontal layers. The boundaries of the IPL are marked by solid white lines, while a dashed white line indicates the ON/OFF border, separating the layer into the ON sublamina (upper region) and OFF sublamina (lower region). This visual serves as a neuroanatomical reference for studying RGC morphology, dendritic field quantification, and synaptic stratification patterns in the visual system.
The Visual Pathway: A Physiology Assignment
1. Introduction
2. Phototransduction: Converting Light to Electrical Signals
2.1 The Dark State
- In the dark: cGMP is high → cGMP-gated Na⁺ channels are open → Na⁺ flows in → membrane is depolarized (-30 mV)
- This depolarization drives tonic glutamate release from the photoreceptor synaptic terminal onto bipolar cells
2.2 The Phototransduction Cascade (in Rods)
Photon → Rhodopsin (11-cis → all-trans retinal)
       → Transducin (GDP → GTP)
       → Phosphodiesterase activated
       → cGMP hydrolyzed
       → Na⁺ channels close
       → Membrane hyperpolarizes
       → Less glutamate released
2.3 Termination of the Cascade
- Metarhodopsin II is inactivated by rhodopsin kinase (phosphorylation) followed by binding of arrestin, blocking transducin interaction
- Transducin self-inactivates via its intrinsic GTPase (Tα-GTP → Tα-GDP)
- Guanylate cyclase restores cGMP levels, reopening channels → photoreceptor depolarizes back to resting state
- Calcium feedback: Light closes channels → [Ca²⁺]intracellular falls → Ca²⁺ normally inhibits guanylate cyclase, so reduced Ca²⁺ activates guanylate cyclase → faster cGMP recovery (negative feedback adaptation)
2.4 Phototransduction in Cones
| Cone Type | Opsin | Peak Wavelength |
|---|---|---|
| S-cones (Short) | Blue opsin | ~430 nm |
| M-cones (Medium) | Green opsin | ~530 nm |
| L-cones (Long) | Red opsin | ~560 nm |
3. Retinal Processing
3.1 Retinal Cell Layers and Synaptic Organization
3.2 The Concept of the Receptive Field
3.3 Center-Surround Receptive Fields
- Light in the center → excites the cell (increases firing)
- Light in the surround → inhibits the cell
- Best stimulus: small spot of light in the center
- Light in the center → inhibits (decreases firing)
- Light in the surround → excites
- Best stimulus: a dark spot in center, or bright annulus
3.4 ON and OFF Bipolar Cells
| Type | Glutamate Receptor | Response to Light (↓ glutamate) |
|---|---|---|
| ON bipolar cell | mGluR6 (metabotropic) - sign-inverting | Depolarizes (excited) |
| OFF bipolar cell | Ionotropic (AMPA/kainate) - sign-conserving | Hyperpolarizes (inhibited) |
3.5 Parallel Processing in the Retina
| Cell Type | Size | Properties | Pathway |
|---|---|---|---|
| M-type (Parasol) | Large soma, large receptive field | Fast-conducting; sensitive to motion, low spatial frequency, low contrast | Magnocellular (M) stream |
| P-type (Midget) | Small soma, small receptive field | Slow; high spatial frequency, color discrimination, fine detail | Parvocellular (P) stream |
| K-type (Bistratified) | Intermediate | Blue-yellow color opponency | Koniocellular (K) stream |
4. Adaptation: Adjusting Sensitivity to Illumination
4.1 Dark Adaptation
- Phase 1 (first ~8-10 min): Cone adaptation - cones regenerate their photopigment and reach their sensitivity limit first
- Phase 2 (up to ~30 min): Rod adaptation - rods regenerate rhodopsin more slowly but achieve far greater final sensitivity (rods can detect a single photon)
4.2 Light Adaptation
- Pupil constriction (rapid, ~2-3 fold reduction in light entering the eye)
- Photopigment bleaching in photoreceptors
- Calcium-mediated feedback: Light → channels close → [Ca²⁺] falls → guanylate cyclase activated → faster cGMP turnover → restores sensitivity
- Retinal network adaptation: Horizontal cell and amacrine cell circuits adjust gain across the retina
5. Lateral Geniculate Nucleus (LGN): Thalamic Relay Physiology
5.1 Layered Organization and Parallel Streams
- Layers 1-2: Magnocellular (M-stream) - large cells, fast, transient responses
- Layers 3-6: Parvocellular (P-stream) - small cells, sustained responses, color sensitive
- Koniocellular cells sit between each layer (K-stream)
5.2 Receptive Field Properties at the LGN
5.3 Non-retinal Inputs and Gating
6. Primary Visual Cortex (V1): Physiology
6.1 Retinotopic Organization
6.2 Simple and Complex Cells (Hubel and Wiesel, Nobel Prize 1981)
- Have elongated rectangular receptive fields with distinct excitatory and inhibitory subregions
- Respond best to a bar or edge of specific orientation and position
- Built from LGN inputs arranged in a row
- Also orientation-selective, but position-invariant (respond regardless of exact position of the edge within their receptive field)
- Built from inputs of multiple simple cells
- Respond to moving edges
- Respond best to edges of specific length; response decreases if the stimulus is too long
6.3 Orientation Columns
6.4 Ocular Dominance Columns
6.5 Binocularity and Stereopsis
6.6 Color Processing in V1
7. Extrastriate Cortex: Dorsal and Ventral Streams
7.1 The Ventral Stream ("What" Pathway)
- Processes form, color, texture, object identity and face recognition
- Key areas: V4 (color), IT cortex (object recognition, visual memory)
- Clinical lesion: V4 lesion → cerebral achromatopsia (loss of color perception); IT lesion → visual agnosia
7.2 The Dorsal Stream ("Where/How" Pathway)
- Processes motion, spatial location, visuomotor guidance
- Key areas: V5/MT (motion detection), posterior parietal cortex (spatial attention, reaching)
- Clinical lesion: V5/MT lesion → akinetopsia (inability to perceive motion); parietal lesion → optic ataxia
8. The Pupillary Light Reflex: Physiology
9. Color Vision: The Young-Helmholtz and Opponent Process Theories
9.1 Trichromacy (Young-Helmholtz Theory)
9.2 Opponent Process Theory (Hering)
- Red vs. Green (L-cone vs. M-cone opponent)
- Blue vs. Yellow (S-cone vs. L+M opponent)
- Light vs. Dark (luminance channel)
9.3 Color Blindness
- Deuteranopia (missing M-cones, green-blind): most common, X-linked
- Protanopia (missing L-cones, red-blind): X-linked
- Tritanopia (missing S-cones, blue-blind): rare, autosomal dominant
- Cerebral achromatopsia: Bilateral V4 lesion; person sees world in shades of grey despite intact retina
10. Summary Table: Physiology of Each Relay Station
| Station | Key Physiology | Key Neurotransmitter/Mediator |
|---|---|---|
| Photoreceptor (dark) | Dark current (Na⁺ influx via cGMP channels); tonic glutamate release | cGMP, Na⁺ |
| Photoreceptor (light) | Rhodopsin activated → transducin → PDE → ↓cGMP → channels close → hyperpolarize → ↓ glutamate | cGMP, Rhodopsin, Transducin, PDE |
| Bipolar cells | ON cells (sign-inverting via mGluR6) / OFF cells (sign-conserving); excite ganglion cells | Glutamate |
| Horizontal cells | Lateral inhibition at outer plexiform layer; mediate center-surround organization | GABA |
| Amacrine cells | Lateral inhibition and temporal filtering at inner plexiform layer | GABA, Glycine, Dopamine |
| Ganglion cells | Concentric center-surround RFs; parallel M/P/K streams; tonic glutamate release along optic nerve | Glutamate |
| LGN | Preserve center-surround RFs; segregate eyes; gate information; 6 laminae | Glutamate, GABA |
| V1 (striate cortex) | Simple/complex cells; orientation & direction selectivity; ocular dominance; retinotopy; CO blobs | Glutamate, GABA |
| Extrastriate cortex | Ventral stream (what); dorsal stream (where/how); motion, color, object processing | Glutamate, modulatory inputs |
11. Clinical Correlations of Visual Physiology
| Condition | Physiological Basis |
|---|---|
| Night blindness (Nyctalopia) | Vitamin A deficiency → cannot regenerate 11-cis retinal → rhodopsin not resynthesized → rod failure |
| Retinitis pigmentosa | Mutations in phototransduction cascade genes (e.g., rhodopsin, PDE, RPGR) → rod degeneration → progressive peripheral vision loss |
| Color blindness | Missing or mutant cone opsin genes (X-linked for L/M cones) |
| Amblyopia (lazy eye) | Monocular deprivation during critical period → loss of ocular dominance columns and cortical neurons for that eye |
| Glaucoma | Elevated IOP → retinal ganglion cell axon compression at optic disc → progressive RGC loss → arcuate visual field defects |
| Anton's syndrome | Bilateral V1 destruction → cortical blindness, yet patient denies being blind (blindsight remains via superior colliculus) |
| Akinetopsia | V5/MT area lesion (e.g., stroke) → motion perception lost; world appears as series of still photographs |
12. Conclusion
References
- Kandel ER et al. Principles of Neural Science, 6th Ed. (McGraw-Hill) - Phototransduction, Retinal Processing, pp. 569-590
- Bear MF et al. Neuroscience: Exploring the Brain, 5th Ed. (Wolters Kluwer) - Phototransduction in Rods/Cones, Dark Current, pp. 866-875; Central Visual System, pp. 913-950
- Gray's Anatomy for Students, 4th Ed. (Elsevier) - Central Visual Pathway, pp. 1346-1347
- Adams & Victor's Principles of Neurology, 12th Ed. - Visual Field Defects, pp. 269-272
Write assignment on effects of vision and refractive errors
myopia hyperopia emmetropia eye refraction focal point diagram correction lens
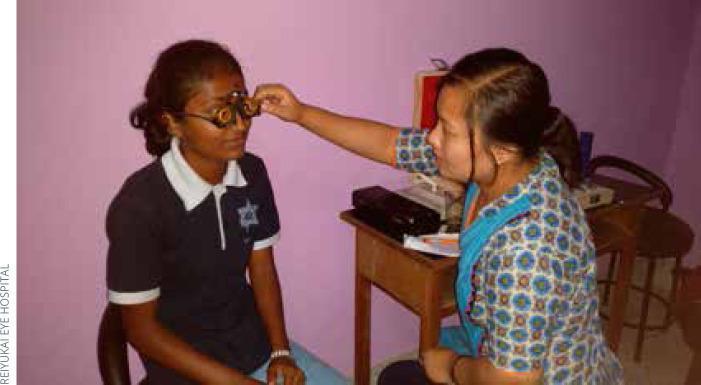
This clinical photograph captures a subjective refraction procedure being performed in a community eye care setting. A seated adolescent patient is wearing a metallic universal trial frame, which is fitted with multiple corrective lenses. An ophthalmic assistant is shown manually adjusting the trial frame to ensure proper centration and vertex distance. The procedure is a critical step in diagnosing refractive errors such as myopia, hyperopia, or astigmatism and determining a patient's final spectacle prescription. The scene demonstrates a typical outreach or school-based vision screening environment, highlighting the use of trial frames and lens sets as essential tools for refractive assessment in public health ophthalmology. Educational focus includes proper technique for fitting trial frames, the patient-provider interaction during vision testing, and the clinical application of optometric instruments in low-resource or community-based medical settings.
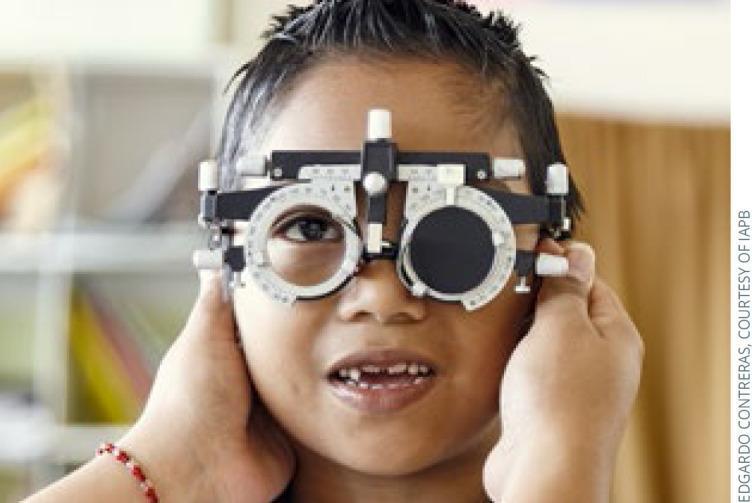
A clinical photograph of a pediatric patient undergoing a refraction examination using an ophthalmic trial frame. The image illustrates a young child with dark hair and visible primary dentition gaps, wearing a standard black and white adjustable trial frame. The frame features multiple adjustment knobs for interpupillary distance and temple length. In the current setup, the patient's right eye is visible through an empty lens holder, while the left eye is covered by a solid black occluder lens, a common configuration used to measure monocular visual acuity or perform subjective refraction. The child is holding the frame's temples with both hands to ensure stability during the assessment. This visual demonstrates common optometric equipment used for diagnosing refractive errors like myopia, hyperopia, and astigmatism in a clinical setting.

Evidence Statements: Children should receive an eye examination at the beginning of primary school to diagnose the onset of myopia.115 (Evidence Grade: B) Hyperopia can affect the development of literacy skills. Children with uncorrected hyperopia show reduced performance in the acquisition of emergent literacy skills.238 (Evidence Grade: C),243 (Evidence Grade: C) Correction of hyperopia may, under specific conditions, lead to increased reading speed; therefore, eye examinations to diagnose uncorrected hyperopia are recommended.244 (Evidence Grade: B) Early diagnosis and treatment of an accommodative or vergence problem may reduce the negative impact on academic performance.65 (Evidence Grade: B) Children with AD/HD or related learning problems may benefit from comprehensive vision evaluation to assess the presence of convergence insufficiency.251 (Evidence Grade: D) Treatment of convergence insufficiency has been associated with reduction in the frequency of adverse academic behaviors.65 (Evidence Grade B) <table><tr><td>Potential Benefits:</td><td>Potential Risks/Harms:</td></tr><tr><td>Early identification and treatment of eye and vision problems</td><td>None</td></tr><tr><td>Benefit and Harm Assessment:</td><td>Benefits significantly outweigh harms</td></tr><tr><td>Potential Costs:</td><td>Direct cost of testing and parent/caregiver time off from work</td></tr><tr><td>Value Judgments:</td><td>None</td></tr><tr><td>Role of Patient Preferences:</td><td>Moderate</td></tr><tr><td>Intentional Vagueness:</td><td>None</td></tr><tr><td>Gaps in Evidence:</td><td>None identified</td></tr></table>
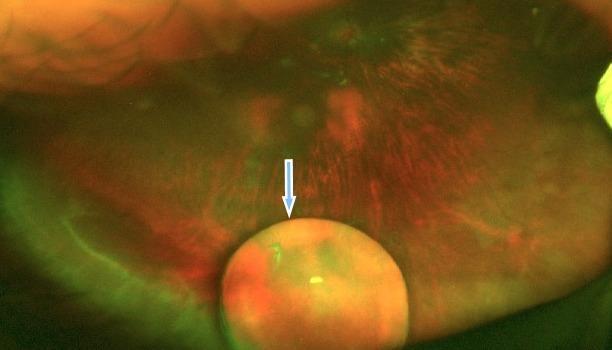
This diagnostic image is a wide-field fundus photograph of the right eye demonstrating a complete posterior lens dislocation (ectopia lentis). The primary focal point, indicated by a light blue arrow, is the crystalline lens, which has migrated into the posterior segment and is resting on the inferior retinal surface within the vitreous cavity. The lens appears as a well-defined, translucent, globular structure with an orange-brown tint and greenish surface reflections. The underlying retinal background exhibits a reddish-orange hue with visible retinal vasculature and mottled pigmentation, suggestive of myopic changes. The image highlights significant ocular trauma or systemic connective tissue pathology, illustrating the total separation of the lens from the ciliary zonules. This clinical photograph is a key educational resource for ophthalmology, focusing on vitreoretinal complications and the management of dislocated lenses.
astigmatism irregular cornea keratoconus visual distortion correction
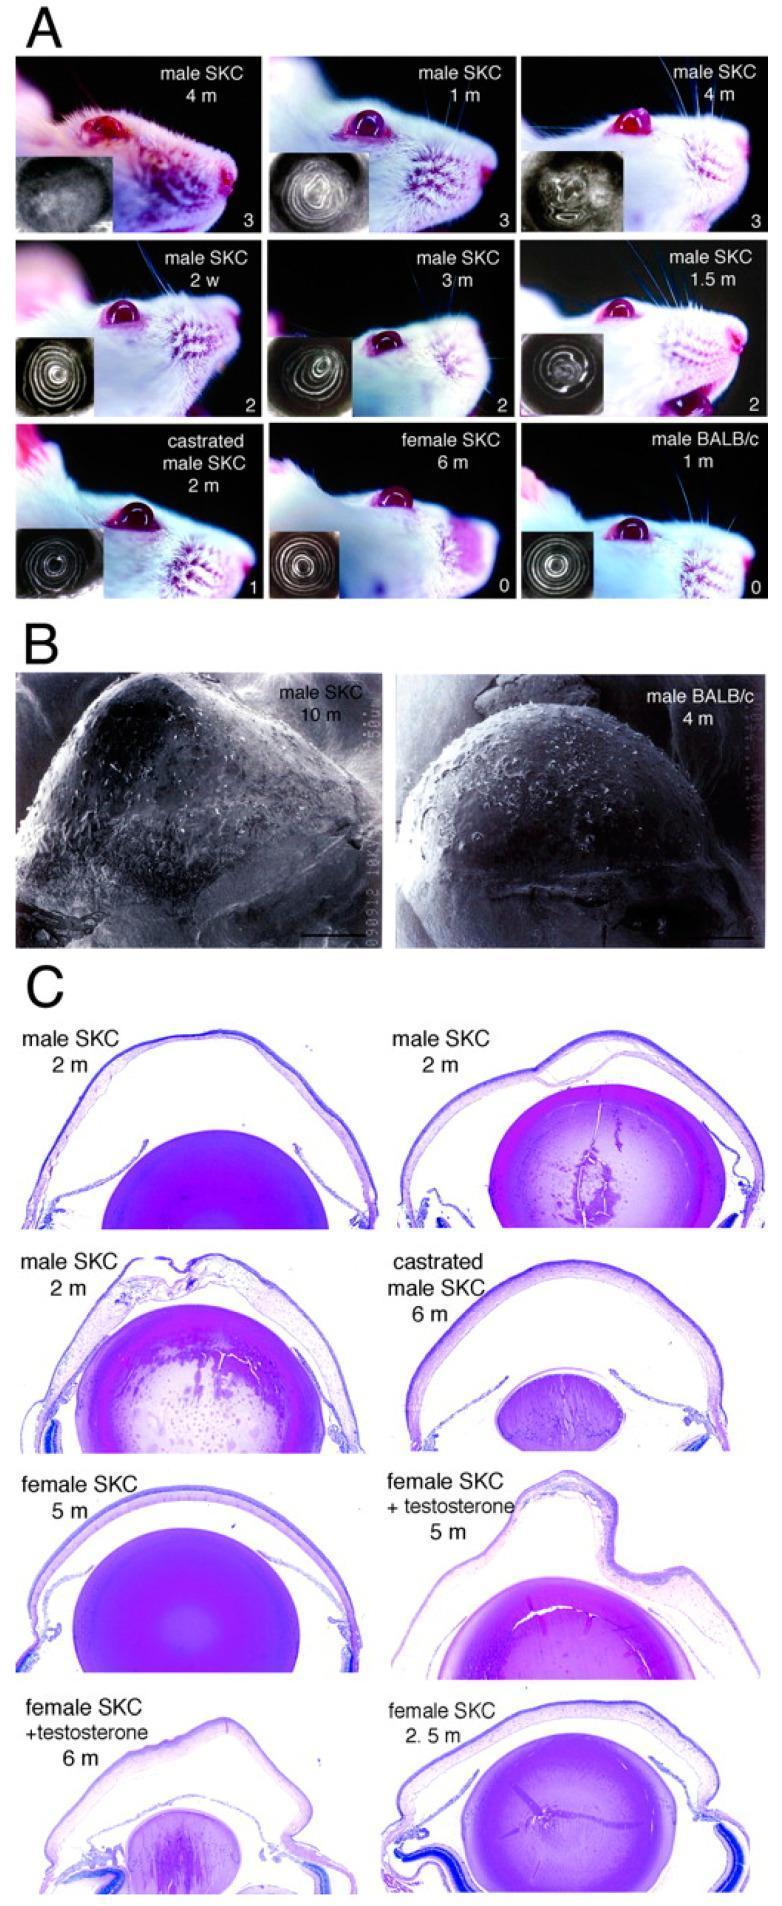
This composite educational image illustrates keratoconus pathology in a mutant Japanese wild mouse strain (SKC) as a model for corneal ectasia. Panel A displays clinical photographs and keratosocopic insets comparing male SKC mice of varying ages (2 weeks to 4 months), castrated males, and BALB/c controls. The SKC males demonstrate progressive corneal protrusion and severe distortion of Placido-like rings (keratoscopy), indicative of irregular astigmatism and high-grade ectasia (rated 1 to 3), whereas BALB/c and female SKC mice (without testosterone) show normal, concentric circular patterns (rated 0). Panel B utilizes scanning electron microscopy to highlight the gross topographical irregularity and structural degradation of a 10-month-old SKC cornea compared to the smooth surface of a BALB/c control. Panel C presents H&E-stained histological cross-sections (100x magnification) showing the ocular anterior segment. It highlights the development of a distinct cone-shaped malformation (keratoconus) in female SKC mice following testosterone treatment, emphasizing the androgen-dependent nature of the phenotype in this model. Histological findings include changes in corneal curvature, stromal thinning, and epithelial surface irregularity.
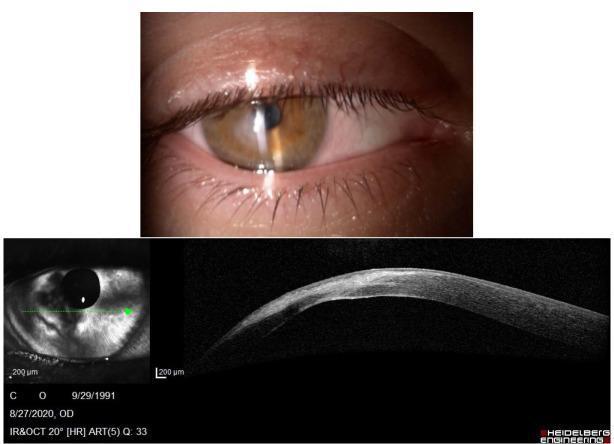
This composite educational material displays clinical imaging of the right eye, featuring a slit lamp photograph and an anterior segment optical coherence tomography (AS-OCT) scan. The slit lamp image reveals a central corneal opacity with hazy, irregular surface reflections, suggesting structural distortion and tissue remodeling. Below, the corresponding AS-OCT scan provides a cross-sectional view of the cornea, demonstrating a loss of normal stromal lamellar architecture. Key findings include a hyper-reflective area within the deep stroma, consistent with dense scarring following the regression of corneal hydrops. The corneal profile shows significant irregularity and thinning in specific regions, along with a disruption of the posterior surface (Descemet's membrane). This visual resource illustrates the clinical and anatomical progression of advanced keratoconus complications, specifically the transformation of acute hydrops into chronic stromal scarring. It serves as an example for ophthalmology students in identifying corneal pathology and interpreting diagnostic imaging modalities used to monitor disease resolution and tissue integrity.
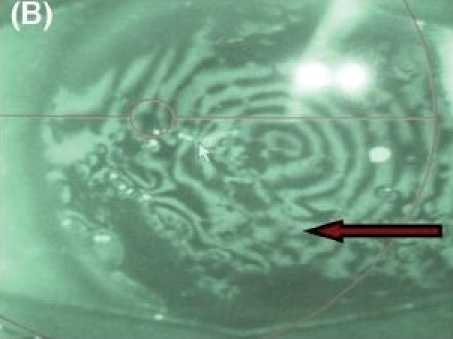
**Imaging Modality:** Placido disc-based corneal topography (videokeratoscopy). **Anatomical Region:** Anterior segment of the eye, specifically the corneal surface. **Observed Pathology:** Climatic droplet keratopathy (CDK). **Characteristic Visual Features:** The image demonstrates severe irregularity and distortion of the Placido rings reflected off the corneal tear film. In the central and paracentral regions, indicated by a red arrow, the concentric mires show significant breakage, crowding, and wavy deformation (mires distortion). This pattern indicates a highly irregular corneal surface and loss of optical smoothness. There is a visible breakdown of the circular mire integrity, correlating with the presence of subepithelial deposits and opacities characteristic of advanced droplet keratopathy. **Diagnostic Differentiating Features:** Unlike the regular steepening seen in keratoconus, this image shows diffuse, chaotic distortion and "mire dropout," reflecting the basement membrane changes and proteinaceous subepithelial accumulation typical of degenerative keratopathies. The distortion is non-orthogonal and irregular, signifying high-order aberrations and severe irregular astigmatism.
LASIK refractive surgery corneal ablation laser eye procedure
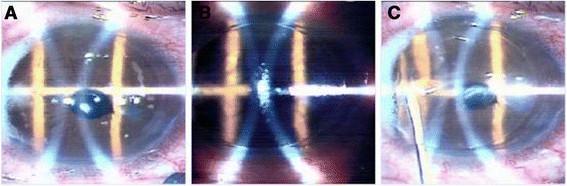
This sequence of three surgical microscopic images (A-C) demonstrates the stages of Laser-Assisted In Situ Keratomileusis (LASIK) on a pseudophakic eye to correct residual refractive error. Panel A shows the initial stage of corneal flap creation using a femtosecond laser; an intraocular lens (IOL) is clearly visible in the posterior chamber through the pupil, indicating prior cataract surgery. Panel B depicts the surgical field after the corneal flap has been elevated, exposing the underlying stromal bed to receive excimer laser ablation for tissue reshaping. Bright reflections in the center of the stromal bed indicate the active laser application zone. Panel C illustrates the final operative phase, where the corneal flap has been repositioned. A micro-cannula is visible performing interface irrigation to remove debris and ensure proper flap adherence. This comparison series serves as an educational tool for ophthalmology trainees regarding refractive enhancement techniques in patients with existing intraocular implants.
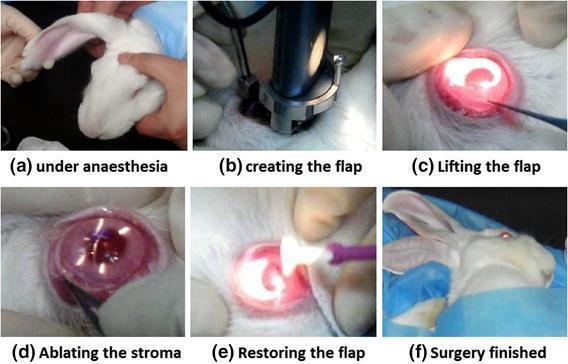
A series of six intraoperative clinical photographs (labeled a-f) documenting the sequential steps of Laser-Assisted In Situ Keratomileusis (LASIK) surgery, using a rabbit model for ophthalmological research. (a) Pre-operative stage: The subject is positioned under general anesthesia. (b) Flap creation: A mechanical microkeratome is applied to the corneal surface to create a thin, hinged corneal flap. (c) Flap elevation: A surgical spatula is used to lift the flap, exposing the underlying corneal stroma, visible under a bright operating microscope light. (d) Photoablation: An excimer laser is used to perform stromal ablation, modifying the corneal curvature; the stroma appears altered and reflective. (e) Flap repositioning: The corneal flap is carefully smoothed back into its original anatomical position using a specialized sponge-tip applicator to ensure proper adhesion. (f) Post-operative view: The procedure is complete, demonstrating the restoration of corneal integrity. This image serves as an educational resource for refractive surgery protocols, demonstrating instrument application and corneal tissue response during the transition from flap creation to laser ablation and restoration.
Effects of Vision and Refractive Errors: A Physiology Assignment
1. Introduction: The Optics of the Eye
Principal Refracting Surfaces of the Eye
| Surface | Refractive Index Change | Approximate Power |
|---|---|---|
| Anterior cornea (air → cornea) | 1.000 → 1.376 | ~43 D |
| Posterior cornea | Small (similar RI on both sides) | ~-5 D |
| Anterior lens surface | ~1.336 → 1.386 | ~8 D (relaxed) |
| Posterior lens surface | ~1.386 → 1.336 | ~8 D (relaxed) |
| Total eye (relaxed) | - | ~59 D |
2. Accommodation: The Physiology of Focusing for Near Vision
2.1 Mechanism of Accommodation
- Meridional fibers pull the ciliary body anteriorly toward the corneoscleral junction
- Circular (sphincter) fibers reduce the diameter of the ciliary ring
- Both effects release tension on the zonules
- Released from tension, the elastic lens capsule allows the lens to bulge into a more spherical shape
- The increased curvature raises refractive power by several diopters
- Zonular tension is restored
- The lens is pulled flat again
- Refractive power decreases
2.2 The Near Triad
- Accommodation - lens thickens
- Convergence - medial recti contract, both eyes turn inward
- Pupillary constriction (miosis) - increases depth of focus
2.3 Depth of Focus and the Pupil
3. Emmetropia: Normal Vision
4. Refractive Errors (Ametropia): Classification and Physiology
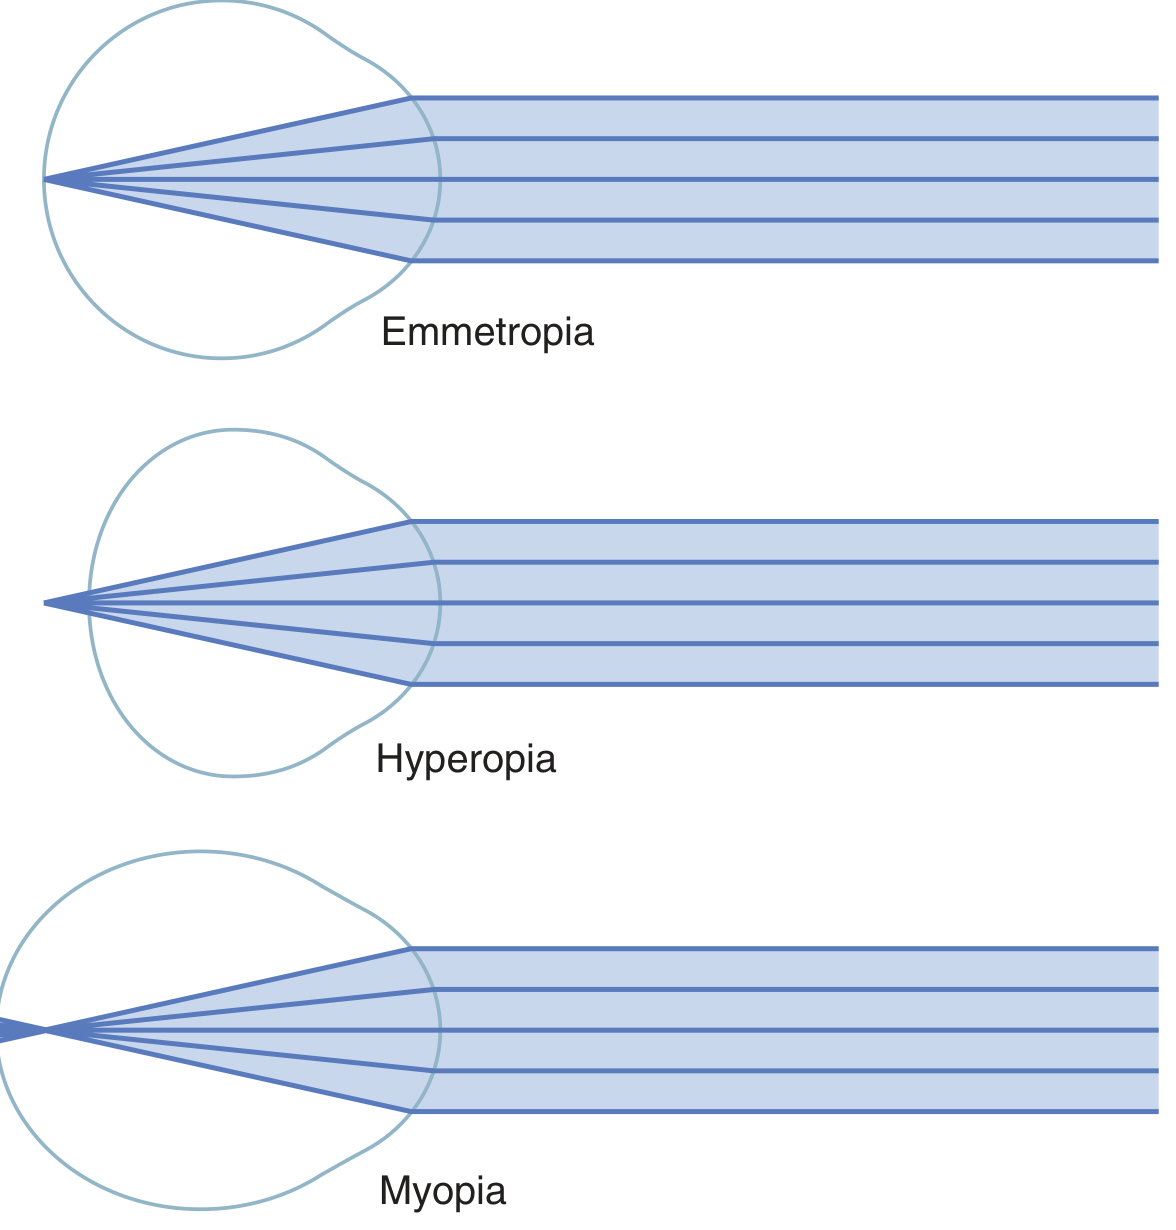
5. Myopia (Nearsightedness)
5.1 Definition and Physiology
- Axial myopia (most common) - the eyeball is too long for its refractive power (axial length > 24 mm)
- Refractive (index) myopia - the lens or cornea has too much refractive power for its axial length
5.2 Clinical Features
- Typically discovered in childhood when the child cannot read the blackboard at school
- Progresses until approximately age 20-25 years (school myopia)
- Rapidly progressing myopia after age 25 should prompt investigation for diabetes mellitus (reversible metabolic lens changes), corticosteroid use (cataract formation), or trauma - Goldman-Cecil, p. 4120
5.3 Pathologic (Degenerative) Myopia
- Normal axial length: 20-24 mm
- Pathologic myopia: can exceed 25-30 mm, up to 40 mm in severe cases
- Posterior staphyloma (localized scleral outpouching) develops
- Complications: retinal hole, retinal detachment, choroidal neovascularization, intraocular hemorrhage, cataract (posterior subcapsular), early glaucoma
- Associated systemic conditions: Cornelia de Lange syndrome, Stickler syndrome, Marfan syndrome
5.4 Correction of Myopia
| Method | Mechanism | Notes |
|---|---|---|
| Spectacles (concave lens) | Diverges rays, reduces effective refractive power | First-line; fully correctable in most |
| Contact lenses (soft/rigid) | Same principle; nullifies corneal refraction at anterior surface | Rigid lenses also correct irregular astigmatism |
| LASIK | Excimer laser ablates corneal stroma to reduce curvature → reduces refractive power | Up to ~-10 D; see details below |
| PRK / Surface ablation | Laser ablation without flap creation | Low-moderate myopia |
| SMILE | Femtosecond laser creates and extracts a refractive lenticule without a flap | Myopia + myopic astigmatism |
| Phakic IOL (implantable contact lens) | Lens inserted between iris and crystalline lens (posterior chamber) | -3 D to -20.5 D; for high myopia |
| Clear lens extraction | Lens removed and replaced with IOL | High myopia; small risk of retinal detachment |
6. Hyperopia (Farsightedness / Hypermetropia)
6.1 Definition and Physiology
- Axial hyperopia (most common) - the eyeball is too short (axial length < 21 mm)
- Refractive hyperopia - the lens/cornea has insufficient refractive power
6.2 Latent vs. Manifest Hyperopia
- Latent hyperopia: Masked by active accommodation; not revealed by standard refraction unless the ciliary muscle is paralyzed (cycloplegia with atropine)
- Manifest hyperopia: Cannot be fully compensated by accommodation; requires optical correction
6.3 Effects and Complications
| Effect | Mechanism |
|---|---|
| Blurred near vision (children) | Runs out of accommodation for near tasks; near blur before distance blur |
| Accommodative esotropia | High accommodative demand drives convergence → crossed eyes (strabismus) |
| Amblyopia | If uncorrected in children, the blurred retinal image fails to drive normal visual cortex development |
| Angle-closure glaucoma | Short axial length → shallow anterior chamber → narrow drainage angle → prone to acute angle-closure |
| Asthenopia (eyestrain, headaches) | Continuous accommodative effort causes fatigue |
| Presbyopia early | When the aging lens loses flexibility, latent hyperopia becomes manifest |
- Goldman-Cecil, p. 4121
6.4 Correction of Hyperopia
| Method | Notes |
|---|---|
| Spectacles (convex/plus lens) | Standard treatment; bifocals often needed when presbyopia co-exists |
| Contact lenses | Plus-powered soft or rigid lenses |
| LASIK | Can correct up to +4 D; less predictable than for myopia |
| Conductive keratoplasty (CK) | Radiofrequency energy applied to corneal periphery → thermal shrinkage → increased central curvature |
| Phakic IOL / Clear lens extraction | For high hyperopia not correctable by surface procedures |
7. Astigmatism
7.1 Physiology and Optics
"Astigmatism usually results from too great a curvature of the cornea in one plane... because the curvature of the astigmatic lens along one plane is less than the curvature along the other plane, light rays striking the peripheral portions of the lens in one plane are not bent nearly as much as the rays striking the peripheral portions of the other plane."
7.2 Types of Astigmatism
| Type | Description |
|---|---|
| Regular astigmatism | Principal meridians are at 90° to each other; correctable with cylindrical lenses |
| - With-the-rule | Steeper meridian is vertical (most common in young people) |
| - Against-the-rule | Steeper meridian is horizontal (more common in older adults) |
| - Oblique | Principal meridians are between 30°-60° and 120°-150° |
| Irregular astigmatism | Meridians are not regular; caused by corneal scarring, keratoconus, pterygium; cannot be corrected with spectacles |
7.3 Symptoms
- Blurred vision at all distances (unlike myopia/hyperopia which blur near or far preferentially)
- "Shadowing" or ghost images around objects
- Difficulty with fine detail
- Asthenopia (headaches, eyestrain) from constant failed attempts to focus
7.4 Correction of Astigmatism
- A trial spherical lens is found that focuses one meridian
- A cylindrical lens at the appropriate axis corrects the remaining out-of-focus meridian
- The final prescription combines both components: sphere (S) + cylinder (C) × axis (°)
| Method | Notes |
|---|---|
| Spectacles (spherocylindrical lens) | Corrects regular astigmatism |
| Rigid contact lenses | Nullifies corneal irregularity by substituting a new regular refracting surface (tear meniscus) - essential for irregular astigmatism |
| LASIK / PRK | Corrects up to ~-4 D myopic astigmatism |
| Corneal collagen cross-linking | Halts progression of keratoconus |
| Corneal transplant (keratoplasty) | For severe irregular astigmatism from keratoconus or scarring |
8. Presbyopia: Age-Related Loss of Accommodation
8.1 Physiology
- Grows larger and thicker continuously throughout life
- Undergoes progressive denaturation of its nuclear proteins
- Becomes less elastic - the lens capsule can no longer mold the stiffer nucleus into a more spherical shape even when zonular tension is released
8.2 Progressive Loss of Accommodation with Age
| Age | Amplitude of Accommodation |
|---|---|
| Child (10 years) | ~14 diopters |
| 25 years | ~10 diopters |
| 40 years | ~4-6 diopters |
| 45-50 years | <2 diopters |
| 70 years | ~0 diopters |
- Age 10: near point ~7 cm
- Age 40: near point ~25 cm (difficulty reading small print)
- Age 60: near point ~100 cm (cannot read without glasses)
8.3 Clinical Presentation
- Difficulty reading small print, especially in dim light
- Need to hold reading material at arm's length
- Eyestrain, headaches after close work
- Better vision in bright light (pupillary constriction increases depth of focus)
8.4 Effect of Pre-existing Refractive Error on Presbyopia
| Pre-existing Error | Effect on Presbyopia |
|---|---|
| Myopia | Reading easier without glasses for longer (near object within far point); reading glasses needed later |
| Hyperopia | Accommodation already used for distance; reading glasses needed earlier; bifocals often necessary |
| Emmetropia | Reading glasses for near tasks only |
8.5 Correction
- Reading glasses (convex lenses, +1.00 to +3.00 D depending on age and preferred reading distance)
- Bifocals - upper segment for distance, lower for near
- Progressive addition lenses (PALs) - gradual power change from top (distance) to bottom (near), cosmetically superior
- Monovision - one contact lens for distance, other for near (brain adapts)
- Conductive keratoplasty (CK) - for mild presbyopia correction in previously emmetropic patients
9. Effects of Refractive Errors on Vision: Summary of Functional Impact
9.1 Visual Acuity
9.2 Contrast Sensitivity
9.3 Binocular Vision and Depth Perception
9.4 Amblyopia
- Refractive amblyopia: High uncorrected ametropia (anisometropia > 2.5 D or bilateral high hyperopia)
- Strabismic amblyopia: One eye deviated → its image suppressed → ocular dominance columns for that eye fail to develop normally
- Deprivation amblyopia: Ptosis or congenital cataract physically blocks visual input
9.5 Effects on Academic and Daily Performance
10. Optical Correction: Principles and Methods
10.1 Spectacle Lenses
10.2 Contact Lenses
- Irregular astigmatism (keratoconus): rigid lenses create a new smooth optical surface
- High refractive errors: eliminates image size distortions that spectacles cause
- Anisometropia: reduces aniseikonia compared to spectacles
10.3 Refractive Surgery
- A microkeratome or femtosecond laser creates a thin corneal flap (hinged superiorly)
- The flap is lifted to expose the stromal bed
- An excimer laser (193 nm UV) ablates precise amounts of corneal stroma to reshape the corneal curvature:
- For myopia: central ablation → flattens cornea → reduces power
- For hyperopia: peripheral ablation → steepens centre → increases power
- For astigmatism: elliptical ablation pattern
- Flap is repositioned and adheres without sutures
11. Special Topics
11.1 Keratoconus
- Prevalence ~55/100,000 in the US (likely underestimated)
- Onset during adolescence, evolves over 5-10 years
- Chronic eye rubbing is an associated risk factor; partly genetic
- Diagnosed by corneal topography (irregular, "skewed" mires)
- Management: rigid contact lenses (early/moderate), corneal collagen cross-linking (arrests progression), penetrating keratoplasty (severe scarring)
11.2 Cataracts and Acquired Refractive Change
- Nuclear sclerosis (hardening of the nucleus) increases its refractive index → index myopia ("second sight" - temporary improvement in near vision in early cataract)
- Eventually, lens opacity scatters light → reduced visual acuity, glare, reduced contrast sensitivity
- Surgical removal + intraocular lens (IOL) implantation corrects the refractive loss
- IOL power is calculated to achieve target refraction (usually emmetropia) using the axial length and corneal power
11.3 Anisometropia
- Aniseikonia: unequal retinal image sizes → poor binocular fusion
- Amblyopia: the more ametropic eye, if not corrected in childhood, develops amblyopia
- Prismatic effect with spectacles: off-axis gaze through spectacle lenses with different powers induces differential prismatic deviation, causing headaches and binocular stress
12. Summary Table: Refractive Errors at a Glance
| Condition | Cause | Focal Point | Blur Distance | Functional Effect | Correction |
|---|---|---|---|---|---|
| Emmetropia | Normal | On retina | None | 20/20 vision | None needed |
| Myopia | Axial length too long / too much power | In front of retina | Distant objects | Blurred far vision; clear near vision | Concave (minus) lens |
| Hyperopia | Axial length too short / too little power | Behind retina | Near objects (first) | Blurred near; accommodative strain; esotropia | Convex (plus) lens |
| Astigmatism | Unequal corneal curvature | Two focal lines | All distances | Blur + shadow at all distances | Cylindrical lens |
| Presbyopia | Reduced lens elasticity | Fixed behind retina for near | Near objects | Inability to focus near in middle age | Plus reading lens; bifocals |
13. Conclusion
References
- Guyton AC, Hall JE. Guyton and Hall Textbook of Medical Physiology, 14th Ed. (Elsevier) - Errors of Refraction, Accommodation, pp. 623-627
- Goldman-Cecil Medicine, 26th Ed. (Elsevier) - Myopia, Hyperopia, Presbyopia, Astigmatism, pp. 4120-4122
- Kanski JJ et al. Kanski's Clinical Ophthalmology, 10th Ed. (Elsevier) - Correction of Myopia and Hyperopia, pp. 299-300
- Neuroscience: Exploring the Brain, 5th Ed. (Wolters Kluwer) - Optics of the Eye, Chapter 9