
Uses of growth chart
Growth charts are tools used to monitor a child's physical development over time by plotting measurements like height, weight, and head circumference against age-based reference data. They help identify children who are growing normally versus those who may have nutritional, hormonal, or chronic disease issues.
Searching sources...
Reading File
Finding Sources
Finding Sources
Park's Textbook has a dedicated "Uses of growth chart" section. Let me read it now, along with related sections.
Reading File
Reading File
Reading File
Now let me fetch the growth chart image referenced in the text:
Loading Image
I now have all the material needed for a thorough answer.
Uses of Growth Chart
A growth chart (also called the "road-to-health" chart) was first designed by David Morley and later modified by the WHO. It is a visible display of a child's physical growth and development, designed primarily for the longitudinal follow-up of a child so that changes over time can be interpreted.
"The growth chart has been described as a passport to child health care... it is now a standard method of monitoring children's health and nutritional status."
- Park's Textbook of Preventive and Social Medicine, p. 637-638
The 7 Uses of a Growth Chart
1. Growth Monitoring
The most fundamental use - it is of great value in child health care. By plotting serial weights against age, a health worker can track whether a child is following a normal trajectory or deviating from it over time. Weight is the most sensitive measure of growth; any deviation from normal can be detected easily by comparison with reference curves.
2. Diagnostic Tool
The growth chart helps identify "high-risk" children. Malnutrition (and other growth disorders) can be detected long before clinical signs and symptoms become apparent. This makes it a powerful early-warning instrument.
3. Planning and Policy Making
By grading malnutrition objectively, the chart provides an evidence base for planning and policy at both local and central levels of child health care. Programme planners can identify areas or populations with high burdens of undernutrition.
4. Educational Tool
Because of its visual character, the mother can be educated about the care of her own child and encouraged to participate more actively in growth monitoring. The chart makes trends immediately visible even to non-literate caregivers.
5. Tool for Action
It guides the health worker on the type of intervention that is needed. It helps make referrals easier - for example, a child falling below -2SD requires dietary counselling, while one below -3SD may need referral to a facility.
6. Evaluation
It provides a method to evaluate the effectiveness of corrective measures and the impact of health programmes or special interventions aimed at improving child growth and development.
7. Tool for Teaching
It can be used for teaching purposes - for example, demonstrating the importance of adequate feeding or showing the deleterious effects of diarrhoea on growth.
The Growth Chart as Used in India
India adopted the WHO Child Growth Standards 2006 in February 2009 for use within the National Rural Health Mission (NRHM) and ICDS. These standards are available for both boys and girls below 5 years of age and show:
- Normal zone of weight for age
- Undernutrition zone: below -2SD
- Severely underweight zone: below -3SD
A joint "Mother and Child Protection Card" was developed, combining the growth chart with space for immunization records, breastfeeding data, developmental milestones, and birth records. It is kept by the mother and brought to the health centre at each visit.
WHO vs. NCHS Growth Standards
The chart below shows a comparison of WHO (2006) and NCHS weight-for-age Z-score curves for girls (birth to 60 months). The WHO standards, based on the Multicentre Growth Reference Study (MGRS) conducted in Brazil, Ghana, India, Norway, Oman, and the USA, better represent the growth of healthy, breastfed children from diverse ethnic backgrounds:
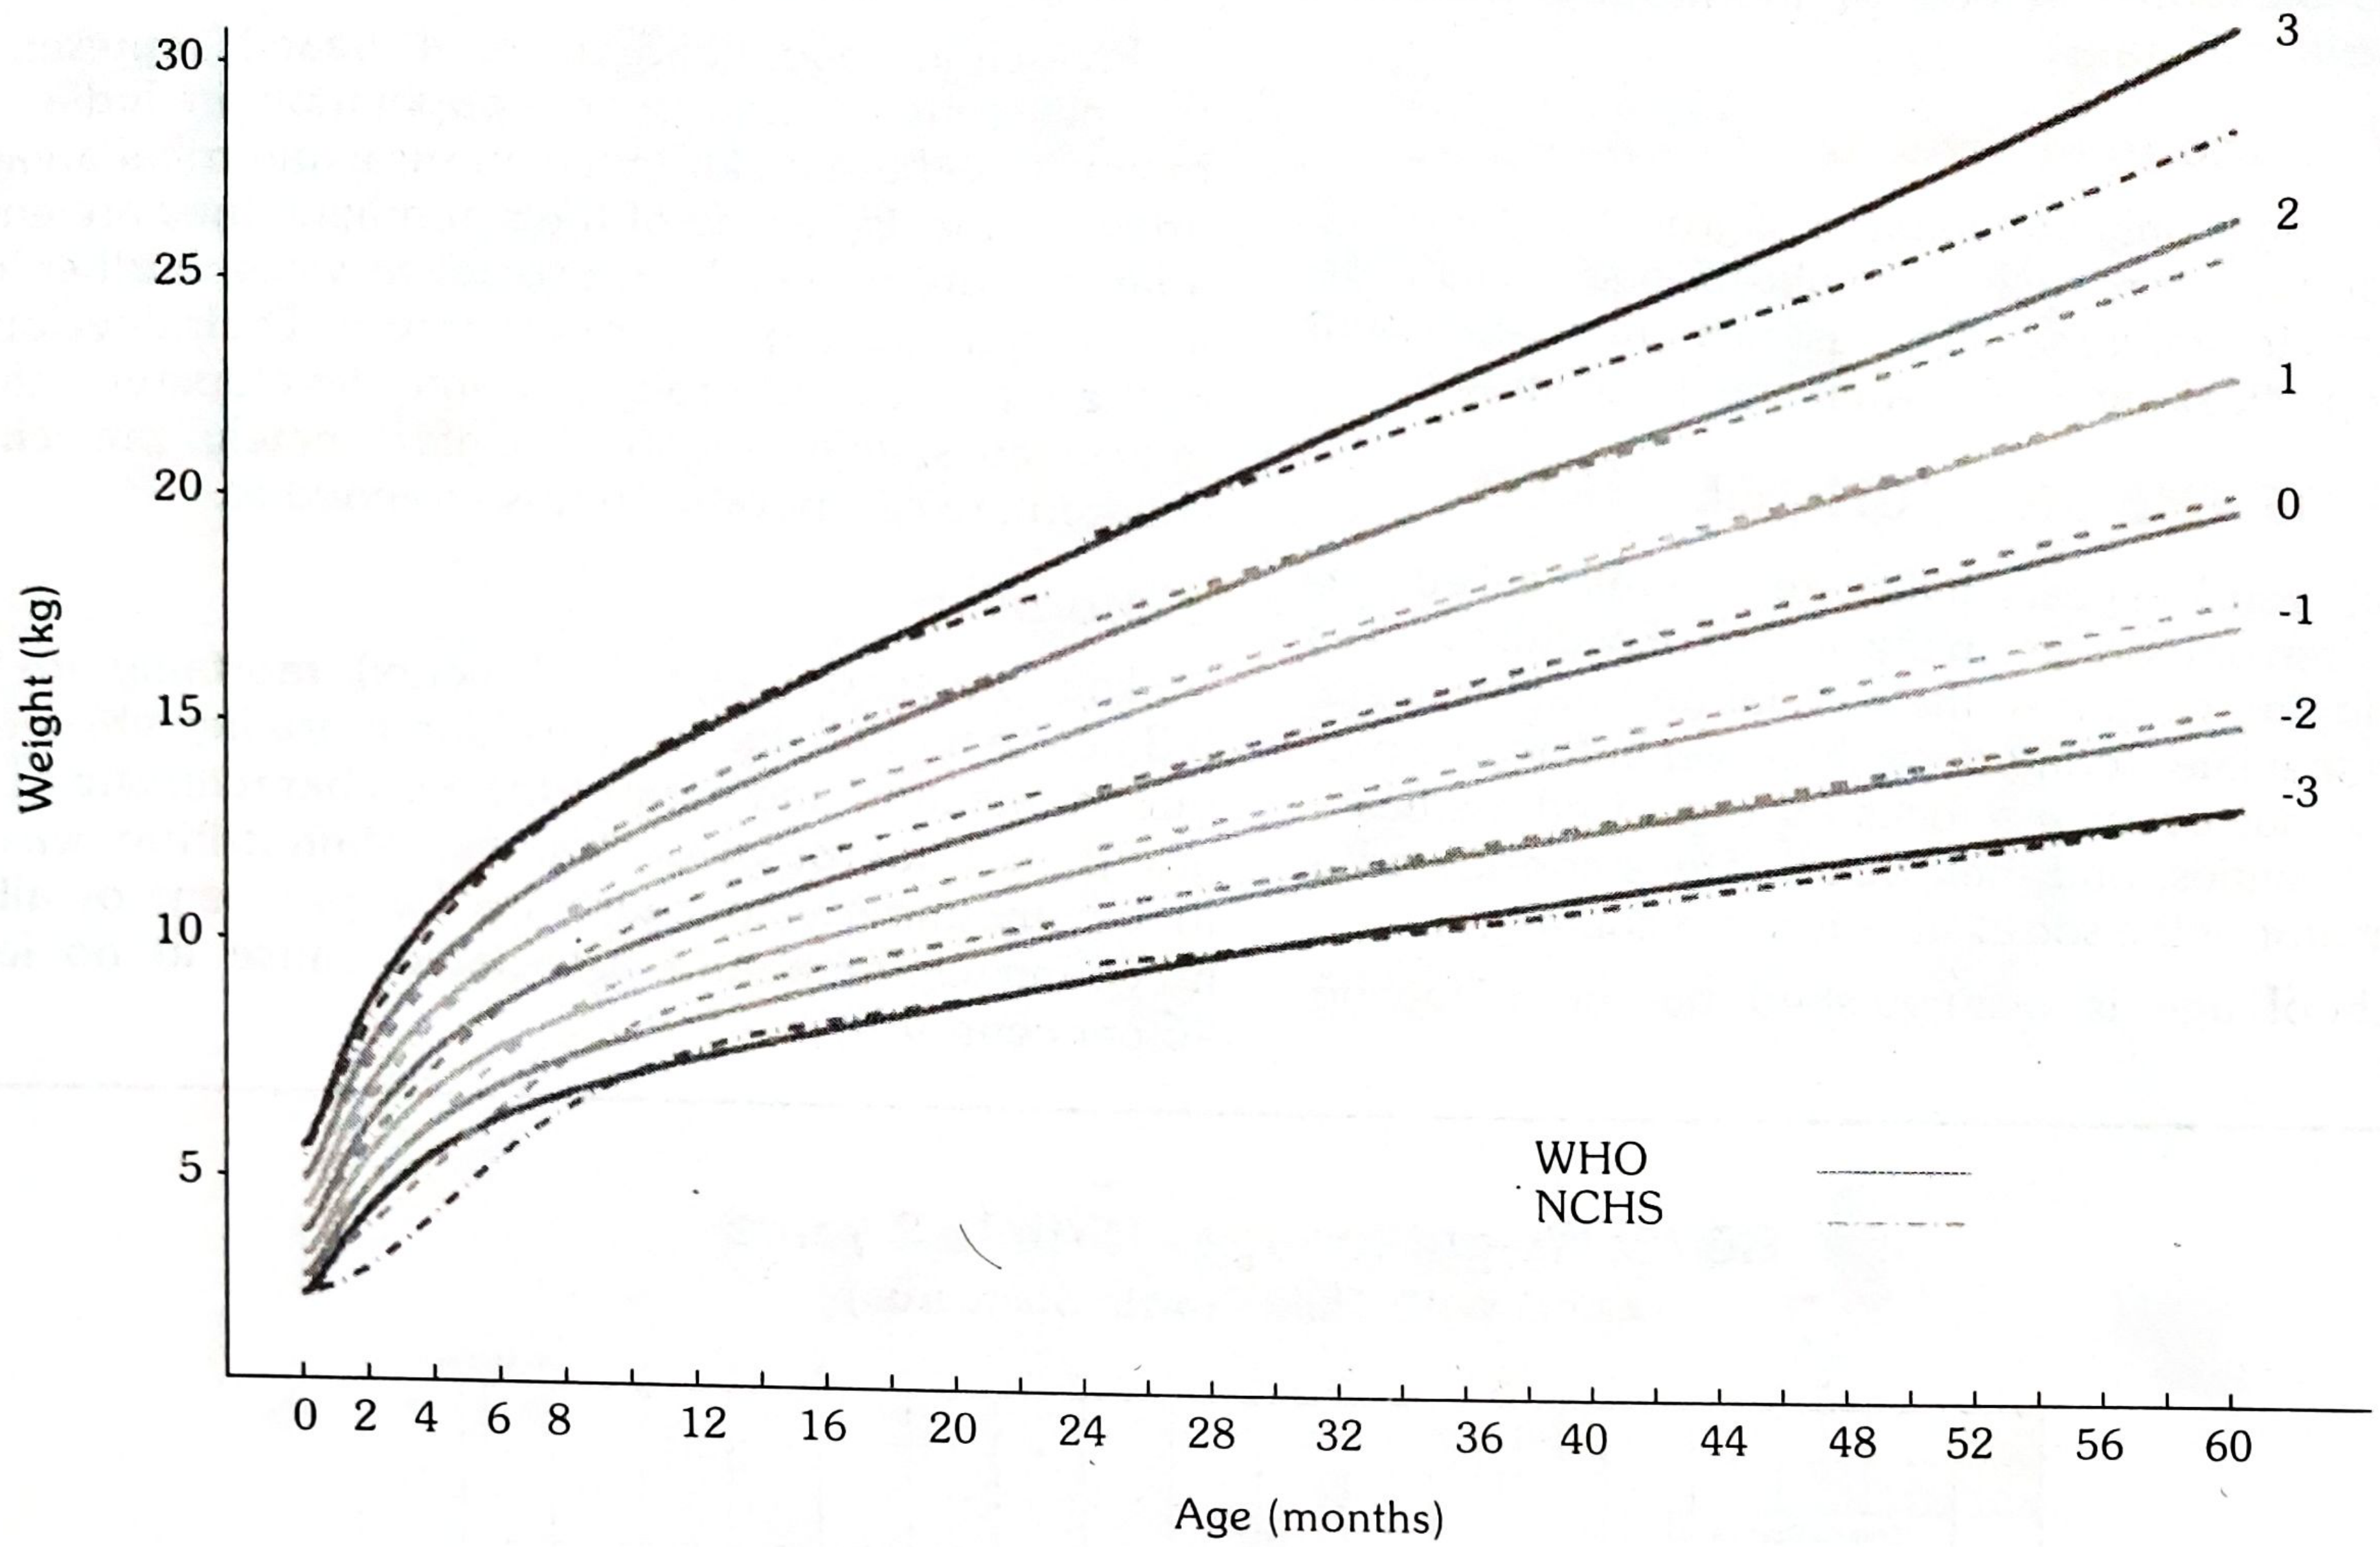
Fig. 6 - Comparison of WHO with NCHS weight-for-age Z-scores for girls (Park's Textbook of PSM)
Alternative Growth Monitoring Indicators
Growth charting (weight-for-age) is only one method. Other indicators include:
- Height-for-age (detects stunting)
- Weight-for-height (detects wasting)
- Arm circumference (MUAC) - the last two are independent of age and are especially useful when the child's exact age is unknown
Source: Park's Textbook of Preventive and Social Medicine, pp. 636-638
Give me as points
Uses of Growth Chart
(Park's Textbook of Preventive and Social Medicine)
1. Growth Monitoring
- Tracks the child's weight over time longitudinally
- Detects deviations from the normal growth trajectory early
- Weight is the most sensitive measure of growth
2. Diagnostic Tool
- Identifies "high-risk" children
- Detects malnutrition long before clinical signs and symptoms appear
- Helps classify severity using Z-score zones (-2SD, -3SD)
3. Planning and Policy Making
- Grades malnutrition objectively
- Provides evidence base for planning at local and central levels
- Helps allocate health and nutrition resources appropriately
4. Educational Tool
- Visual nature makes it easy for mothers to understand
- Educates mothers about their child's nutritional needs
- Encourages active participation in growth monitoring visits
5. Tool for Action
- Guides health workers on the type of intervention needed
- Facilitates referrals - children below -2SD need counselling; below -3SD need facility referral
- Prompts timely corrective action
6. Evaluation
- Measures effectiveness of corrective measures
- Assesses impact of nutrition programmes and special interventions
- Provides objective evidence of improvement or deterioration
7. Tool for Teaching
- Used to teach importance of adequate feeding
- Demonstrates deleterious effects of diarrhoea on growth
- Useful in training health workers and community volunteers
The growth chart has been described as a "passport to child health care" and is now a standard method of monitoring children's health and nutritional status.
This is a shared conversation. Sign in to Orris to start your own chat.