
Partograph
partograph labour monitoring cervical dilatation descent
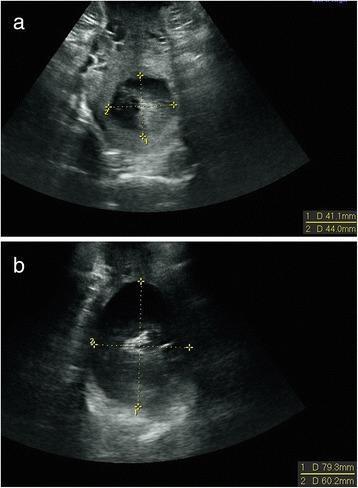
Diagnostic transperineal ultrasound images illustrating 2D measurements of cervical dilatation during labor in a transverse view. The figure contains two panels, labeled (a) and (b), representing different stages of labor progression. In panel (a), electronic calipers (D1 and D2) measure the anterior-posterior and transverse diameters of the cervical os, recording values of approximately 41.1 mm and 44.0 mm, indicating a mid-stage cervical dilatation of roughly 4.3 cm. In panel (b), the cervical opening is significantly more advanced, with measurements of 79.3 mm and 60.2 mm, corresponding to a dilatation of approximately 7.0 cm. The ultrasound captures the hypoechoic area of the dilated cervix against the surrounding soft tissue. This educational material demonstrates the use of objective ultrasound assessment as a non-invasive alternative or supplement to digital cervical examination for monitoring labor progress and cephalic presentation.
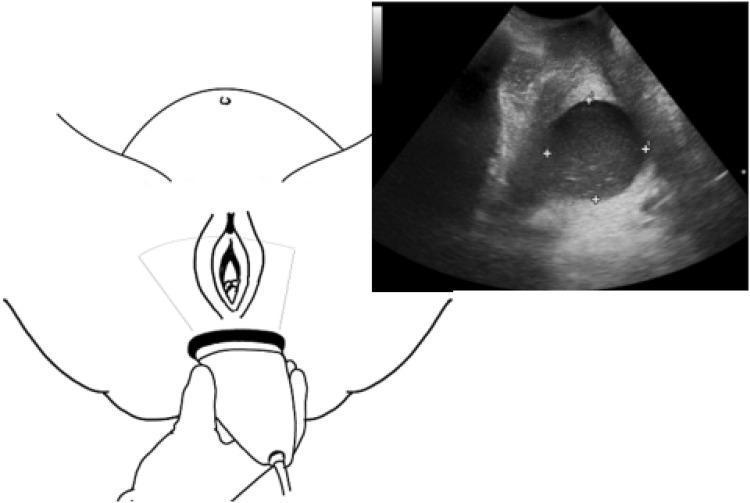
This composite educational graphic illustrates the technique and results of transperineal ultrasound for assessing cervical dilatation during labor. The left side features an anatomical diagram showing the positioning of a curvilinear ultrasound transducer at the perineum, oriented between the labia and the anus. The transducer is rotated to a transverse plane to capture the relevant internal structures. The right side displays a corresponding B-mode diagnostic ultrasound image. It shows a transverse view of the dilating cervix, characterized by a well-defined, circular hypoechoic region. Caliper markers (white plus signs) are visible on the ultrasound image, indicating the measurement of the cervical diameter in the anterior-posterior and transverse axes. The surrounding tissues exhibit varying echogenicities, representing anatomical landmarks such as the fetal head and pelvic floor structures. This material is designed for obstetrics education, demonstrating a non-invasive alternative to digital vaginal examinations for monitoring labor progression.
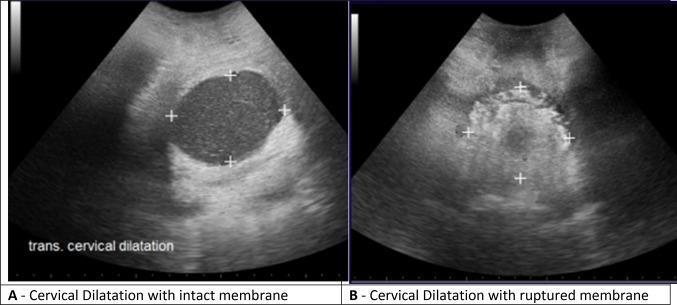
This diagnostic image consists of two side-by-side transperineal ultrasound frames in the transverse plane, comparing cervical dilatation in laboring patients. Image A displays cervical dilatation with intact membranes. The cervical canal appears as a clear, well-defined, anechoic (dark) oval space, indicating the presence of amniotic fluid within the intact sac. Four white '+' electronic calipers are placed at the anterior, posterior, and lateral margins of the cervical rim to measure the anterior-posterior (AP) and transverse diameters. Image B displays cervical dilatation with ruptured membranes. In this state, the cervical canal lacks the clear anechoic fluid space and instead shows a heterogeneous, more echogenic (brighter) appearance, likely due to the direct visualization of the fetal presenting part (scalp/hair) against the cervical tissue. Similar '+' markers are used to delineate the boundaries for measurement. This comparison illustrates the sonographic differences in the appearance of the birth canal during different stages of membrane status, serving as a non-invasive method for monitoring labor progress.
WHO partograph template alert action line labor
This composite educational figure illustrates the neuroanatomical correlates of action prediction sensitivity. Part A is a diagnostic fMRI image displaying an axial brain slice (z = 5) on a normalized T1-weighted template. A white circle highlights a region of interest (ROI) in the left head of the caudate nucleus, showing a significant positive correlation (p < 0.005, uncorrected) between neural activity and the observer's Just Noticeable Difference (JND). Part B is a corresponding scatter plot showing the relationship between behavioral and neural data. The x-axis represents the JND in milliseconds (ms), a measure of temporal sensitivity, while the y-axis represents the parameter estimate (in arbitrary units) extracted from the peak voxel in the caudate (coordinates -6 5 4). The plot features a positive regression line, demonstrating that lower sensitivity in action prediction (indicated by a higher JND) is associated with increased engagement or metabolic activity in the basal ganglia, specifically the caudate nucleus. This figure is used to teach concepts related to the neural substrates of temporal perception and prediction error in the human brain.
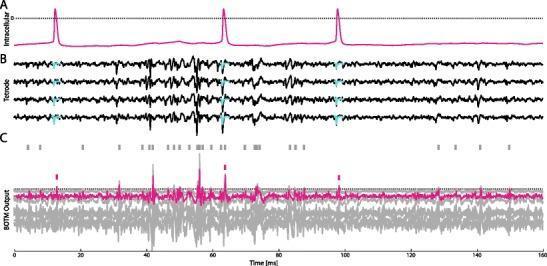
This figure presents a neurophysiological comparison between intracellular and extracellular recordings used for evaluating the Bayesian Optimal Template Matching (BOTM) spike-sorting algorithm. Panel A shows an intracellular recording (magenta trace) of a single neuron over 160 ms, displaying three distinct action potentials (spikes). Panel B displays simultaneous extracellular recordings from a four-channel tetrode, with cyan overlays indicating spike-triggered average templates corresponding to the target neuron's intracellular spikes. Panel C illustrates the BOTM output, where multiple traces represent discriminant functions for putative neurons. The target neuron is highlighted in magenta, while others are in gray. A horizontal dotted line indicates the detection threshold. Vertical ticks above the traces signify the final sorting output (magenta for the target, gray for others), demonstrating the algorithm's ability to correctly classify spikes and resolve overlaps in complex multichannel neural data.
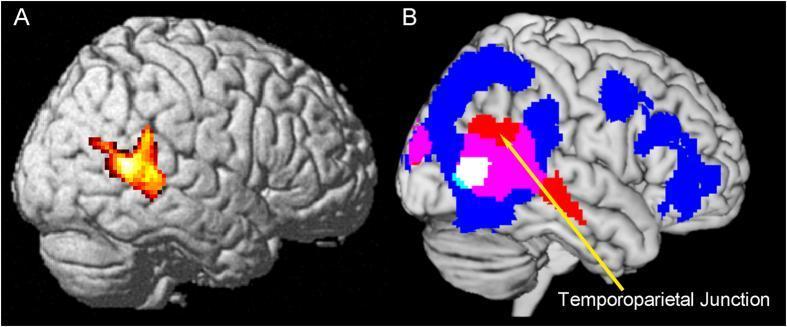
This diagnostic figure displays functional MRI (fMRI) data overlaid onto a 3D brain template to illustrate cortical activation during action observation. Figure A features a lateral view of the right hemisphere with a colored statistical map indicating activation in the posterior superior temporal sulcus (STS). The heat map intensity ranges from red (low) to yellow/white (high). Figure B presents a multi-color overlay on the ch2better template using MRIcron to show spatial conjunctions. Blue regions represent general action observation tasks, primarily located in the frontal and parietal lobes. Red regions highlight significant 'interacted regions' at the right temporoparietal junction (TPJ), as indicated by a yellow arrow. Pink areas signify the conjunction of action observation and interacted regions. Small light blue and white areas represent higher-order intersections of three experimental contrasts. This comparison distinguishes between regions for general motion processing (STS) and those specific to social cognition and effort inference (TPJ).
partograph components WHO alert action line labour monitoring
partograph filled example active labour cervical dilation fetal heart rate contractions
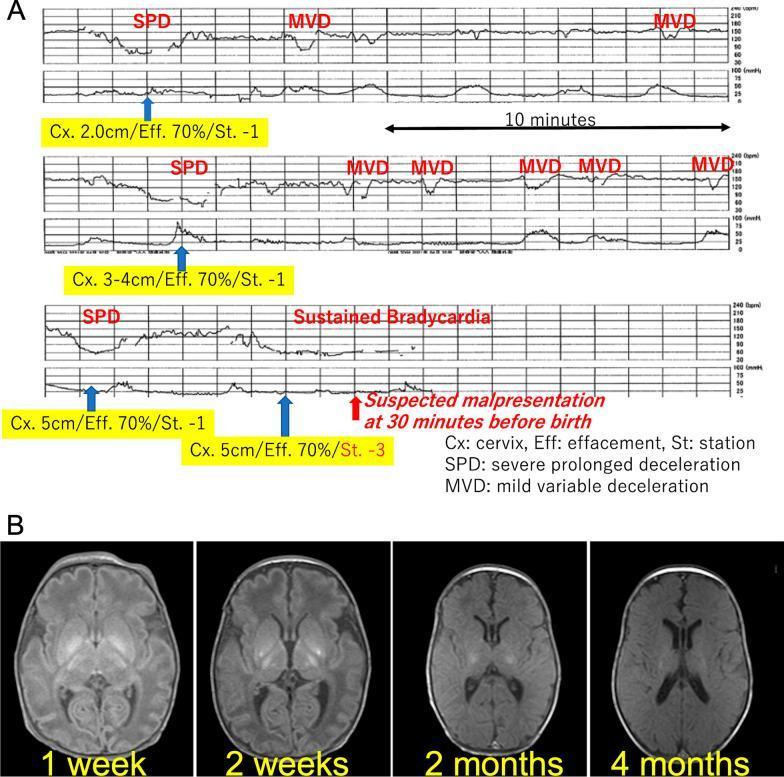
This composite educational graphic details fetal distress and its neurological sequelae. Panel A presents a sequential cardiotocography (CTG) strip documenting the final hour of labor. The upper trace shows fetal heart rate (FHR) displaying mild variable decelerations (MVD) and severe prolonged decelerations (SPD). The lower trace monitors uterine contractions. Integrated clinical data markers correlate heart rate patterns with cervical dilation (2cm to 5cm), 70% effacement, and fetal station changes (moving from -1 to a floating -3 station). The final strip demonstrates sustained terminal bradycardia, marked as 'suspected malpresentation.' Panel B displays four sequential axial brain MRI slices of the infant from 1 week to 4 months of age. These images track the evolution of hypoxic-ischemic encephalopathy (HIE), specifically highlighting progressive changes and volume loss within the basal ganglia and brain stem. The combination illustrates the clinical transition from an intrapartum non-reassuring fetal heart rate pattern to permanent neonatal neurological injury.
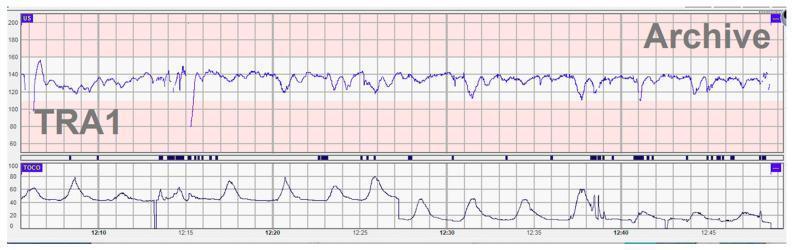
This diagnostic image shows a continuous cardiotocograph (CTG) strip, a vital tool in obstetrics for monitoring fetal well-being during labor. The upper panel displays the fetal heart rate (FHR) tracing, which shows a baseline between 120 and 140 beats per minute (bpm). Notably, the tracing exhibits severely diminished or absent beat-to-beat variability, a clinical sign often associated with fetal distress or a non-reassuring fetal status. Several variable decelerations are present, including a significant prolonged deceleration reaching approximately 80 bpm around the 12:15 timestamp. The lower panel displays the tocodynamometer (TOCO) tracing, representing uterine activity. It shows regular contractions occurring approximately every 3 to 5 minutes, each lasting roughly 60 seconds, with varying peak intensities (amplitudes) between 40 and 80 mmHg. This combination of decreased FHR variability and recurrent decelerations in the context of active labor is an important educational example of a Category II or III FHR pattern requiring close clinical correlation and potentially urgent intervention.
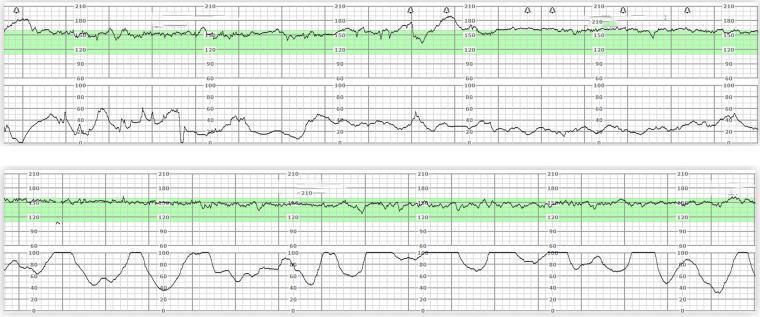
This diagnostic image displays two comparative sections of cardiotocography (CTG) strips, an essential tool in obstetrics for electronic fetal monitoring (EFM). Each strip is divided into two vertically aligned graphs. The upper graph tracks the fetal heart rate (FHR) in beats per minute (bpm), ranging from 30 to 210, with a green shaded area highlighting the normal baseline range (approximately 120–160 bpm). The lower graph monitors uterine activity (tocodynamometry), scaled from 0 to 100 relative units to indicate the frequency and duration of contractions. The top strip illustrates a baseline FHR with moderate variability and irregular, low-amplitude uterine activity. In contrast, the bottom strip demonstrates a progression to more frequent, regular, and higher-amplitude uterine contractions, indicative of active labor or uterine hyperstimulation. This visual serves to educate clinicians on interpreting fetal well-being in relation to labor progression and uterine contractions, which is critical for identifying potential fetal distress or evaluating the efficacy of tocolytic therapy.
partograph labour monitoring WHO
Partograph
Definition
Purpose
- To provide a graphic, continuous record of the progress of labour
- To give early warning of abnormal labour (prolonged labour, obstructed labour)
- To guide decisions about intervention (augmentation, referral, caesarean section)
- To monitor fetal and maternal wellbeing during labour
Structure: Three Major Sections
Part I - Fetal Condition (Top)
| Parameter | Frequency |
|---|---|
| Fetal heart rate (FHR) | Every 30 minutes |
| Status of membranes (I/R/A) | Each vaginal exam |
| Amniotic fluid colour (C/M/B/A) | Each vaginal exam |
| Moulding (0/+1/+2/+3) | Each vaginal exam |
- C = Clear
- M = Meconium stained (M1 mild, M2 moderate, M3 thick/pea soup)
- B = Blood stained
- A = Absent (dry)
- 0 = Bones separated, sutures felt
- +1 = Bones touching
- +2 = Bones overlapping but reducible
- +3 = Bones overlapping and NOT reducible (obstructed labour)
Part II - Progress of Labour (Middle)
Cervical Dilatation and Fetal Head Descent
- Plotted on the same grid: X-axis = time (hours), Y-axis = cervical dilatation (0-10 cm) / head descent (0-5/5 palpable)
- Cervical dilatation marked with X
- Fetal head descent (fifths palpable above brim) marked with O
- Normal expected rate = 1 cm/hour in active phase
The Two Key Lines
| Line | Position | Function |
|---|---|---|
| Alert line | From 4 cm, slopes at 1 cm/hr to 10 cm | Warning - labour slower than expected. Indicates need for referral from primary to higher facility. |
| Action line | Parallel to alert line, 4 hours to the right | Decision point - specific interventions required (augmentation, ARM, caesarean section) |
- Crossing the alert line = slower than 1 cm/hr - heightened vigilance; consider referral
- Crossing the action line = urgent intervention required at hospital level
Uterine Contractions
- Assessed per 10 minutes; number and duration recorded
- Duration shown by shading pattern:
- Dots = <20 seconds (weak)
- Hatching = 20-40 seconds (moderate)
- Solid/filled = >40 seconds (strong)
- Normal active labour: 3-5 contractions per 10 minutes, each >40 seconds
Part III - Maternal Condition (Bottom)
| Parameter | Frequency |
|---|---|
| Oxytocin/IV fluids/drugs | Each given |
| Pulse | Every 30 minutes |
| Blood pressure | Every 4 hours |
| Temperature | Every 2 hours |
| Urine (volume, protein, acetone) | Each void |
WHO Versions of the Partograph
| Version | Key Feature |
|---|---|
| Composite (1987) | Includes latent phase (up to 8 h); active phase from 3 cm; alert + action lines |
| Modified (2000) | Latent phase removed; active phase starts at 4 cm |
| Simplified/Color-coded | Green (left of alert) = normal; Amber (between lines) = caution; Red (right of action) = danger |
| WHO Labor Care Guide (LCG, 2020) | Active phase starts at 5 cm; adds second-stage monitoring; records supportive interventions (companionship, pain relief, position); evidence-based time limits per cm of dilatation |
Indicators of Normal Progress
- Cervical dilatation rate keeps the curve on or to the left of the alert line
- Fetal head descent coincides with cervical dilatation
- Contractions show steady increase in frequency and duration
- FHR between 120-160 bpm
- Moulding no more than +2
- Liquor clear or slightly stained
Indicators for Intervention / Referral
| Finding | Action |
|---|---|
| Cervical curve crosses alert line | Consider referral; closer monitoring |
| Cervical curve crosses action line | Augmentation, ARM, or caesarean section |
| FHR <120 or >160 | Fetal distress - urgent assessment |
| Moulding +3 | Obstructed labour - operative delivery |
| Thick meconium (M3) | Fetal distress - urgent delivery |
| Absent liquor | Suspect cord compression |
Clinical Significance
- The partograph is listed as essential for managing labour at Type B sub-centres and PHCs in India's national maternal health programme (Park's Preventive & Social Medicine).
- In trial of labour after caesarean (TOLAC), the zone 2-3 hours after the alert line carries high risk of scar rupture; the action line in this zone helps reduce rupture rate.
- A 2025 scoping review (Demissie et al., Front Glob Womens Health, PMID 41425749) mapping partograph innovations from 2000-2025 shows a shift toward electronic and digital partographs as well as the WHO Labor Care Guide replacing traditional paper-based tools.
Common Errors in Partograph Use
- Starting the partograph before the active phase (i.e., during latent phase)
- Filling it retrospectively instead of in real time
- Not initiating it at 4-5 cm / adequate contractions
- Failing to act even when the action line is crossed
- Poor training leading to incorrect plotting