
Why is homeostasis Write components of homeostasis 15 marks answer mbbs
homeostasis negative feedback loop components diagram physiology
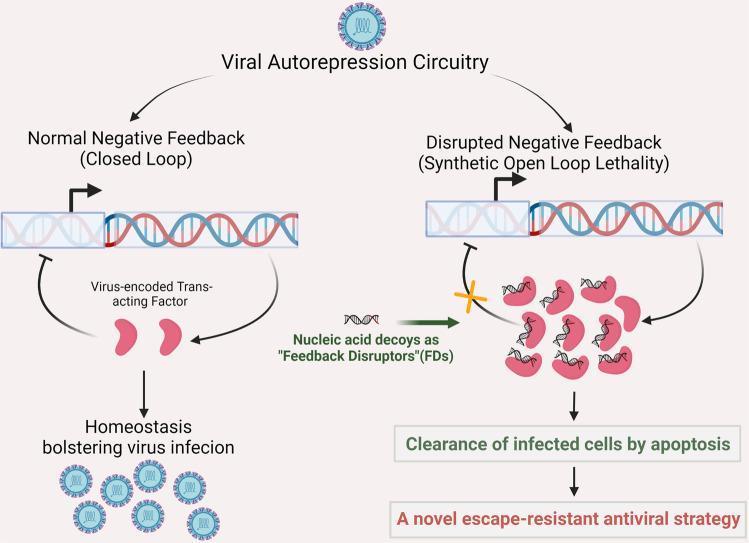
This pathophysiology diagram illustrates the concept of 'open-loop lethality' in viral autorepression circuitry as a novel antiviral strategy. The illustration is divided into two comparative scenarios: 'Normal Negative Feedback (Closed Loop)' and 'Disrupted Negative Feedback (Synthetic Open Loop Lethality)'. On the left, the natural process shows virus-encoded trans-acting factors (red shapes) binding to cis-regulatory sequences on the viral genome to inhibit excessive transcription. This closed loop maintains viral homeostasis and promotes successful infection. On the right, the introduction of synthetic nucleic acid decoys, acting as 'Feedback Disruptors' (FDs), is shown. These decoys sequester the trans-acting factors, indicated by a yellow 'X' disrupting the inhibition arrow. This disruption results in a 'synthetic open loop,' leading to unchecked viral protein expression and toxic accumulation. The diagram maps the downstream educational concepts from this disruption: the clearance of infected cells by apoptosis and the development of an escape-resistant antiviral strategy. Key components labeled include the viral genome (double helix), trans-acting factors, and viral progeny, illustrating principles of molecular virology and therapeutic design.
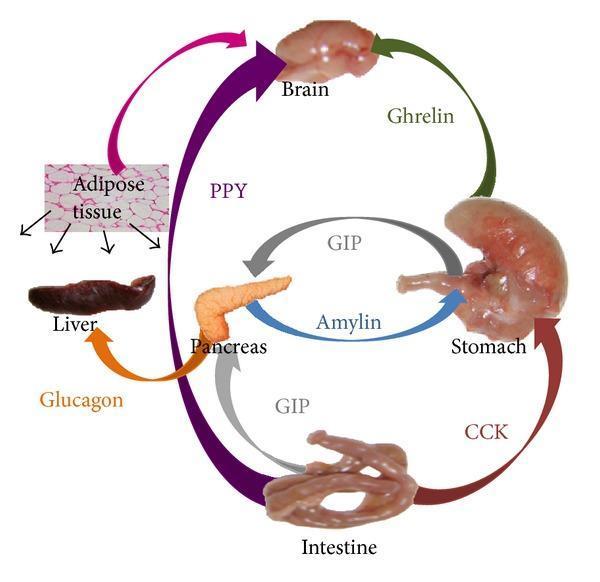
This pathophysiology diagram illustrates the complex endocrine feedback loops involved in human food-intake control and energy homeostasis. The figure features a circular arrangement of key anatomical components: the brain, stomach, intestine, pancreas, liver, and adipose tissue (depicted as a histological section). Interactions are represented by color-coded directional arrows labeled with specific peripheral signals. Key pathways shown include: Ghrelin signaling from the stomach to the brain; Peptide YY (PYY) signaling from the intestine to the brain and adipose tissue; Cholecystokinin (CCK) and Glucose-dependent insulinotropic polypeptide (GIP) from the intestine targeting the stomach and pancreas; Amylin from the pancreas to the stomach; and Glucagon signaling between the pancreas and liver. The diagram demonstrates the integration of central nervous system processing with gastrointestinal and metabolic signals to regulate appetite, satiety, and glucose metabolism. This visual is designed for intermediate to advanced medical education in endocrinology and physiology, highlighting the multiorgan dialogue that maintains metabolic balance.
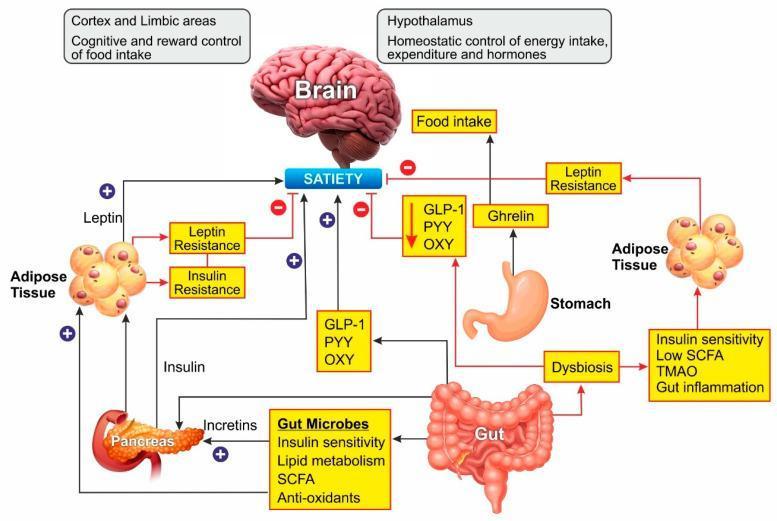
A pathophysiology diagram illustrating the gut-brain-adipose axis in energy homeostasis and obesity. The central components include the brain (specifically the cortex/limbic areas for cognitive reward and the hypothalamus for homeostatic control), stomach, gut (intestines), pancreas, and adipose tissue. Blue pathways indicate positive stimulation and healthy feedback: Leptin (from adipose), Insulin (from pancreas), and gut-derived peptides (GLP-1, PYY, OXY) stimulate the satiety center in the brain, while gut microbes promote insulin sensitivity and short-chain fatty acid (SCFA) production. Red pathways depict the pathophysiology of obesity: Ghrelin from the stomach stimulates food intake and inhibits satiety. Gut dysbiosis is shown triggering gut inflammation, low SCFA levels, and increased TMAO, which lead to insulin and leptin resistance. These resistance states create negative feedback loops that inhibit satiety signaling, further promoting excessive food intake and fat storage. The diagram serves as an educational summary of hormonal and microbial influences on metabolic health.
Homeostasis: Definition and Components
(15-Mark MBBS Answer)
DEFINITION
- Claude Bernard (1878) first described the concept of milieu intérieur (internal environment) - the extracellular fluid (ECF) bathing all tissue cells. He stated that "the constancy of the internal environment is the condition for free, independent life."
- Walter B. Cannon (1932) coined the term homeostasis to describe "the various physiologic arrangements which serve to restore the normal state, once it has been disturbed."
- Medical Physiology (Boron & Boulpaep)
WHY IS HOMEOSTASIS IMPORTANT?
- All cells of the body live in the ECF (milieu intérieur) - not in the outside world.
- Enzymes, ion channels, and cellular processes function only within narrow ranges of pH, temperature, and electrolyte concentrations.
- Even small deviations - e.g., plasma K+ rising from 4 mEq/L to 7 mEq/L - can be lethal.
- Homeostasis allows organisms to live in hostile external environments; without it, life is impossible for complex multicellular organisms.
COMPONENTS OF HOMEOSTASIS
1. STIMULUS / VARIABLE (Controlled Parameter)
- The factor being regulated - e.g., blood glucose, body temperature, blood pressure, plasma pH.
- A change (perturbation) in the controlled variable from its normal value triggers the homeostatic response.
- Example: Blood glucose rising after a meal is the stimulus.
2. RECEPTOR / SENSOR
-
A structure (cell, organ, or receptor molecule) that detects the change in the controlled variable.
-
It monitors the internal environment continuously.
-
Sends information about the current state of the variable to the control center.
-
Examples:
- Baroreceptors in the carotid sinus and aortic arch detect changes in blood pressure.
- Chemoreceptors in the carotid and aortic bodies detect changes in PO2, PCO2, pH.
- Osmoreceptors in the hypothalamus detect changes in plasma osmolality.
- Beta cells of the pancreatic islets act as sensors for blood glucose.
-
Ganong's Review of Medical Physiology (26th ed.): "Deviations from a given normal set point are detected by a sensor, and signals from the sensor trigger compensatory changes that continue until the set point is again reached."
3. CONTROL CENTER (Integrating Center / Comparator)
- Receives the afferent signal from the receptor.
- Compares the current value with the reference value (set point).
- Determines the magnitude and direction of the needed response.
- Generates an error signal (difference between actual value and set point).
- Examples:
- The hypothalamus: thermoregulatory center, osmolality control, hunger/satiety.
- The medullary cardiovascular center: blood pressure regulation.
- The respiratory center in the medulla: regulation of ventilation.
- The hypothalamus-pituitary axis: hierarchical endocrine control (e.g., hypothalamus → anterior pituitary → adrenal cortex → cortisol → blood glucose).
4. EFFECTOR
- Receives the efferent signal from the control center and executes the corrective response.
- Can be muscle, gland, or organ.
- Produces a response that brings the controlled variable back to the set point.
- Examples:
- Skeletal muscles shiver (thermogenesis) when body temperature falls.
- Sweat glands increase secretion when body temperature rises.
- Pancreatic beta cells secrete insulin in response to high blood glucose.
- The kidney increases/decreases water reabsorption in response to ADH (regulating osmolality).
- Arterioles vasoconstrict or vasodilate to regulate blood pressure.
5. FEEDBACK LOOP
A. Negative Feedback (most common, stabilizing)
- The response of the effector opposes (reverses) the original stimulus.
- Brings the variable back to the set point - stabilizes the system.
- Accounts for the vast majority of homeostatic mechanisms in the body.
- Sensor - detects the parameter
- Comparator - compares to the set point, generates a difference (error) signal
- Gain - the error signal is multiplied by a proportionality factor
- Effector - output activates an effector that opposes the deviation
- Blood glucose rises → Insulin secreted → Glucose uptake increases → Blood glucose falls back to set point.
- Blood pressure rises → Baroreceptors fire → Vagus nerve slows heart → BP falls.
- Core temperature rises → Sweating + vasodilation → Heat loss → Temperature returns to 37°C.
B. Positive Feedback (amplifying, destabilizing - used in special situations)
- The response reinforces the original stimulus - drives the variable further from the set point until a specific endpoint is reached.
- Used where a rapid, explosive, self-terminating response is needed.
- Parturition (childbirth): Uterine contractions push fetal head against cervix → more oxytocin released → stronger contractions → delivery (endpoint terminates the loop).
- Blood clotting (platelet aggregation): Platelet activation releases ADP → recruits more platelets → clot forms.
- Nerve action potential: Depolarization opens more Na+ channels → more depolarization → until reversal at +30 mV (inactivation terminates the cycle).
- LH surge at ovulation: Rising estrogen → positive feedback on pituitary → LH surge → ovulation.
HIERARCHY AND COMPLEXITY OF FEEDBACK LOOPS
- Synergistic loops: Insulin lowers blood glucose; glucagon raises it - opposing loops that together maintain glucose in a narrow range.
- Antagonistic loops: Epinephrine and cortisol both raise blood glucose; insulin opposes them.
- Hierarchy: Hypothalamus controls anterior pituitary → which controls adrenal cortex → which releases cortisol → which controls blood glucose.
- Medical Physiology (Boron & Boulpaep), Chapter 1
ORGAN SYSTEMS CONTRIBUTING TO HOMEOSTASIS
| System | Homeostatic Function |
|---|---|
| Cardiovascular | Maintains blood pressure, perfusion of tissues |
| Respiratory | Regulates PO2, PCO2, pH |
| Renal | Regulates plasma osmolality, electrolytes, acid-base, blood volume |
| Endocrine | Regulates glucose, calcium, growth, reproduction via hormones |
| Nervous | Integrates sensory input; controls effectors via autonomic and somatic systems |
| Hepatic | Metabolic homeostasis - glucose buffering, protein synthesis, detoxification |
| Thermoregulatory | Maintains core temperature at ~37°C |
CLINICAL RELEVANCE
- Failure of glucose homeostasis → Diabetes mellitus
- Failure of blood pressure homeostasis → Hypertension / Shock
- Failure of pH homeostasis → Acidosis / Alkalosis
- Failure of temperature homeostasis → Fever / Hypothermia
- Failure of electrolyte homeostasis → Arrhythmias (K+/Ca2+), Seizures (Na+/Ca2+)
SUMMARY TABLE
| Component | Role | Example |
|---|---|---|
| Stimulus/Variable | Parameter to be regulated | Blood glucose |
| Receptor/Sensor | Detects deviation | Pancreatic beta cells, osmoreceptors |
| Control Center | Compares to set point, generates error signal | Hypothalamus, medullary centers |
| Effector | Executes corrective response | Pancreas secretes insulin, kidneys reabsorb water |
| Negative Feedback | Opposes deviation, restores set point | Insulin lowers glucose |
| Positive Feedback | Amplifies, used for explosive endpoints | Parturition, coagulation, action potential |
- Medical Physiology, Boron & Boulpaep - Chapter 1: Foundations of Physiology
- Ganong's Review of Medical Physiology, 26th Ed. - Chapter 2: Functional Morphology and Homeostasis
Define enzyme factors affecting enzyme activity(draw graphs where needed) Michael menten constant and significance and lineweaver burl plot
Enzymes: Definition, Factors Affecting Activity, Michaelis-Menten Kinetics & Lineweaver-Burk Plot
I. DEFINITION OF AN ENZYME
- Enzymes act by forming an enzyme-substrate (ES) complex at the active site
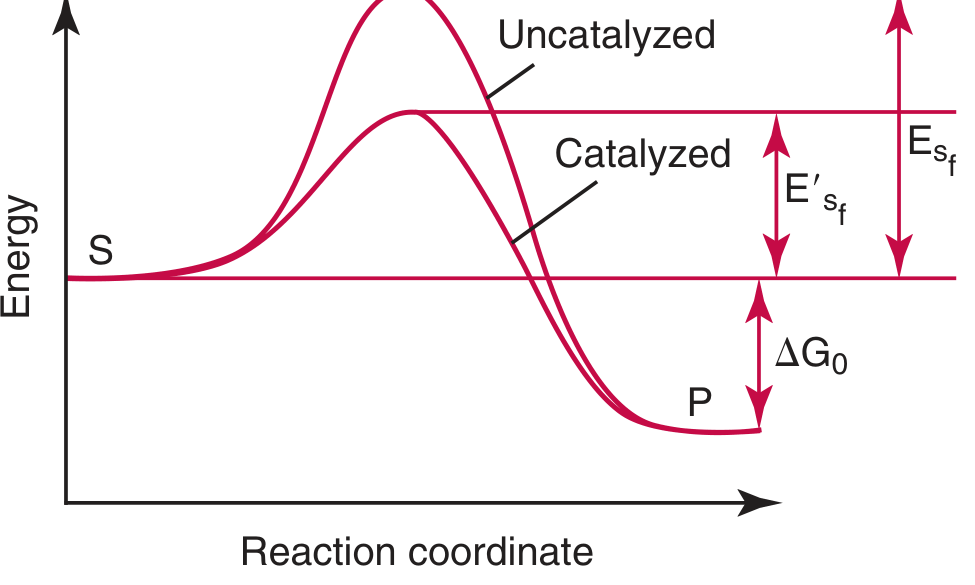
- They lower the activation energy (Ea) of a reaction, dramatically increasing reaction rate
- They are highly specific (one enzyme, one substrate or class of substrates)
- They are not consumed - they are regenerated after each reaction cycle
E + S ⇌ ES → E + P
k₁ k₋₁ k₂
- Tietz Textbook of Laboratory Medicine, 7th Ed.
II. FACTORS AFFECTING ENZYME ACTIVITY
1. ENZYME CONCENTRATION
- When substrate is present in excess (saturating), the rate of reaction is directly proportional to enzyme concentration
- Adding more enzyme increases the concentration of the ES complex, and therefore increases the overall rate
- This is the basis for quantitative determination of enzymes in clinical labs (measuring reaction rates)
Reaction rate
| /
| /
| /
| / (linear relationship)
| /
|____/________________
[Enzyme]
2. SUBSTRATE CONCENTRATION (and the Michaelis-Menten curve)
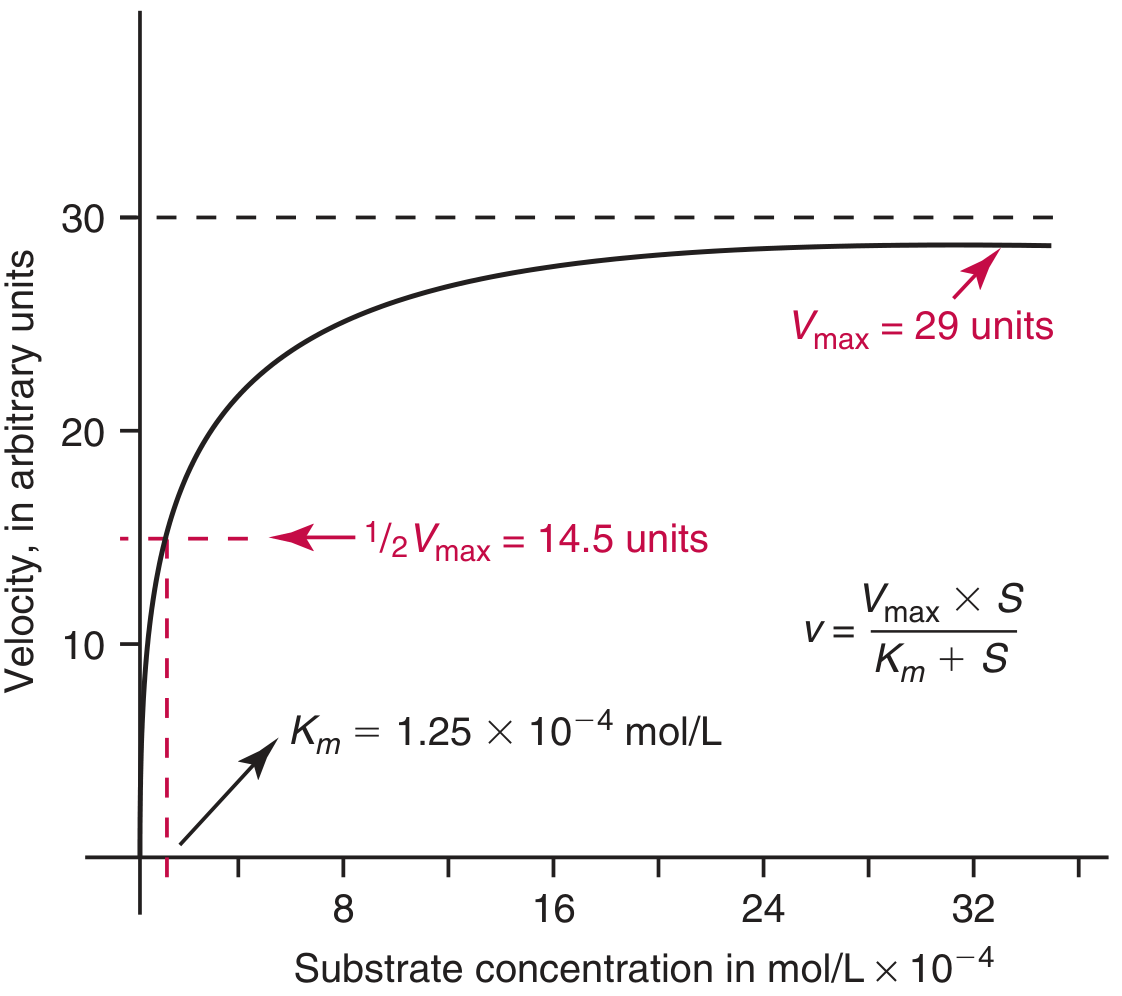
- At low [S]: reaction is first order - rate is proportional to [S] (only a fraction of enzyme is bound to substrate)
- At high [S]: reaction is zero order - rate is independent of [S] (all enzyme is saturated with substrate → maximum velocity = Vmax)
- The relationship produces a rectangular hyperbola
3. TEMPERATURE
- Reaction rate increases with rising temperature (Q₁₀ = 1.7 to 2.5 for most enzymes)
- However, at high temperatures, the enzyme undergoes thermal denaturation (irreversible loss of 3D structure)
- These opposing effects produce an optimal temperature (bell-shaped curve)
- For most human enzymes: optimal temperature ~37°C (body temperature)
- At 60-70°C: thermal inactivation becomes virtually instantaneous
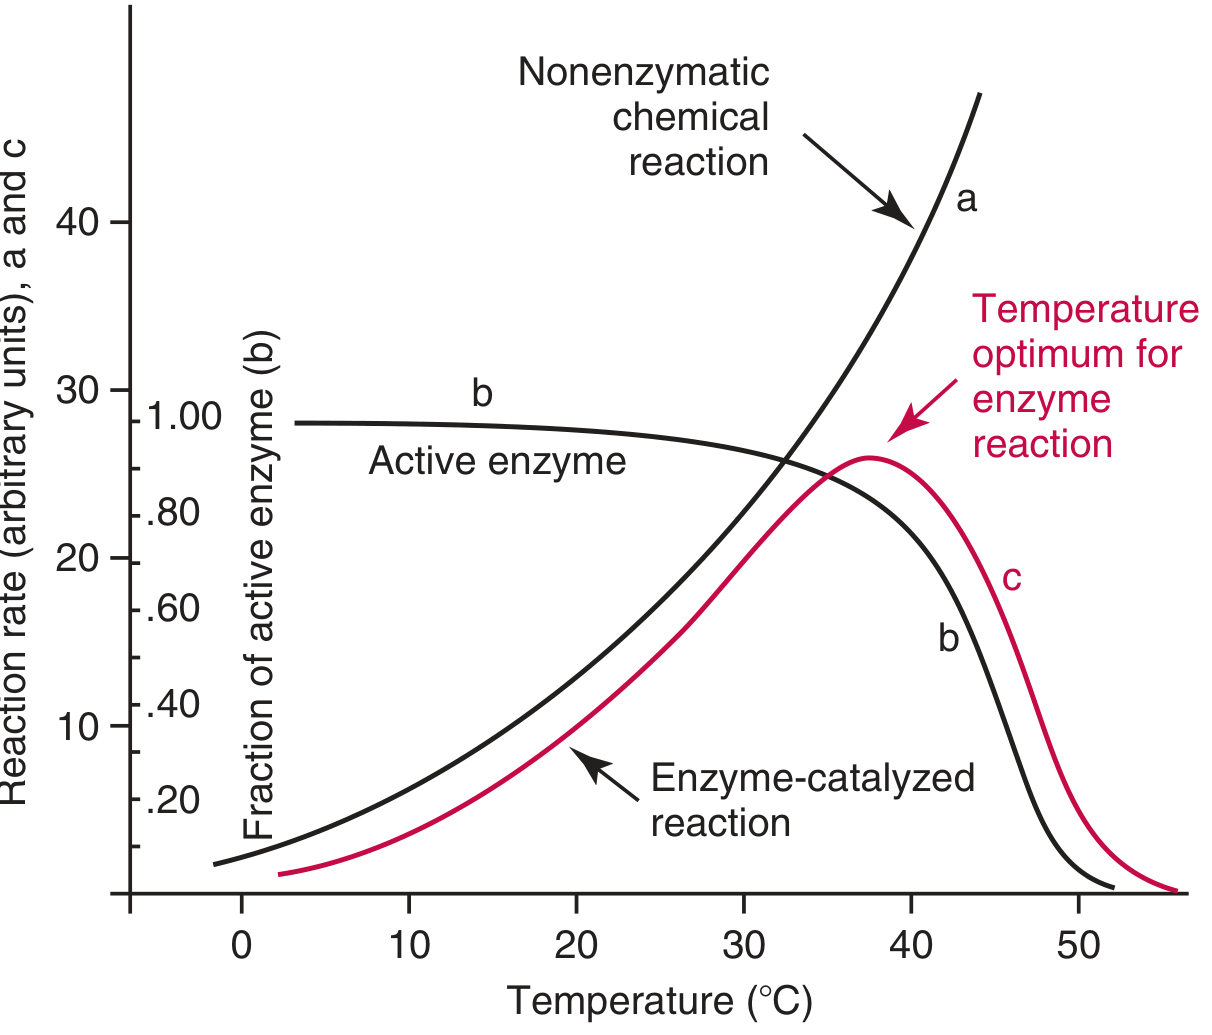
- Curve a: Non-enzymatic reaction - continues to rise with temperature
- Curve b: Fraction of active enzyme - decreases at high temperatures (denaturation)
- Curve c: Enzyme-catalyzed reaction - bell-shaped, with clear temperature optimum
4. pH
- Enzyme activity shows marked pH dependence (bell-shaped curve with a pH optimum)
- pH affects:
- Ionization of amino acid side chains at the active site (e.g., His, Asp, Lys, Cys)
- Ionization of the substrate itself
- The 3D conformation of the enzyme - extreme pH causes irreversible denaturation
| Enzyme | pH Optimum |
|---|---|
| Pepsin | 1.5 - 2.0 |
| Trypsin | 7.8 - 8.0 |
| Alkaline phosphatase (ALP) | 9.0 - 10.5 |
| Salivary amylase | 6.8 - 7.0 |
| Urease | 7.0 |
Enzyme
Activity
| /\
| / \
| / \
| / \
|____/________\____
pH opt
pH →
5. INHIBITORS
A. Competitive Inhibition
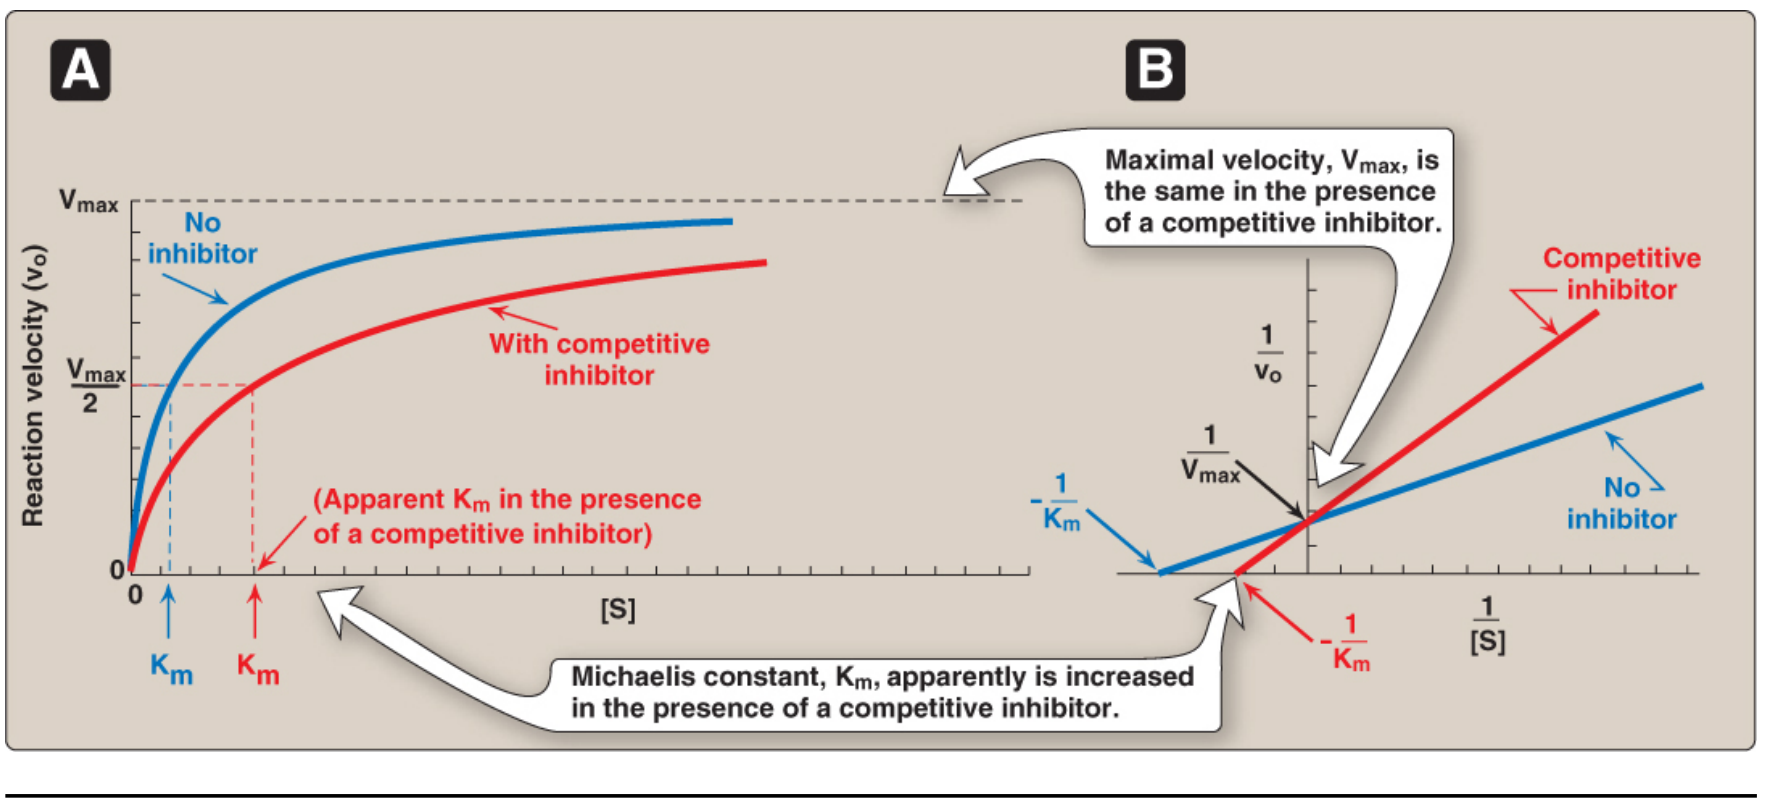
- Inhibitor structurally resembles the substrate and binds to the same active site
- Competes with substrate for active site binding
- Effect: Km increases (apparent); Vmax is unchanged (can be overcome by excess substrate)
- Reversible - increasing [S] overcomes inhibition
B. Noncompetitive Inhibition
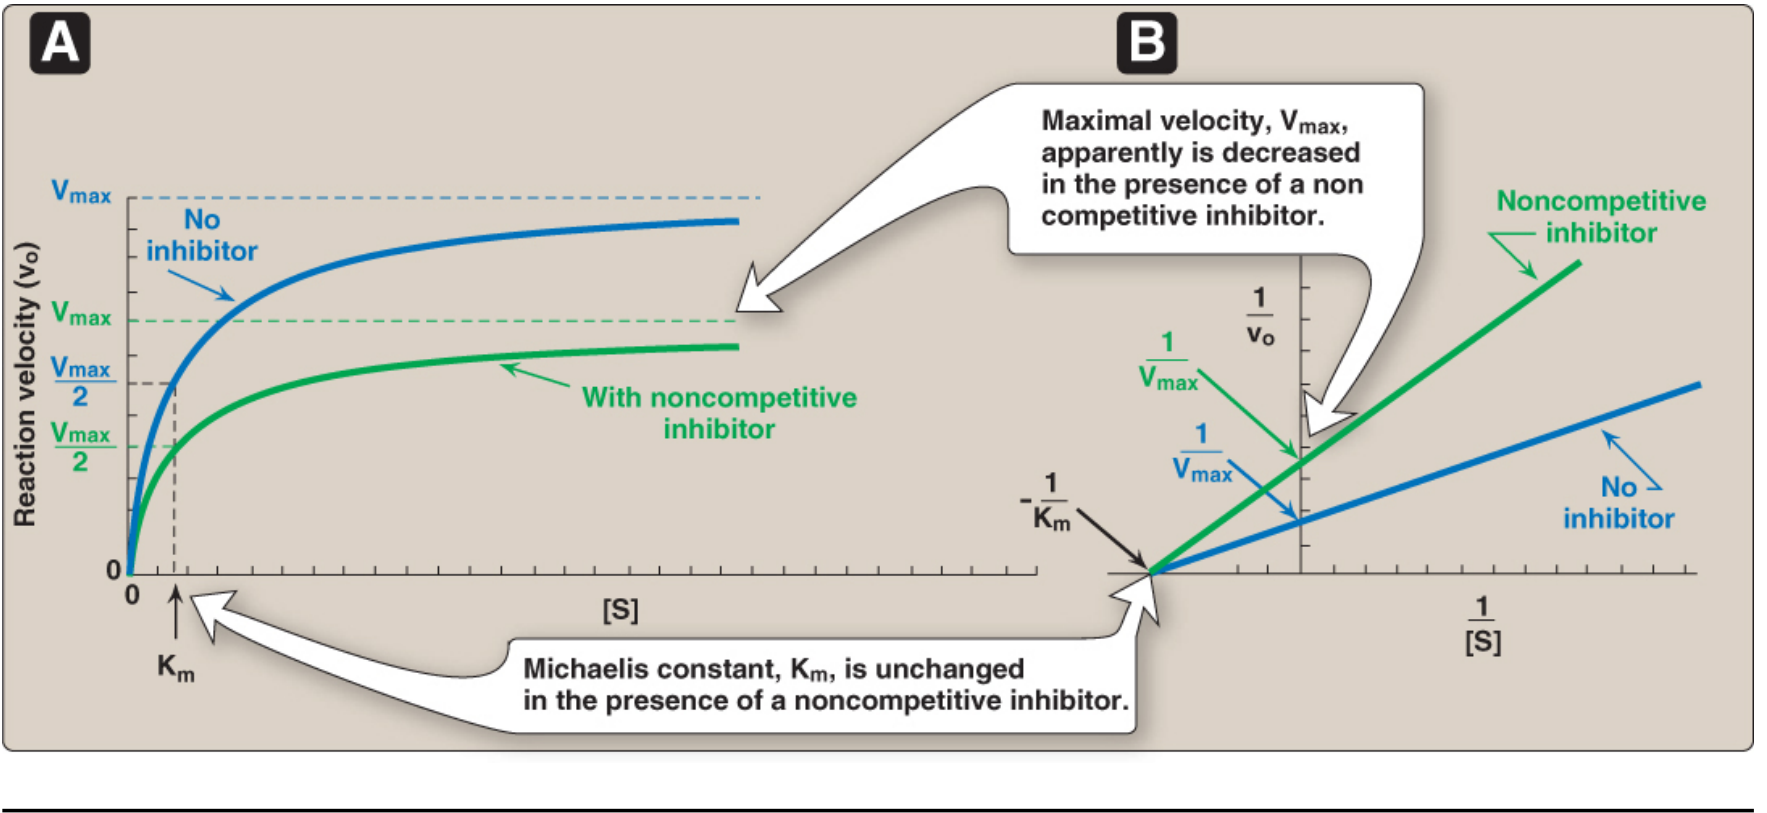
- Inhibitor binds to a different site (allosteric site) on the enzyme - can bind to both free enzyme AND the ES complex
- Does not compete with substrate - binding is independent
- Effect: Vmax decreases; Km is unchanged
- Cannot be overcome by increasing substrate concentration
C. Irreversible Inhibition
- Inhibitor forms a covalent bond with the enzyme - enzyme is permanently inactivated
- Cannot be reversed by dilution or excess substrate
- Example: Organophosphate compounds (nerve agents, insecticides) irreversibly inhibit acetylcholinesterase; Lead irreversibly inhibits ferrochelatase (heme synthesis)
6. ACTIVATORS AND COFACTORS
-
Many enzymes require metal ions (cofactors) for full activity:
- Mg²⁺ (kinases, ATPases)
- Zn²⁺ (carboxypeptidase, carbonic anhydrase)
- Fe²⁺/Fe³⁺ (cytochrome oxidase, peroxidase)
- Ca²⁺ (calmodulin-dependent enzymes)
- Co²⁺, Cu²⁺, Mn²⁺
-
Coenzymes (e.g., NAD⁺, FAD, Coenzyme A) act as co-substrates, accepting or donating chemical groups during catalysis
III. MICHAELIS-MENTEN CONSTANT (Km)
Derivation
Definition of Km
Significance of Km
-
Measure of enzyme-substrate affinity:
- Low Km = high affinity (enzyme reaches half-maximal rate at a low substrate concentration)
- High Km = low affinity (enzyme needs more substrate to reach half-maximal rate)
-
Comparison of isoenzymes: Isoenzymes (e.g., LDH isoforms) from different tissues typically differ in their Km values for the same substrate
-
Identification of the physiological substrate: For enzymes that can act on multiple substrates, the substrate with the lowest Km is most likely the physiological substrate
-
Comparing similar enzymes from different species or sources
-
Setting assay conditions: In clinical enzyme assays, substrate concentration is maintained at ≥ 10 × Km (achieves ~91% of Vmax) to ensure zero-order kinetics and accurate measurement
-
Clinical importance - Hexokinase vs. Glucokinase:
- Hexokinase: Km for glucose ~0.1 mM (high affinity - saturated at normal blood glucose)
- Glucokinase (liver/beta cells): Km for glucose ~5-10 mM (low affinity - acts as a glucose sensor, activity responds to post-meal glucose rises)
-
Km of ~10⁻⁵ to 10⁻³ mol/L for the majority of enzymes
IV. LINEWEAVER-BURK PLOT (Double-Reciprocal Plot)
Problem with the Michaelis-Menten hyperbola
The Lineweaver-Burk Transformation
Reading the Graph
![Lineweaver-Burk plot showing a straight line with y-intercept at 1/Vmax and x-intercept at -1/Km; x-axis is 1/[S], y-axis is 1/v₀](https://cdn.orris.care/cdss_images/97e1ac12ff3f834e86b6e1c88679dcf3fc798ffb2c801f21d1429bad97a5775e.png)
| Parameter | Location on Plot |
|---|---|
| y-intercept | = 1/V_max |
| x-intercept | = -1/K_m |
| Slope | = Km/V_max |
Uses of the Lineweaver-Burk Plot
- Accurate determination of Km and Vmax from experimental data
- Distinguishing types of enzyme inhibition - the most important application
Lineweaver-Burk Plot in Enzyme Inhibition
| Type | Effect on Km | Effect on Vmax | L-B Plot Feature |
|---|---|---|---|
| Competitive | Km ↑ (apparent) | Vmax unchanged | Lines intersect ON the y-axis (same 1/Vmax, different x-intercepts) |
| Noncompetitive | Km unchanged | Vmax ↓ | Lines intersect ON the x-axis (same -1/Km, different y-intercepts) |
| Uncompetitive | Km ↓ (apparent) | Vmax ↓ | Lines are parallel (same slope, different intercepts on both axes) |
Limitations of Lineweaver-Burk Plot
- Points at low [S] (high values of 1/[S]) are subject to greater experimental error and are visually over-weighted
- Distortion of error is greatest at the extremes where the line is extrapolated
- Modern practice uses nonlinear regression software (e.g., DynaFit, SigmaPlot) to fit kinetic data directly
SUMMARY TABLE
| Factor | Effect |
|---|---|
| ↑ Enzyme concentration | ↑ Rate (proportional) |
| ↑ Substrate concentration | ↑ Rate (hyperbolic) → plateaus at Vmax |
| Temperature (rising) | ↑ Rate until optimum (~37°C), then ↓ (denaturation) |
| pH (deviation from optimum) | ↓ Rate (ionization changes; denaturation at extremes) |
| Competitive inhibitor | Apparent Km ↑, Vmax unchanged |
| Noncompetitive inhibitor | Km unchanged, Vmax ↓ |
| Irreversible inhibitor | Permanent loss of enzyme activity |
| Cofactors/Activators | Required for full activity |
- Tietz Textbook of Laboratory Medicine, 7th Ed., Chapter 25: Enzyme Kinetics
- Lippincott's Illustrated Reviews: Biochemistry, 8th Ed., Chapter 5: Enzymes
- Henry's Clinical Diagnosis and Management by Laboratory Methods, Chapter 21: Enzyme Kinetics
Write the classification of enzymes giving examples an mechism of action of enzymes
Classification of Enzymes and Mechanism of Action
MBBS Biochemistry
PART I: DEFINITION
PART II: CLASSIFICATION OF ENZYMES
A. IUB / EC Nomenclature System
- Each enzyme has a systematic name (describes the reaction) and a trivial/practical name
- Each enzyme carries a unique EC number with 4 digits: EC a.b.c.d
- 1st digit = Class (one of 6)
- 2nd digit = Subclass
- 3rd digit = Sub-subclass
- 4th digit = Serial number within sub-subclass
- ATP + creatine → ADP + creatine phosphate
The Six Major Classes of Enzymes (IUB Classification)
CLASS 1: OXIDOREDUCTASES (EC 1.x.x.x)
| Enzyme | EC Number | Reaction |
|---|---|---|
| Lactate dehydrogenase (LDH) | 1.1.1.27 | L-Lactate + NAD⁺ ⇌ Pyruvate + NADH |
| Glucose-6-phosphate dehydrogenase (G6PD) | 1.1.1.49 | Glucose-6-P + NADP⁺ → 6-Phosphogluconate + NADPH |
| Alcohol dehydrogenase | 1.1.1.1 | Ethanol + NAD⁺ → Acetaldehyde + NADH |
| Glutamate dehydrogenase | 1.4.1.3 | L-Glutamate + NAD⁺ → α-Ketoglutarate + NH₄⁺ + NADH |
| Cytochrome c oxidase | 1.9.3.1 | Transfers electrons to O₂ in mitochondrial ETC |
| Monoamine oxidase (MAO) | 1.4.3.4 | Oxidative deamination of monoamines |
CLASS 2: TRANSFERASES (EC 2.x.x.x)
| Enzyme | EC Number | Group Transferred | Reaction |
|---|---|---|---|
| Aspartate aminotransferase (AST/GOT) | 2.6.1.1 | Amino group (-NH₂) | Aspartate + α-Ketoglutarate → Oxaloacetate + Glutamate |
| Alanine aminotransferase (ALT/GPT) | 2.6.1.2 | Amino group (-NH₂) | Alanine + α-Ketoglutarate → Pyruvate + Glutamate |
| Hexokinase | 2.7.1.1 | Phosphate group | Glucose + ATP → Glucose-6-P + ADP |
| Creatine kinase (CK) | 2.7.3.2 | Phosphate group | Creatine + ATP → Creatine phosphate + ADP |
| Thymidylate synthase | 2.1.1.x | Methyl group | dUMP → dTMP |
CLASS 3: HYDROLASES (EC 3.x.x.x)
| Enzyme | EC Number | Bond Hydrolyzed | Reaction |
|---|---|---|---|
| Trypsin | 3.4.21.4 | Peptide bond | Proteins → peptides (cleaves after Arg/Lys) |
| Chymotrypsin | 3.4.21.1 | Peptide bond | Proteins → peptides (cleaves after aromatic/bulky residues) |
| Alkaline phosphatase (ALP) | 3.1.3.1 | Phosphoester bond | Phosphate esters → alcohol + Pi |
| Acid phosphatase | 3.1.3.2 | Phosphoester bond | Phosphate esters → alcohol + Pi (pH 4-6) |
| Lipase (pancreatic) | 3.1.1.3 | Ester bond | Triglycerides → fatty acids + glycerol |
| Amylase | 3.2.1.1 | Glycosidic bond | Starch → maltose + oligosaccharides |
| Acetylcholinesterase | 3.1.1.7 | Ester bond | Acetylcholine → choline + acetate |
| Adenosine deaminase | 3.5.4.4 | C-N bond | Adenosine → inosine + NH₃ |
CLASS 4: LYASES (EC 4.x.x.x)
| Enzyme | EC Number | Reaction |
|---|---|---|
| Pyruvate decarboxylase | 4.1.1.1 | Pyruvate → Acetaldehyde + CO₂ |
| Pyruvate carboxylase | 4.1.1.31 | Pyruvate + CO₂ → Oxaloacetate (gluconeogenesis) |
| Aldolase | 4.1.2.13 | Fructose-1,6-bisphosphate → DHAP + Glyceraldehyde-3-P |
| Carbonic anhydrase | 4.2.1.1 | CO₂ + H₂O ⇌ H₂CO₃ (H⁺ + HCO₃⁻) |
| Fumarase (fumarate hydratase) | 4.2.1.2 | Fumarate + H₂O ⇌ Malate (TCA cycle) |
| Argininosuccinate lyase | 4.3.2.1 | Argininosuccinate → Arginine + Fumarate (urea cycle) |
CLASS 5: ISOMERASES (EC 5.x.x.x)
| Enzyme | EC Number | Reaction |
|---|---|---|
| Phosphoglucose isomerase (PGI) | 5.3.1.9 | Glucose-6-P ⇌ Fructose-6-P (glycolysis) |
| Triose phosphate isomerase (TPI) | 5.3.1.1 | DHAP ⇌ Glyceraldehyde-3-P (glycolysis) |
| Phosphoglucomutase | 5.4.2.2 | Glucose-1-P ⇌ Glucose-6-P (glycogen metabolism) |
| Alanine racemase | 5.1.1.1 | L-Alanine ⇌ D-Alanine (bacterial cell wall synthesis) |
| Protein disulfide isomerase | 5.3.4.1 | Rearranges disulfide bonds in protein folding |
CLASS 6: LIGASES (EC 6.x.x.x)
| Enzyme | EC Number | Reaction |
|---|---|---|
| DNA ligase | 6.5.1.1 | Joins DNA strands (seals nicks in DNA replication/repair) |
| Pyruvate carboxylase | 6.4.1.1 | Pyruvate + CO₂ + ATP → Oxaloacetate (gluconeogenesis) |
| Acetyl-CoA carboxylase | 6.4.1.2 | Acetyl-CoA + CO₂ + ATP → Malonyl-CoA (fatty acid synthesis) |
| Aminoacyl-tRNA synthetases (20 types) | 6.1.1.x | Amino acid + tRNA + ATP → Aminoacyl-tRNA (protein synthesis) |
| Glutamine synthetase | 6.3.1.2 | Glutamate + NH₃ + ATP → Glutamine |
Summary Table - Six Classes of Enzymes
| Class | Name | Reaction Type | Key Example |
|---|---|---|---|
| 1 | Oxidoreductases | Oxidation-reduction (electron transfer) | LDH, ALT, G6PD |
| 2 | Transferases | Group transfer | AST, ALT, Hexokinase, CK |
| 3 | Hydrolases | Hydrolysis (bond cleavage by H₂O) | Trypsin, ALP, Lipase, Amylase |
| 4 | Lyases | Non-hydrolytic removal/addition across bonds | Aldolase, Carbonic anhydrase |
| 5 | Isomerases | Intramolecular rearrangement | Phosphoglucose isomerase |
| 6 | Ligases | Bond formation + ATP | DNA ligase, Acetyl-CoA carboxylase |
PART III: MECHANISM OF ACTION OF ENZYMES
A. The Active Site
- The substrate binds (substrate-binding site)
- Catalysis occurs (catalytic site)
B. How Enzymes Lower Activation Energy
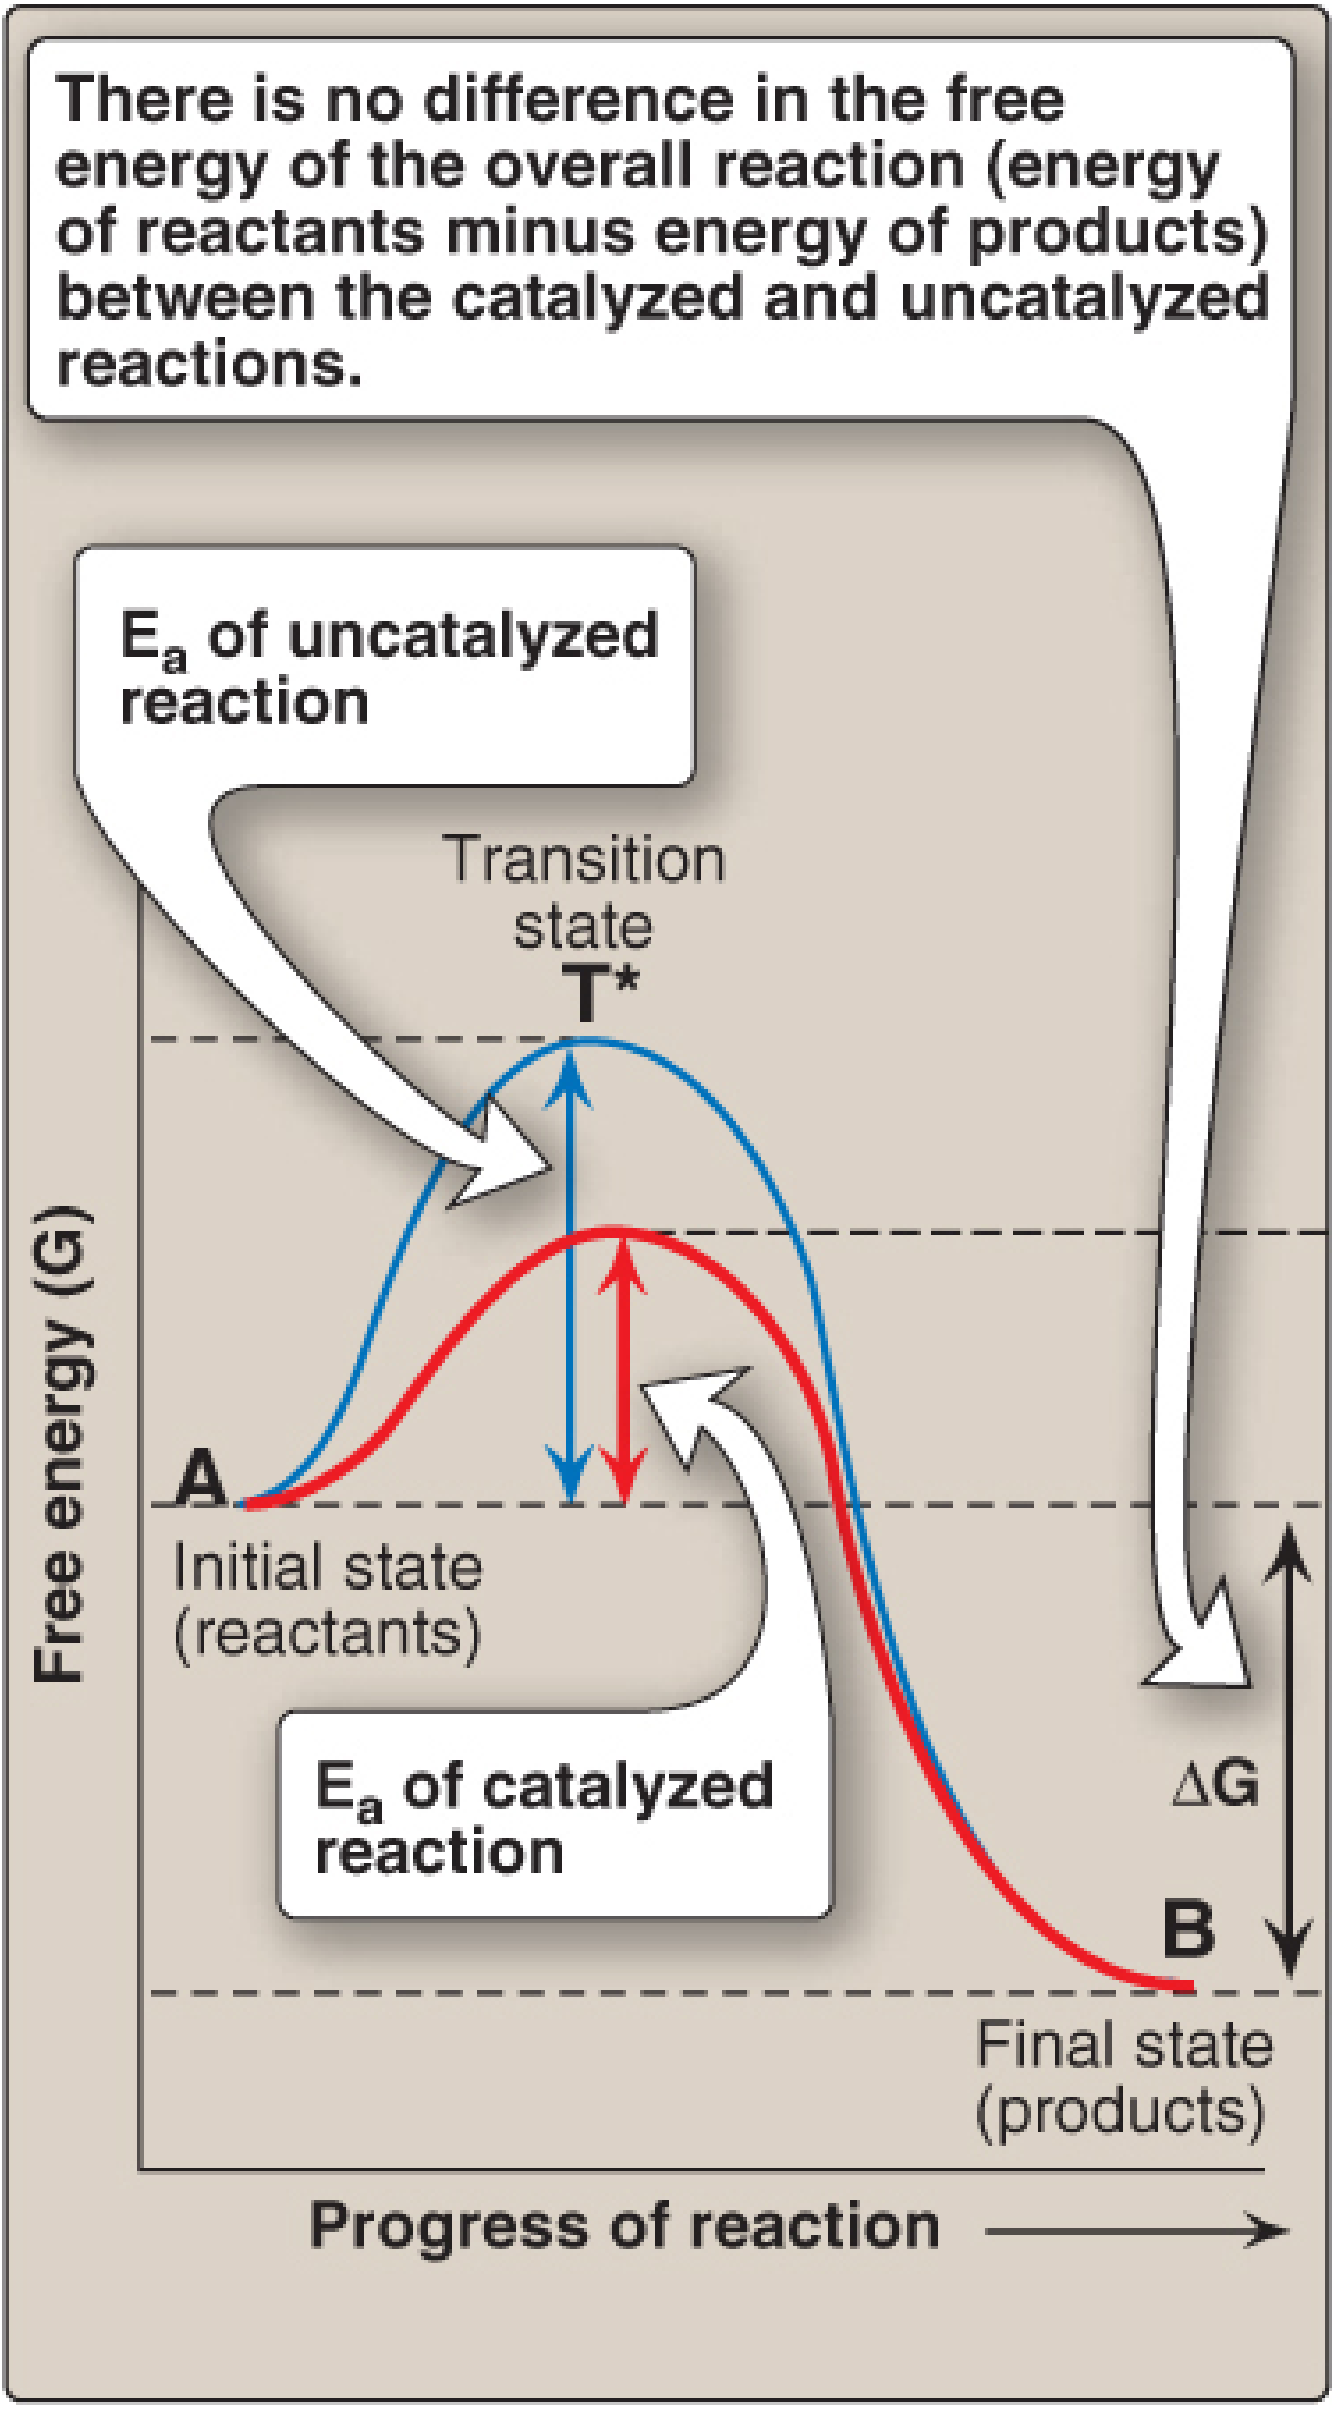
- The transition state (T)* is the high-energy intermediate at the peak of the energy barrier
- Enzymes stabilize the transition state, increasing the number of molecules that can pass over the energy barrier
- Enzymes do not change the equilibrium of the reaction; they only speed up the rate at which equilibrium is reached
- Enzymes accelerate both the forward and reverse reactions equally
C. Substrate Binding Models
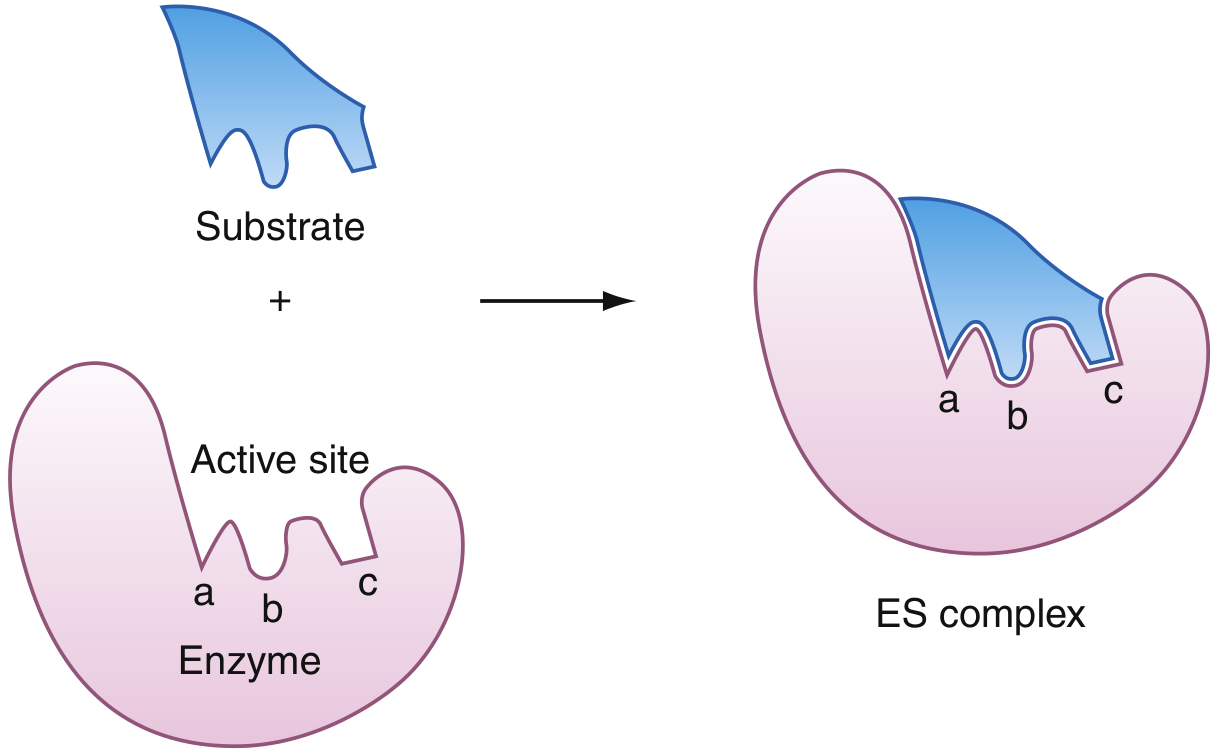
1. Lock-and-Key Model (Emil Fischer, 1894)
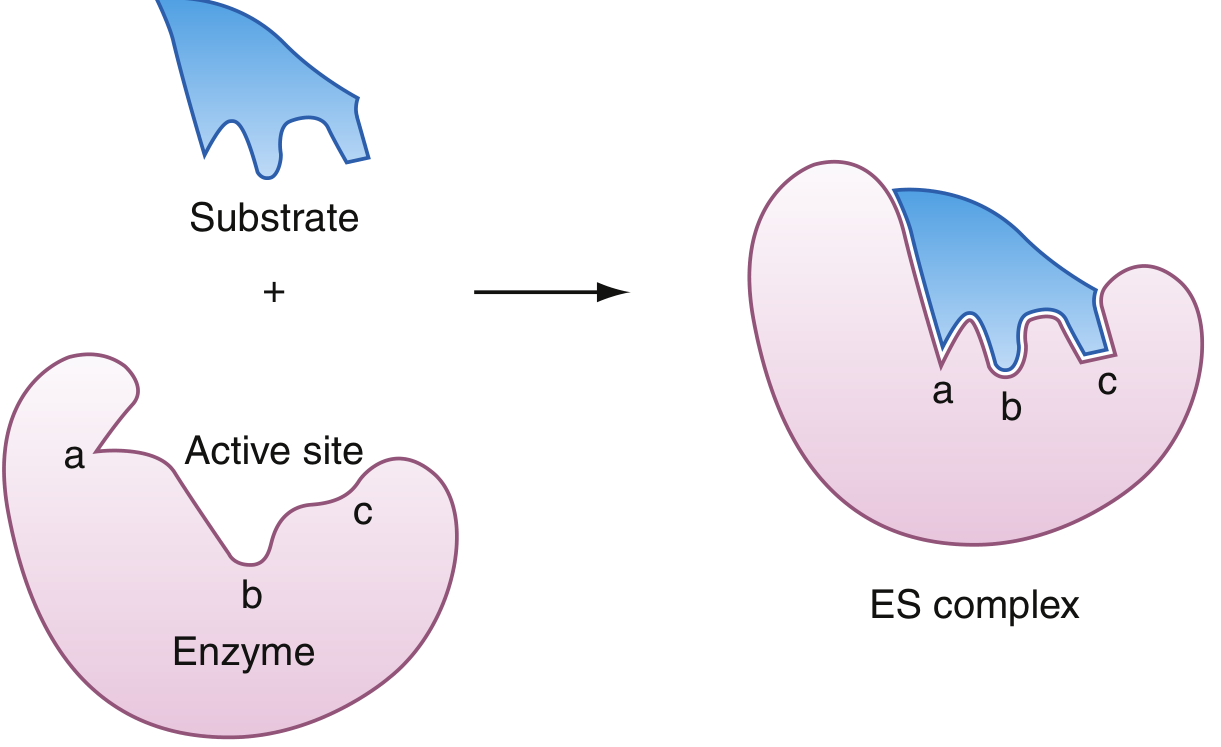
2. Induced-Fit Model (Daniel Koshland, 1958)
- Repositions functional groups in the active site optimally
- Increases binding affinity (more interactions form)
- Excludes water from the active site
- Properly aligns catalytic residues for bond-making/breaking
- Why substrates of slightly different structure may still bind (flexibility)
- Allosteric regulation (binding at one site changes the active site)
- Cooperativity in multimeric enzymes (binding one subunit induces conformational change in neighboring subunits)
D. Chemical Mechanisms of Catalysis at the Active Site
1. Acid-Base Catalysis (General Acid-Base Catalysis)
- Amino acid residues in the active site act as proton donors (general acids) or proton acceptors (general bases)
- Most commonly performed by Histidine (His) - because its pKa (~6.0) is close to physiological pH, allowing it to both donate and accept protons under cellular conditions
- Also performed by Asp, Glu, Lys, Tyr
2. Covalent Catalysis
- A nucleophilic group on the enzyme attacks the substrate, forming a transient covalent bond (covalent intermediate)
- The intermediate is subsequently resolved, releasing product and regenerating the free enzyme
- Amino acids involved: Serine (Ser), Cysteine (Cys), Lysine (Lys), Histidine (His), Aspartate (Asp)
- Chymotrypsin: Ser195 forms a covalent acyl-enzyme intermediate with the substrate
- Pyruvate decarboxylase: Thiamine pyrophosphate (cofactor) forms a covalent intermediate with pyruvate
3. Electrostatic Catalysis (Charge Stabilization)
- Charged amino acid side chains or metal ions in the active site stabilize charges that develop on the substrate during the transition state
- Lysine (Lys), Arginine (Arg) stabilize negative charges (e.g., phosphate groups)
- Aspartate (Asp), Glutamate (Glu) stabilize positive charges
- Metal ions (Zn²⁺, Mg²⁺, Fe²⁺) are particularly effective electrostatic catalysts
4. Transition State Stabilization
- The most important catalytic mechanism
- The active site has greater affinity for the transition state than for the substrate or product
- By binding the transition state tightly, the enzyme lowers its energy, reducing the energy barrier
- Transition state analogs (drugs that mimic the transition state) bind extremely tightly to enzymes (competitive inhibitors used as drugs - e.g., statins)
5. Proximity and Orientation Effects (Proximity Catalysis)
- The active site positions substrate molecules in the optimal geometry for reaction
- Reactants are brought into close proximity, greatly increasing the effective concentration
- This overcomes the entropy barrier (reduces randomness) - essentially making an intramolecular reaction out of an intermolecular one
- Estimated to accelerate reactions by factors of 10⁸ compared to the free solution reaction
6. Metal Ion Catalysis
- Metal cofactors (Mg²⁺, Zn²⁺, Fe²⁺/³⁺, Cu²⁺, Mn²⁺) contribute to catalysis by:
- Acting as Lewis acids (electron pair acceptors) - activating substrates
- Stabilizing transition states and reaction intermediates
- Facilitating oxidation-reduction reactions (Fe, Cu - can change valence states)
- Holding substrates in the correct orientation
- Carbonic anhydrase - Zn²⁺ activates water (carbonic anhydrase is ~10⁷ times faster than uncatalyzed reaction)
- Cytochrome oxidase - Fe²⁺/Fe³⁺ in heme group for electron transfer
- DNA polymerase - Mg²⁺ stabilizes the transition state during phosphodiester bond formation
E. Overall Sequence of Enzyme Catalysis
Step 1: E + S → ES (substrate binds at active site; induced fit occurs)
Step 2: ES → ES* (transition state is formed and stabilized)
Step 3: ES* → EP (bonds rearranged; product formed)
Step 4: EP → E + P (product is released; free enzyme regenerated)
F. Enzyme Specificity
| Type | Definition | Example |
|---|---|---|
| Absolute specificity | Acts on only one substrate | Urease (only urea) |
| Group specificity | Acts on a particular chemical group regardless of rest of molecule | Hexokinase (any hexose sugar) |
| Linkage specificity | Acts on a specific type of chemical bond | Lipase (ester bonds) |
| Stereospecificity | Acts on only one stereoisomer | L-amino acid oxidase acts only on L-amino acids |
SUMMARY
CLASSIFICATION OF ENZYMES (IUB/EC System)
├── Class 1: OXIDOREDUCTASES → Redox reactions (LDH, ALT, G6PD)
├── Class 2: TRANSFERASES → Group transfer (AST, hexokinase, CK)
├── Class 3: HYDROLASES → Hydrolysis (trypsin, ALP, amylase, lipase)
├── Class 4: LYASES → Non-hydrolytic bond cleavage (aldolase, carbonic anhydrase)
├── Class 5: ISOMERASES → Intramolecular rearrangement (phosphoglucose isomerase)
└── Class 6: LIGASES → Bond formation + ATP (DNA ligase, acetyl-CoA carboxylase)
MECHANISM OF ACTION
├── Active site: substrate binds, catalysis occurs
├── Energy: enzymes lower Ea; do not change ΔG or equilibrium
├── Substrate binding models:
│ ├── Lock-and-key (rigid complementarity)
│ └── Induced fit (flexible, conformational change on substrate binding) ← accepted model
└── Chemical mechanisms:
├── Acid-base catalysis (His, Asp, Lys)
├── Covalent catalysis (Ser, Cys - transient covalent intermediate)
├── Electrostatic catalysis (charged amino acids, metal ions)
├── Transition state stabilization (most important)
├── Proximity & orientation effects
└── Metal ion catalysis (Zn²⁺, Mg²⁺, Fe²⁺)
- Tietz Textbook of Laboratory Medicine, 7th Ed. - Chapter 25: Enzymes
- Lippincott's Illustrated Reviews: Biochemistry, 8th Ed. - Chapter 5: Enzymes
- Henry's Clinical Diagnosis and Management by Laboratory Methods - Chapter 21
- Basic Medical Biochemistry: A Clinical Approach, 6th Ed. - Chapter 8
What are isoenzymes What are the different ways in which isoenzymes are identified Discuss clinical importance of isoenzymes of ck and ldh
Isoenzymes: Definition, Identification Methods, and Clinical Importance of CK and LDH
PART I: WHAT ARE ISOENZYMES?
- All catalyze the same chemical reaction
- Have slightly different physical, chemical, and immunological properties
- Arise from genetically determined differences in amino acid sequence
- Lippincott's Illustrated Reviews: Biochemistry, 8th Ed.
Key Features of Isoenzymes
| Property | Explanation |
|---|---|
| Same reaction catalyzed | All isoenzymes of an enzyme perform the same biochemical function |
| Different structure | Different amino acid sequences, different subunit compositions |
| Different charge | Varying numbers of charged amino acids → different electrophoretic mobility |
| Tissue-specific distribution | Different isoenzymes predominate in different organs |
| Different kinetic properties | Km, Vmax, optimal pH, heat stability may differ |
| Different immunological properties | May react differently with antibodies |
| Clinical utility | The pattern of isoenzymes in blood identifies the site of tissue damage |
Origin of Isoenzymes
- Multiple gene loci: Different structural genes encode different subunits (e.g., H and M subunits of LDH encoded on chromosomes 11 and 12)
- Different combinations of subunits: Dimers or tetramers assembled from different subunit types (e.g., LDH has 5 isoenzymes from combinations of H and M subunits; CK has 3 from B and M subunits)
- Post-translational modifications: Same protein but different carbohydrate additions (e.g., bone, liver, and intestinal ALP isoenzymes have identical amino acid sequences but differ in glycosylation)
- Mitochondrial vs. cytoplasmic forms: Distinct isoenzymes encoded separately (e.g., mitochondrial and cytoplasmic CK, mitochondrial and cytoplasmic AST)
PART II: METHODS FOR IDENTIFICATION OF ISOENZYMES
1. ELECTROPHORESIS
- Support media: agarose gel or cellulose acetate at pH 8.6
- Sample (serum or tissue extract) is applied at the origin
- Electric current applied - isoenzymes migrate based on charge and size
- Visualization: substrate + NADPH-generating coupled reaction → fluorescence under UV light (360 nm)
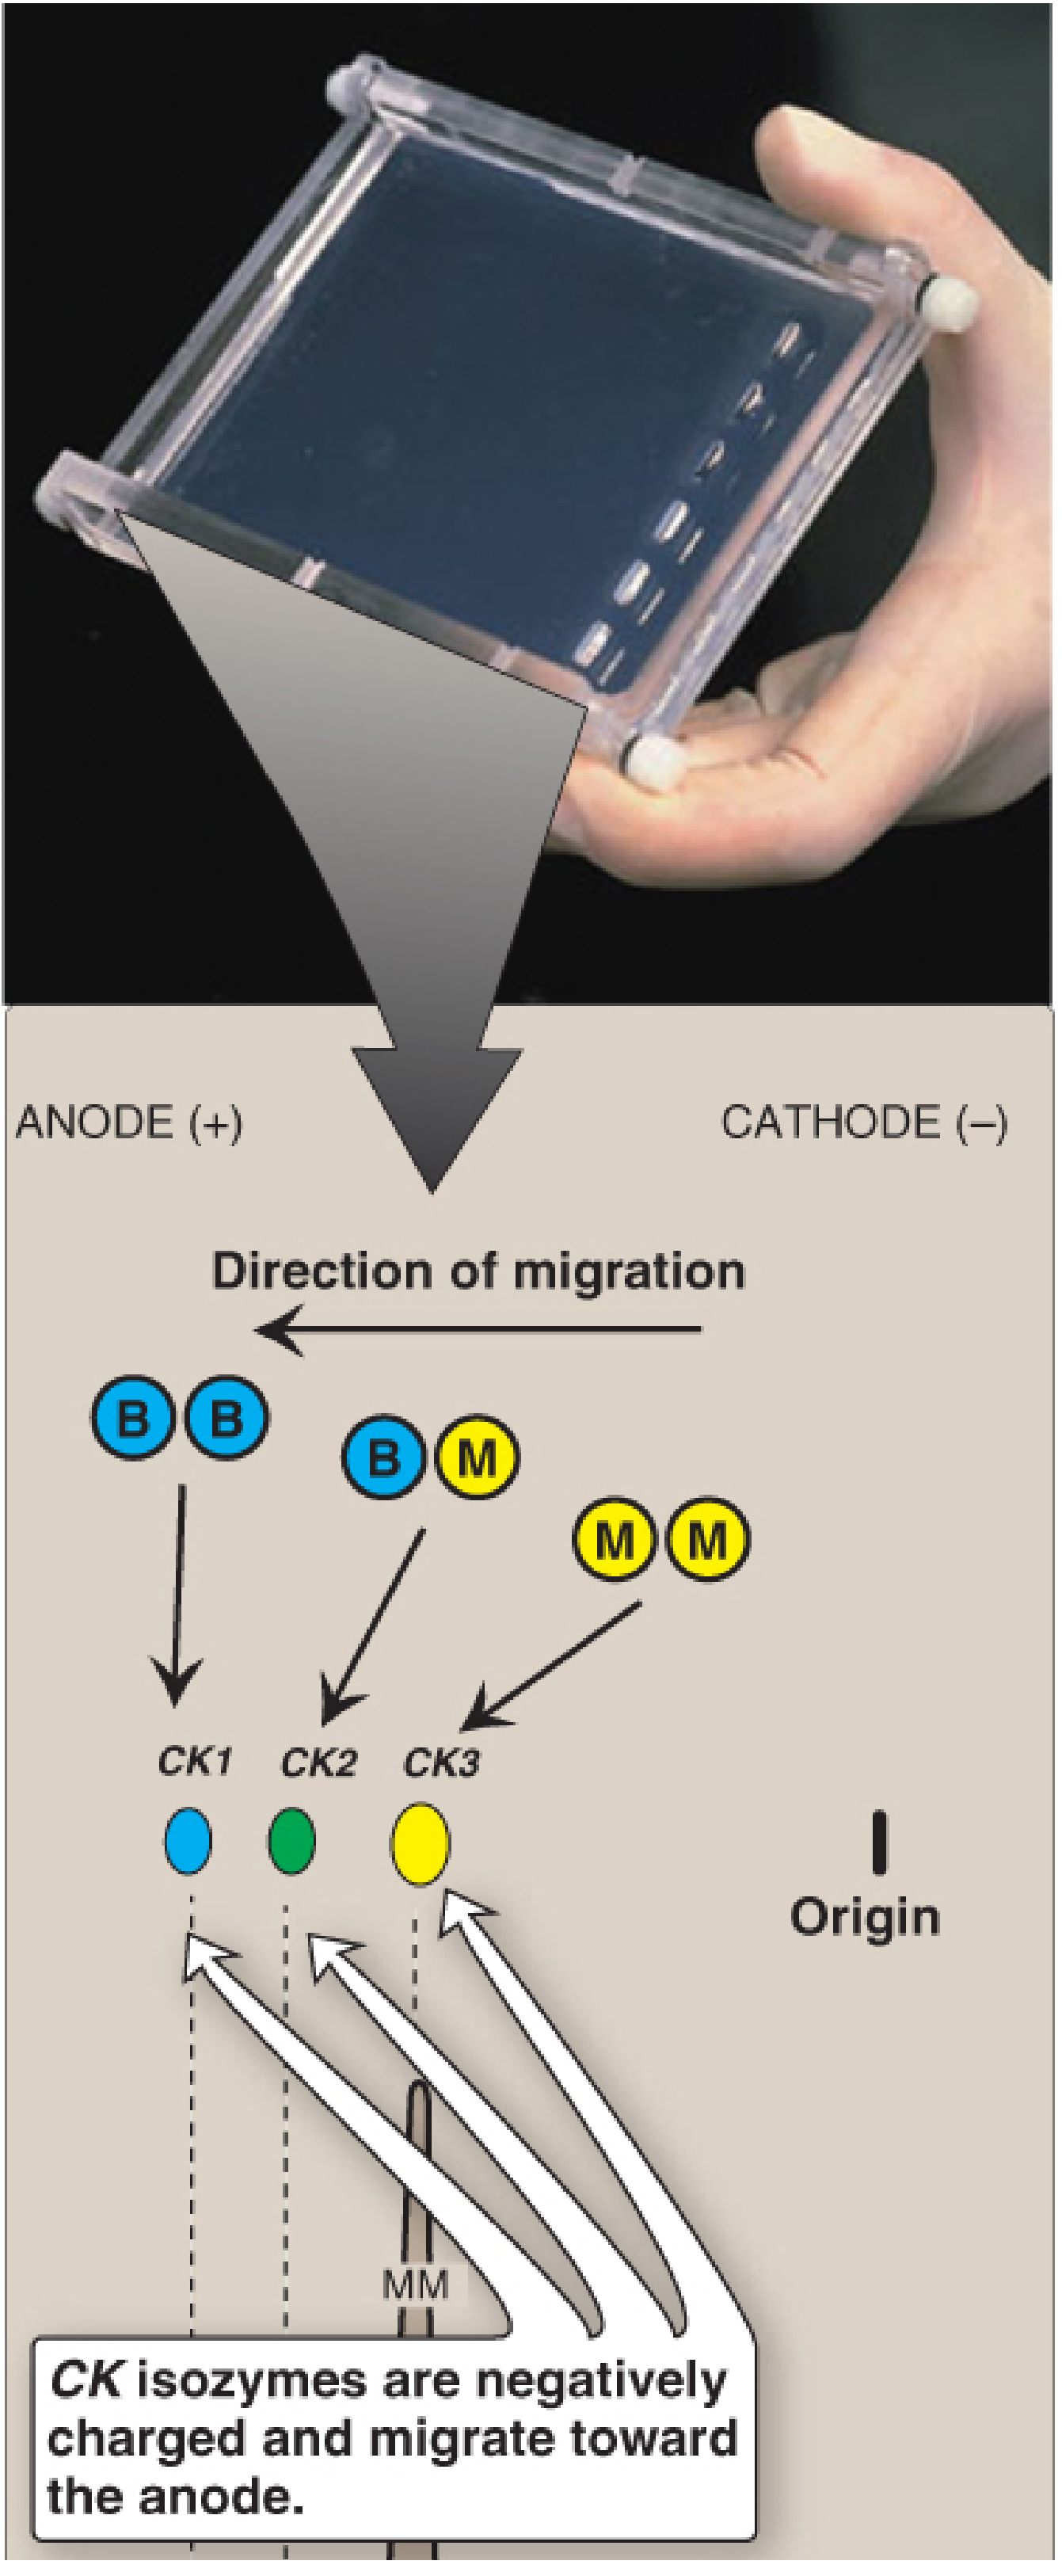
- CK-1 (BB) → fastest (most negative charge)
- CK-2 (MB) → intermediate
- CK-3 (MM) → slowest (remains near origin)
2. IMMUNOASSAY (Immunochemical Methods)
- Immunoinhibition: An antibody against one subunit (e.g., anti-M antibody) inhibits that subunit's activity, leaving only the other subunit's activity to be measured
- e.g., Anti-M antibody inhibits the M subunit of CK → only B subunit activity remains → this equals twice the CK-MB activity
- Sandwich immunoassay (mass assay): Two monoclonal antibodies (capture + detection) specifically recognize the MB dimer → measures CK-MB protein concentration (mass) in µg/L
- Currently the recommended approach for CK-MB
- More sensitive than activity assays (detection limit < 1 µg/L)
- Not affected by hemolysis, anticoagulants, or inhibitors
- Upper reference limit (URL): 5.0 µg/L for CK-MB
3. COLUMN CHROMATOGRAPHY (Ion-Exchange Chromatography)
4. HEAT STABILITY / HEAT INACTIVATION
- Heat-stable ALP - placental ALP (Regan isoenzyme) retains activity after heating to 56°C for 30 min
- Heat-labile ALP - bone ALP is inactivated at 56°C
- This forms the basis of the heat inactivation test to distinguish bone from liver ALP
- LDH-1 (cardiac) is heat-stable at 60°C; LDH-5 (liver/skeletal muscle) is heat-labile
5. CHEMICAL INHIBITION
- L-Phenylalanine: Inhibits intestinal and placental ALP but not liver/bone ALP
- Levamisole: Inhibits liver and bone ALP
- Urea inhibition: Used to differentiate bone from liver ALP isoenzymes
- These allow selective inhibition to identify which isoenzyme is elevated clinically
Additional Methods (Less Routine)
| Method | Basis |
|---|---|
| Isoelectric focusing | Separates isoenzymes based on their isoelectric point (pI) |
| Western blotting | After SDS-PAGE separation, immunological detection with specific antibodies |
| Kinetic methods | Different Km values for same substrate used to distinguish isoenzymes |
| Radioimmunoassay (RIA) | Historical method; radioactive antibodies used for detection |
PART III: CLINICAL IMPORTANCE OF CK ISOENZYMES
Structure of Creatine Kinase (CK)
- EC number: 2.7.3.2 (Transferase - phosphate group transfer)
- Structure: Dimer (82 kDa), composed of two subunits:
- B subunit (Brain type) - encoded on chromosome 14
- M subunit (Muscle type) - encoded on chromosome 19
- Three isoenzymes result from combination of these two subunits:
| Isoenzyme | Composition | Old Name | Electrophoretic Position | Primary Location |
|---|---|---|---|---|
| CK-1 (CK-BB) | BB | CK-1 | Most anodal (migrates furthest) | Brain, smooth muscle, lung, thyroid |
| CK-2 (CK-MB) | MB | CK-2 | Intermediate | Myocardium (cardiac muscle) - unique |
| CK-3 (CK-MM) | MM | CK-3 | Least mobile (near origin) | Skeletal muscle (dominant), cardiac muscle |
| CK-Mt (mitochondrial) | Mitochondrial dimer | - | Cathodal to origin | Inner mitochondrial membrane |
Tissue Distribution of CK Isoenzymes
| Tissue | CK-MM (%) | CK-MB (%) | CK-BB (%) |
|---|---|---|---|
| Skeletal muscle | ~96 | ~4 | ~0 |
| Myocardium (heart) | ~60-70 | ~25-40 | ~0 |
| Brain | ~0 | ~0 | ~90-95 |
| Smooth muscle | variable | ~2-3 | ~96 |
Normal Serum CK Activity
- CK-MM: ~96-100% of total serum CK (from physiological muscle turnover)
- CK-MB: ≤5% (very small amount may be normally present)
- CK-BB: none (does not normally cross the blood-brain barrier)
Clinical Uses of CK Isoenzymes
1. Acute Myocardial Infarction (AMI) - HISTORICAL SIGNIFICANCE
| Event | Timeline |
|---|---|
| CK-MB rises above URL | 4-8 hours after onset of chest pain |
| CK-MB peaks | ~24 hours after MI |
| CK-MB returns to baseline | 48-72 hours after MI |
- CK-MB >5% of total CK = highly specific for myocardial damage
- Useful for estimating infarct size (peak CK-MB correlates with area of myocardium damaged)
- Useful for detecting reinfarction: if CK-MB falls and then rises again within 72h = reinfarction
- Cardiac troponins I and T (cTnI, cTnT) are now the gold standard - they are more sensitive, more specific, and remain elevated longer (3-10 days)
- CK-MB lacks specificity since it is also present in skeletal muscle (albeit < 5%)
2. Skeletal Muscle Disease
- Muscular dystrophies (e.g., Duchenne): Very high total CK (10-100× URL); predominantly CK-MM; CK-MB may be elevated due to "fetal reversion" (diseased muscle re-expresses B subunit)
- Polymyositis/Dermatomyositis: Elevated CK-MM ± CK-MB (due to fetal reversion)
- Rhabdomyolysis: Massive CK-MM elevation (>50× URL); risk of renal failure
- Statin myopathy: CK elevation graded from asymptomatic (< 4× URL) to rhabdomyolysis (> 50× URL)
- Note: CK-MB/total CK may be elevated in skeletal muscle disease WITHOUT MI - troponin levels (normal) differentiate the two
3. CK-BB (CK-1) - Brain/CNS
- Not normally present in blood (blood-brain barrier prevents entry)
- Elevated CK-BB in serum/CSF indicates brain damage:
- Cerebral infarction (stroke)
- Head trauma - CSF CK-BB correlates with severity
- After cardiac arrest (global brain ischemia): CSF CK-BB peaks at ~48h
- CK-BB < 5 U/L = minimal neurological damage
- CK-BB 5-20 U/L = mild to moderate CNS injury
- CK-BB 21-50 U/L = often fatal
- CK-BB > 50 U/L = essentially 100% mortality
- Subarachnoid hemorrhage: CK-BB > 40 U/L = 100% chance of unfavorable outcome
4. Macro-CK and Other Abnormal Forms
- Macro-CK type 1: CK-BB bound to immunoglobulins (most common) → falsely elevated CK-MB on immunoinhibition assays; detected by electrophoresis
- Macro-CK type 2: Mitochondrial CK oligomers released from severely damaged tissue (liver, heart) → poor prognosis marker
- Hypothyroidism: Average 5× increase in CK (predominantly CK-MM); normalizes with thyroid hormone replacement
PART IV: CLINICAL IMPORTANCE OF LDH ISOENZYMES
Structure of Lactate Dehydrogenase (LDH)
- EC number: 1.1.1.27 (Oxidoreductase)
- Reaction: L-Lactate + NAD⁺ ⇌ Pyruvate + NADH (reversible)
- Structure: Tetramer (4 subunits), composed of two types:
- H subunit (Heart type) - encoded on chromosome 12
- M subunit (Muscle type) - encoded on chromosome 11
- Five isoenzymes formed by combination of H and M subunits in a tetramer:
| Isoenzyme | Composition | Electrophoretic Position | Tissue Distribution |
|---|---|---|---|
| LD-1 | H₄ (HHHH) | Most anodal (fastest) | Heart (myocardium), RBCs, kidney cortex |
| LD-2 | H₃M₁ | Second from anode | Heart, RBCs (LD2 > LD1 in normal serum) |
| LD-3 | H₂M₂ | Middle | Lung, lymphocytes, spleen, platelets, pancreas |
| LD-4 | H₁M₃ | Second from cathode | Liver, skeletal muscle |
| LD-5 | M₄ (MMMM) | Most cathodal (slowest) | Liver, skeletal muscle (dominant) |
Normal Serum LDH Pattern
Clinical Uses of LDH Isoenzymes
1. Acute Myocardial Infarction (AMI) - HISTORICAL
- After AMI, LD1 rises above LD2 → called the "LD1/LD2 flip" (LD1 > LD2)
- LDH rises 12-24 hours after AMI, peaks at 48-72 hours, and remains elevated for 7-10 days
- This prolonged elevation made LDH useful for late presentation MI (when CK-MB had already normalized)
- Significance of LD flip: LD1 > LD2 pattern is highly specific for myocardial or red cell damage
- Now largely replaced by troponins (remain elevated 3-10 days and are more specific)
2. Liver Disease
- Viral hepatitis, cirrhosis, liver metastases: LD5 predominantly elevated
- LD5/LD4 ratio elevated in hepatic damage
- LDH is not liver-specific (also elevated in muscle), so elevated LD5 must be interpreted alongside ALT/AST
3. Megaloblastic Anemia / Hemolytic Anemia
- Massive elevation of total LDH with predominance of LD1 and LD2
- Due to destruction of RBCs (which are rich in LD1 and LD2)
- Very high LDH in megaloblastic anemia (ineffective erythropoiesis) and intravascular hemolysis
- Used in diagnosis of hemolytic anemia; also elevated in paroxysmal nocturnal hemoglobinuria (PNH)
4. Malignancy
- Total LDH is a non-specific tumor marker - elevated in many cancers
- LDH isoenzyme pattern in malignancy:
- Leukemias/lymphomas: LD3 and LD4 elevated (lymphocyte-associated)
- Lung cancer: LD3 elevated
- Hepatic metastases: LD5 elevated
- Leptomeningeal metastases (breast, lung, melanoma): CSF LD5/total LD ratio elevated above 10-15%
- LDH is a prognostic marker in testicular cancer, lymphoma, and melanoma staging (elevated LDH = worse prognosis)
5. Pulmonary Infarction (Pulmonary Embolism)
- Classic triad (historical): Elevated LDH, elevated bilirubin, normal AST - "Wacker triad"
- LD3 and LD4 elevated (lung-associated)
- Now largely replaced by CT pulmonary angiography and D-dimer testing
6. Renal Infarction
- LD1 elevated (kidney cortex is rich in LD1)
7. Meningitis
- Bacterial meningitis: CSF LDH elevated (> 40 U/L); sensitivity ~86%, specificity ~93%
- Bacterial > viral meningitis; can help differentiate
- Elevated CSF LD5 in CNS malignancy
CK-MB and Cardiac Troponin Timeline after AMI
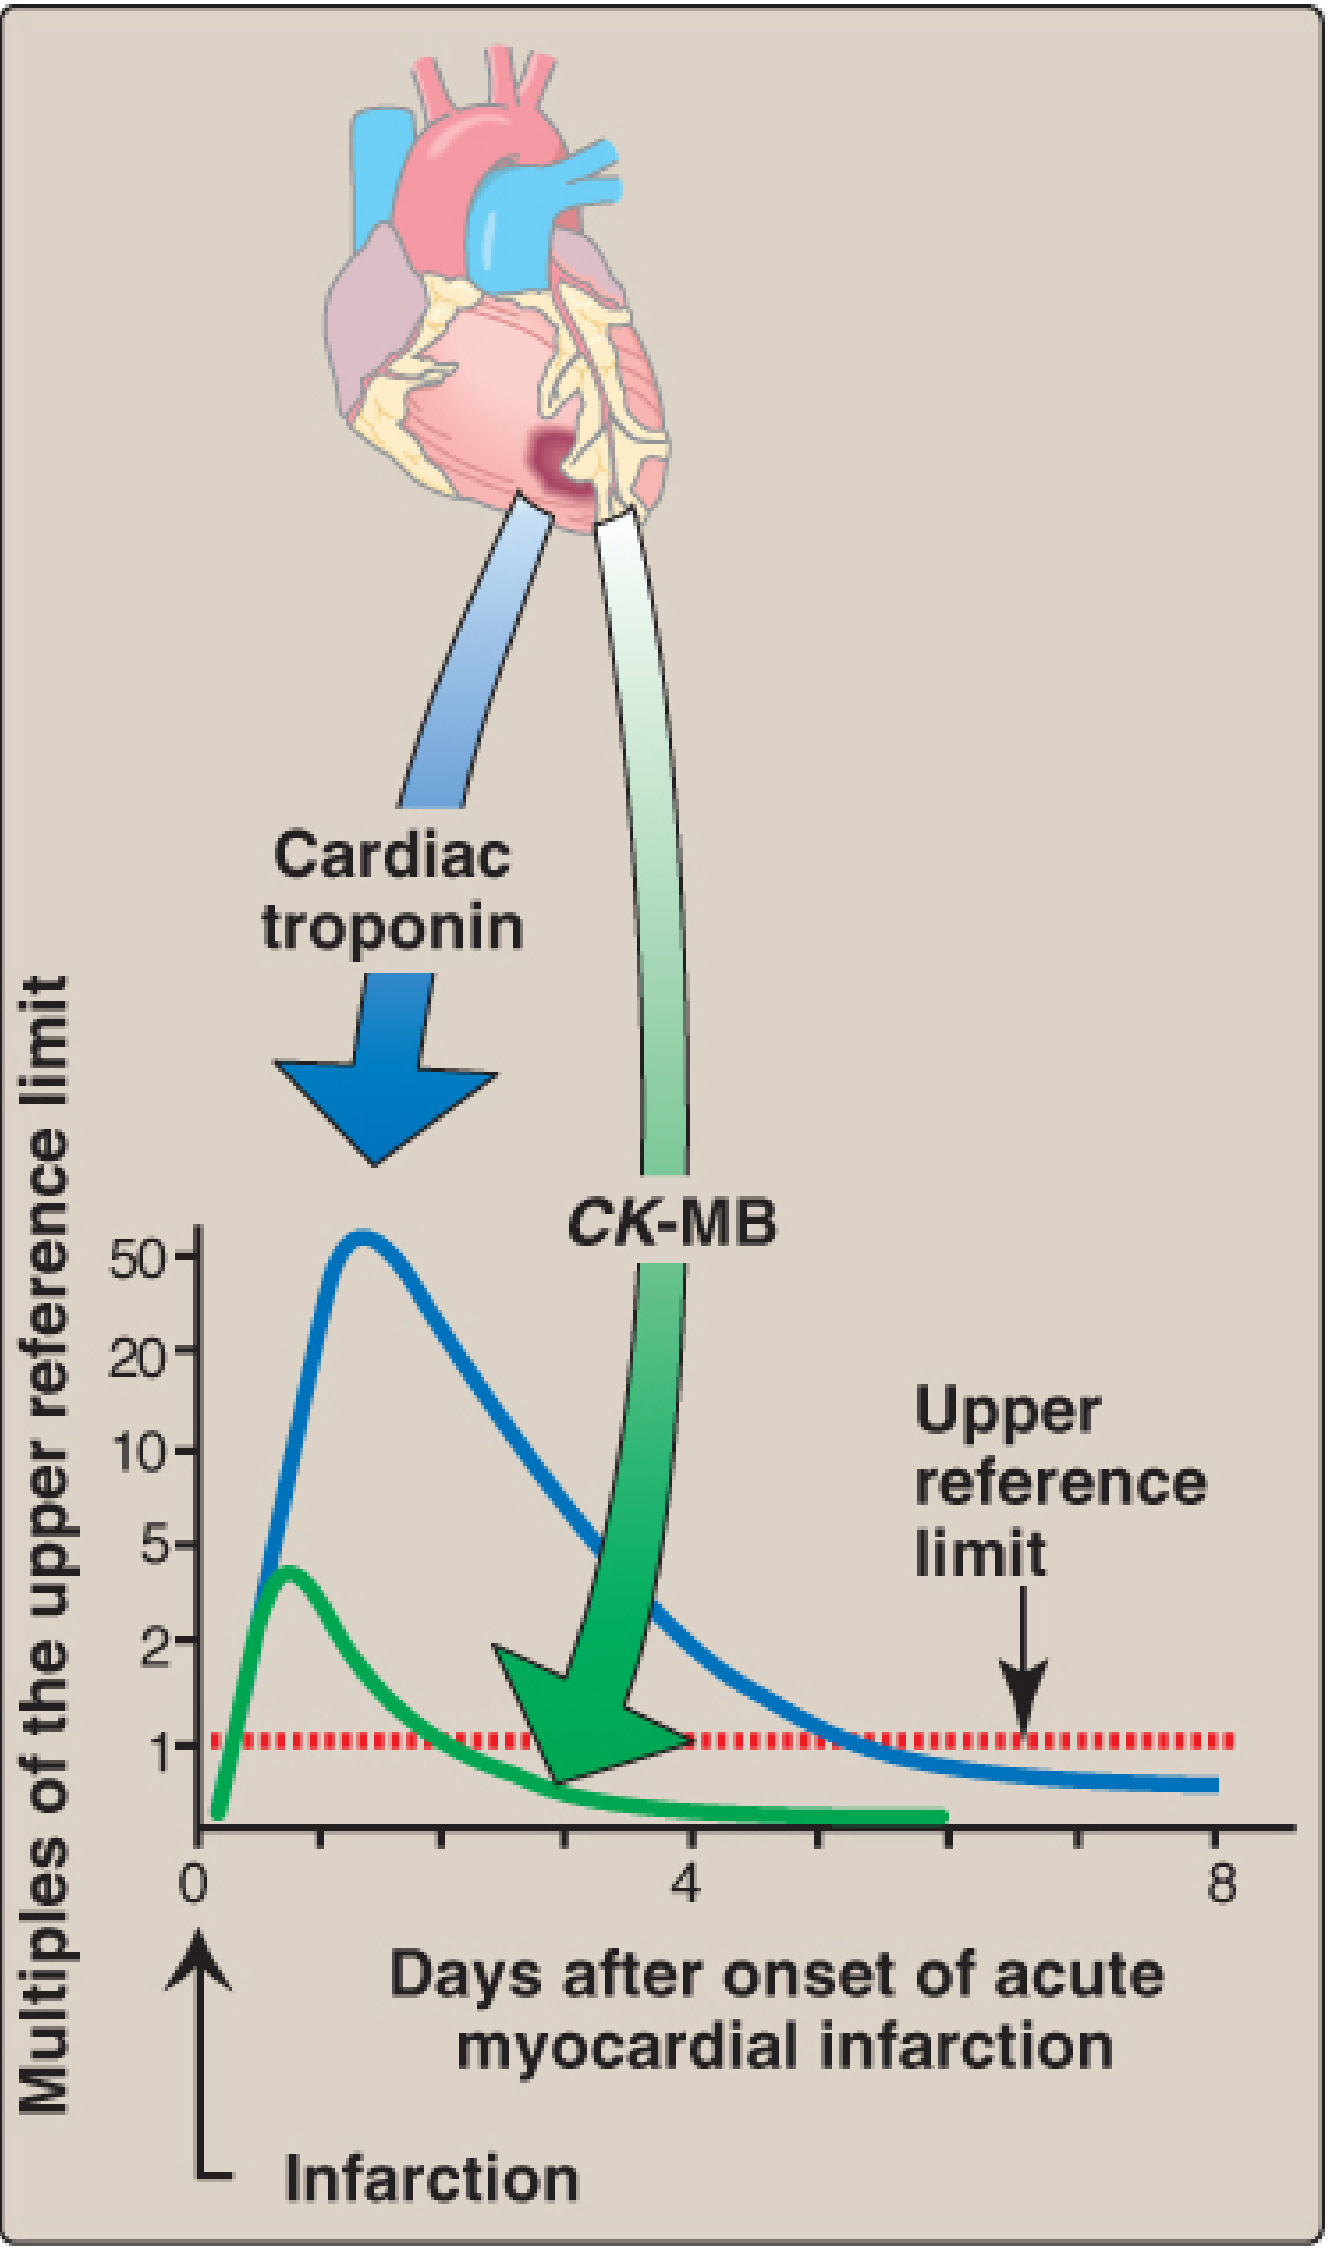
SUMMARY TABLE: CK vs LDH Isoenzymes
| Feature | CK Isoenzymes | LDH Isoenzymes |
|---|---|---|
| Structure | Dimer (2 subunits: B, M) | Tetramer (4 subunits: H, M) |
| Number of isoenzymes | 3 (CK-BB, CK-MB, CK-MM) + mitochondrial | 5 (LD1-LD5) |
| Cardiac isoenzyme | CK-MB (>5% = cardiac specific) | LD1 (H₄) |
| Cardiac rise after MI | 4-8 hours | 12-24 hours |
| Cardiac peak after MI | ~24 hours | 48-72 hours |
| Returns to baseline | 48-72 hours | 7-10 days |
| Liver isoenzyme | None (liver has no CK) | LD5 (M₄) |
| Skeletal muscle | CK-MM dominant | LD5 dominant |
| Brain isoenzyme | CK-BB | LD1, LD2 |
| Current status for MI | Replaced by troponins | Replaced by troponins |
| Still clinically useful for | Muscle disease, brain injury, reinfarction (CK-MB) | Late MI diagnosis, hemolysis, liver disease, malignancy staging |
SUMMARY
- Isoenzymes are multiple molecular forms of the same enzyme, differing in physical and chemical properties but catalyzing the same reaction
- They are identified by electrophoresis (separates all forms), immunoassay (most sensitive, recommended for CK-MB), heat stability, chemical inhibition, and chromatography
- CK-MB is specific for myocardial damage when > 5% of total CK; rises at 4-8h, peaks at 24h, normalizes at 48-72h post-MI
- LDH "flip" (LD1 > LD2) indicates myocardial/RBC damage; persists for up to 10 days
- Both have been superseded by cardiac troponins as the gold standard for MI diagnosis
- LDH isoenzymes remain clinically useful in hemolytic anemia, liver disease, malignancy, and meningitis
Glycolysis Salient features Inhibitors of glycolysis Fate of pyruvate Energetics Regulation of glycolysis
glycolysis pathway diagram all 10 steps enzymes substrates ATP NADH
GLYCOLYSIS
MBBS Biochemistry - Complete Answer
PART I: DEFINITION AND SALIENT FEATURES
Definition
Glucose + 2 ADP + 2 Pi + 2 NAD⁺ → 2 Pyruvate + 2 ATP + 2 NADH + 2 H₂O
Glucose + 2 ADP + 2 Pi → 2 Lactate + 2 ATP + 2 H₂O
SALIENT FEATURES OF GLYCOLYSIS
-
Location: Entirely cytoplasmic (cytosol) - all 10 enzymes are soluble in the cytoplasm. Does NOT require mitochondria.
-
Universal pathway: Present in ALL mammalian cells - obligatory in cells lacking mitochondria (RBCs, lens of eye, renal medulla, WBCs, platelets).
-
Anaerobic capacity: Can proceed without oxygen - the only source of ATP for anaerobically functioning tissues (RBCs, exercising muscle, retina, cornea).
-
Substrate: Primarily glucose, but also fructose and galactose (after conversion to glycolytic intermediates). Can also process glucose derived from glycogen (enters as glucose-6-phosphate after glycogenolysis, saving 1 ATP).
-
Two phases:
- Preparatory/Investment phase (reactions 1-5): Consumes 2 ATP; glucose is phosphorylated twice and split into two triose phosphates.
- Payoff/Energy-generating phase (reactions 6-10): Generates 4 ATP + 2 NADH per glucose (× 2 because of split); produces pyruvate.
-
Three irreversible steps (committed/regulatory steps):
- Step 1: Hexokinase/Glucokinase (Glucose → Glucose-6-P)
- Step 3: Phosphofructokinase-1 (Fructose-6-P → Fructose-1,6-bisP) ← rate-limiting step
- Step 10: Pyruvate kinase (Phosphoenolpyruvate → Pyruvate)
-
Net ATP production: 2 ATP per glucose (4 produced - 2 consumed in investment phase)
-
Energy yield by substrate-level phosphorylation (not oxidative phosphorylation) in the glycolytic pathway itself.
-
Produces 2 NADH (from glyceraldehyde-3-phosphate dehydrogenase, step 6); these must be either:
- Reoxidized in the mitochondria (aerobic: yields 5 ATP via malate-aspartate shuttle, or 3 ATP via glycerophosphate shuttle)
- Or used to reduce pyruvate to lactate (anaerobic - regenerates NAD⁺)
-
Key feature - NAD⁺ recycling: Glycolysis requires a continuous supply of NAD⁺. Under aerobic conditions, NADH is reoxidized in the ETC. Under anaerobic conditions, NAD⁺ is regenerated by the lactate dehydrogenase reaction. Without this, glycolysis would halt.
PART II: THE TEN STEPS OF GLYCOLYSIS
PHASE I: PREPARATORY PHASE (ATP-consuming)
| Step | Substrate → Product | Enzyme | Coenzyme | Notes |
|---|---|---|---|---|
| 1 | Glucose → Glucose-6-phosphate (G6P) | Hexokinase (tissues) / Glucokinase (liver, β-cells) | ATP (→ADP) | Irreversible; HK inhibited by G6P; GK not inhibited |
| 2 | G6P → Fructose-6-phosphate (F6P) | Phosphoglucose isomerase | - | Aldose-ketose isomerization; reversible |
| 3 | F6P → Fructose-1,6-bisphosphate (F1,6P) | Phosphofructokinase-1 (PFK-1) | ATP (→ADP) | Irreversible; RATE-LIMITING step; key regulation point |
| 4 | F1,6P → DHAP + Glyceraldehyde-3-P | Aldolase | - | Cleaves 6C → two 3C compounds; reversible |
| 5 | DHAP ⇌ Glyceraldehyde-3-P | Triose phosphate isomerase | - | Only GAP proceeds further; DHAP is converted |
End of investment phase: 2 ATP consumed; 1 glucose → 2 × Glyceraldehyde-3-phosphate (G3P)
PHASE II: PAYOFF PHASE (ATP-generating) — ×2 because of split
| Step | Substrate → Product | Enzyme | Coenzyme | Notes |
|---|---|---|---|---|
| 6 | G3P → 1,3-bisphosphoglycerate (1,3-BPG) | G3P Dehydrogenase | NAD⁺ → NADH | Oxidation; produces high-energy acyl-phosphate bond; inhibited by iodoacetate |
| 7 | 1,3-BPG → 3-phosphoglycerate (3-PG) | Phosphoglycerate kinase | ADP → ATP | 1st substrate-level phosphorylation; produces 2 ATP total |
| 8 | 3-PG → 2-phosphoglycerate (2-PG) | Phosphoglycerate mutase | - | Mg²⁺ required; reversible |
| 9 | 2-PG → Phosphoenolpyruvate (PEP) | Enolase | - | Dehydration; Mg²⁺/Mn²⁺ required; inhibited by fluoride |
| 10 | PEP → Pyruvate | Pyruvate kinase | ADP → ATP | 2nd substrate-level phosphorylation; irreversible; 2 ATP total |
Net from payoff phase: 4 ATP + 2 NADH per glucose
PART III: INHIBITORS OF GLYCOLYSIS
| Inhibitor | Enzyme Inhibited | Step | Mechanism | Clinical/Lab Significance |
|---|---|---|---|---|
| Glucose-6-phosphate (G6P) | Hexokinase | Step 1 | Product inhibition (feedback) | Natural physiological regulator |
| ATP | PFK-1 | Step 3 | Allosteric inhibition | Stops glycolysis when energy is adequate |
| Citrate | PFK-1 | Step 3 | Allosteric inhibition | Signals active TCA cycle → reduce glycolysis |
| Glucagon / cAMP | Pyruvate kinase | Step 10 | Phosphorylation (inactivation) | Hormonal regulation; fasting state |
| ATP, Alanine | Pyruvate kinase | Step 10 | Allosteric inhibition | Energy/substrate sensing |
| Iodoacetate | G3P Dehydrogenase | Step 6 | Alkylates –SH group at active site (Cys) | Lab inhibitor; blocks glycolysis |
| Arsenate (AsO₄³⁻) | G3P Dehydrogenase | Step 6 | Competes with Pi; forms unstable 1-arseno-3-PG → no ATP produced | Uncouples oxidation from ATP synthesis |
| Sodium fluoride (NaF) | Enolase | Step 9 | Forms fluorophosphate complex with Mg²⁺; sequesters Mg²⁺ from enolase | Used in blood glucose tubes to prevent glycolysis ex vivo |
| 2-Deoxyglucose (2-DG) | Hexokinase (forms 2-DG-6-P which cannot proceed) | Step 1/3 | Acts as glucose analog; 2-DG-6-P inhibits both hexokinase and PFK-1 | Used as anti-cancer agent (tumors rely on glycolysis) |
| Mercuric ions (Hg²⁺), Lead (Pb²⁺) | G3P Dehydrogenase | Step 6 | React with –SH groups (same as iodoacetate) | Heavy metal poisoning |
| Arsenite, Mercury | Pyruvate dehydrogenase | (Post-glycolysis) | React with –SH of lipoic acid | Inhibits pyruvate oxidation → lactic acidosis |
Key Points on Inhibitors
- Fluoride → used in grey-top blood glucose tubes (NaF) to prevent in vitro glycolysis by RBCs after blood collection
- Iodoacetate → classic experimental glycolysis inhibitor; blocks –SH group of G3P dehydrogenase
- Arsenate → a cunning inhibitor: allows glycolysis to proceed but uncouples ATP production (substrate-level phosphorylation) at step 6-7, resulting in no net ATP
- Tumor cells (Warburg effect) are particularly vulnerable to glycolysis inhibitors like 2-DG
PART IV: FATE OF PYRUVATE
PYRUVATE
│
┌─────────────────┼──────────────────┐────────────────┐
▼ ▼ ▼ ▼
(Anaerobic) (Aerobic) (Gluconeogenesis) (Amino acids)
Lactate Acetyl-CoA Oxaloacetate Alanine
│ (→ TCA cycle) (→ Glucose) (Transamination)
LDH rxn PDH complex
1. Conversion to LACTATE (Anaerobic / Cytoplasm)
- Anaerobic conditions (absence of O₂) - e.g., vigorous exercise, ischemia
- Tissues lacking mitochondria: RBCs (always), renal medulla, retina
- Very high rates of glycolysis (even with O₂) - "aerobic glycolysis / Warburg effect" in tumors
- Regenerates NAD⁺ - allows glycolysis to continue
- Lactate is exported to liver and reconverted to glucose via Cori cycle (gluconeogenesis)
- Excess lactate accumulation → Lactic acidosis (pH < 7.35 with elevated blood lactate > 5 mmol/L)
2. Conversion to ACETYL-CoA (Aerobic / Mitochondria)
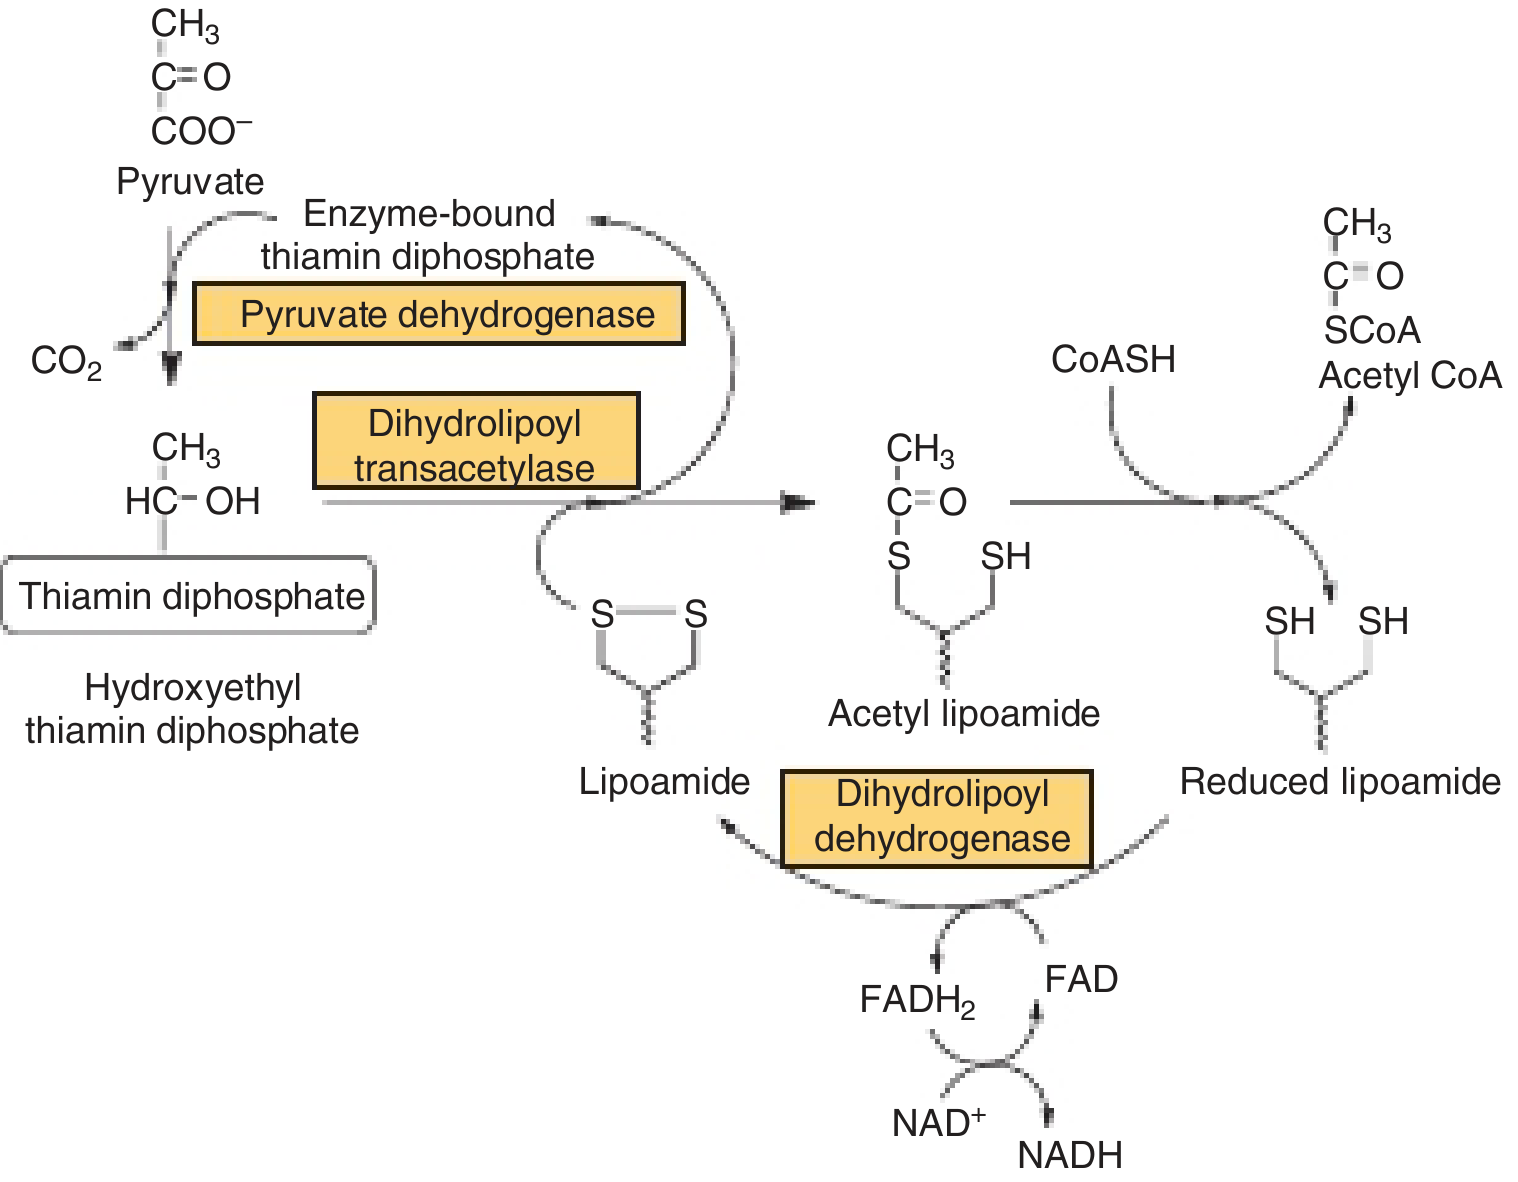
- Thiamine pyrophosphate (TPP) - Vitamin B₁ - decarboxylates pyruvate
- Lipoic acid - accepts acetyl group
- Coenzyme A (CoA) - accepts acetyl group to form acetyl-CoA
- FAD - reoxidizes dihydrolipoamide
- NAD⁺ - final electron acceptor → NADH
- Arsenite, mercuric ions (react with lipoic acid –SH groups)
- Thiamine deficiency (Vitamin B₁ deficiency) → pyruvate/lactate accumulate → Wernicke's encephalopathy, beriberi
- NADH, Acetyl-CoA (product inhibition)
- TCA (Krebs) cycle → complete oxidation to CO₂ + H₂O + ATP
- Fatty acid synthesis (in cytoplasm after transport)
3. Conversion to OXALOACETATE / GLUCOSE (Gluconeogenesis / Mitochondria)
- Requires biotin (Vitamin B₇) as coenzyme and Acetyl-CoA as allosteric activator
- OAA → PEPCK → PEP → ultimately → Glucose (gluconeogenesis)
- Important in fasting state and in liver/kidney
4. Conversion to ALANINE (Transamination)
- Alanine exported from muscle → liver → reconverted to pyruvate → gluconeogenesis
- Alanine-glucose (Cahill) cycle - analogous to Cori cycle but for amino acid transport
5. Conversion to ETHANOL (in yeast only)
PART V: ENERGETICS OF GLYCOLYSIS
A. ATP Balance of Glycolysis (Glucose to Pyruvate)
| Reaction | ATP Change |
|---|---|
| Step 1: Hexokinase | -1 ATP |
| Step 3: Phosphofructokinase-1 | -1 ATP |
| Step 7: Phosphoglycerate kinase (×2) | +2 ATP |
| Step 10: Pyruvate kinase (×2) | +2 ATP |
| NET ATP (substrate-level phosphorylation) | +2 ATP |
B. Complete Energy Yield Under Aerobic Conditions
| Source | ATP Yield |
|---|---|
| Glycolysis itself (substrate-level): 2 ATP | 2 |
| 2 NADH from G3P dehydrogenase (via malate-aspartate shuttle, 2.5 ATP each) | 5 |
| Pyruvate dehydrogenase: 2 NADH × 2.5 | 5 |
| TCA cycle per glucose: 6 NADH × 2.5 + 2 FADH₂ × 1.5 + 2 GTP | 20 |
| TOTAL (modern P/O ratios) | ~30-32 ATP |
C. Anaerobic Glycolysis Energetics
| Net ATP | |
|---|---|
| Glucose → 2 Lactate | 2 ATP only |
D. Energy from Glycogen (vs. Free Glucose)
- When glucose from glycogen enters glycolysis (as G6P), step 1 is bypassed → saves 1 ATP
- Net ATP from glycogen: 3 ATP (anaerobic); 33 ATP (aerobic)
PART VI: REGULATION OF GLYCOLYSIS
A. Allosteric Regulation (Instantaneous)
1. Hexokinase (Step 1)
| Allosteric Inhibitor | Allosteric Activator |
|---|---|
| Glucose-6-phosphate (product inhibition) | - |
- When G6P accumulates (downstream pathway saturated), hexokinase is turned off
- Glucokinase (liver/β-cells) is NOT inhibited by G6P → acts as a glucose sensor; allows liver to continue trapping glucose even when G6P is high
2. Phosphofructokinase-1 (PFK-1) - Step 3 (RATE-LIMITING)
| Allosteric Inhibitors | Allosteric Activators |
|---|---|
| ATP (high energy; ~90% inhibition at normal intracellular [ATP]) | AMP/ADP (low energy signal; relieves ATP inhibition) |
| Citrate (active TCA cycle → no need for more acetyl-CoA) | Fructose-2,6-bisphosphate (most potent activator) |
| H⁺ (low pH) | Fructose-6-phosphate (substrate activation) |
- 2 ADP ⇌ ATP + 5'-AMP (adenylate kinase reaction)
- When ATP falls even slightly, AMP rises disproportionately → relieves PFK-1 inhibition → glycolysis accelerated
- Made by the bifunctional enzyme PFK-2/FBPase-2 from fructose-6-phosphate
- Activates PFK-1 (stimulates glycolysis); Inhibits fructose-1,6-bisphosphatase (inhibits gluconeogenesis)
- Regulation by hormones:
- Insulin (fed state): Activates PFK-2 → ↑ F2,6P → ↑ glycolysis
- Glucagon/fasting: Activates PKA → phosphorylates PFK-2 → inhibits PFK-2, activates FBPase-2 → ↓ F2,6P → ↓ glycolysis, ↑ gluconeogenesis
3. Pyruvate Kinase (Step 10)
| Allosteric Inhibitors | Allosteric Activators |
|---|---|
| ATP | Fructose-1,6-bisphosphate (feedforward activation from step 3) |
| Alanine (indicates amino acid abundance) | Insulin |
| Glucagon (via phosphorylation/inactivation) |
B. Covalent Modification (Minutes)
- Pyruvate kinase is phosphorylated and INACTIVATED by PKA (cAMP-dependent protein kinase) in response to glucagon (fasting) or epinephrine (stress)
- PFK-2 is phosphorylated by PKA → inactivated → ↓ F2,6P → ↓ PFK-1 activity → ↓ glycolysis
- Insulin activates phosphatases that dephosphorylate and activate pyruvate kinase and PFK-2
C. Induction/Repression of Enzyme Synthesis (Hours to Days)
| Condition | Effect on Glycolytic Enzymes |
|---|---|
| Fed state / Insulin | ↑ Expression of Hexokinase, Glucokinase, PFK-1, Pyruvate kinase, Pyruvate dehydrogenase |
| Fasting / Glucagon / Diabetes | ↓ Expression of above glycolytic enzymes; ↑ Expression of gluconeogenic enzymes |
D. Summary Regulation Diagram
GLUCOSE
│
▼ Hexokinase ←[Inhibited by G6P]
Glucose-6-P
│
▼ PFK-1 ←[KEY RATE-LIMITING STEP]
INHIBITED by: ATP, Citrate, H⁺, Glucagon
ACTIVATED by: AMP, Fructose-2,6-bisP (most potent), Fructose-6-P
Fructose-1,6-bisP
│ ↓ [Feedforward activation of pyruvate kinase]
│
▼×2 (two triose phosphates)
│
▼ NADH generated (G3P dehydrogenase)
│
▼ 2 ATP generated (Phosphoglycerate kinase)
│
▼ Enolase ←[Inhibited by Fluoride]
│
▼ Pyruvate kinase ←[INHIBITED by ATP, Alanine, Glucagon/PKA phosphorylation]
[ACTIVATED by F1,6bisP, Insulin]
PYRUVATE
SUMMARY TABLE: Glycolysis at a Glance
| Feature | Detail |
|---|---|
| Location | Cytoplasm (all cells) |
| Substrate | Glucose (6C) |
| Product | 2 Pyruvate (3C) |
| Net ATP | 2 ATP (anaerobic); ~30-32 ATP (aerobic via TCA) |
| NADH produced | 2 NADH (from step 6) |
| Key irreversible steps | Hexokinase (1), PFK-1 (3), Pyruvate kinase (10) |
| Rate-limiting enzyme | PFK-1 |
| Most potent activator | Fructose-2,6-bisphosphate |
| Anaerobic tissues | RBCs, renal medulla, retina, cornea |
| Fate of pyruvate (aerobic) | → Acetyl-CoA (PDH) → TCA cycle |
| Fate of pyruvate (anaerobic) | → Lactate (LDH) |
| Key inhibitor for labs | NaF (inhibits enolase; used in glucose tubes) |
Describe Krebs cycle Location Reaction and products Inhibitors Energetics Regulation
THE KREBS CYCLE (Citric Acid Cycle / TCA Cycle)
MBBS Biochemistry - Complete Answer
INTRODUCTION & NAMES
- Tricarboxylic Acid (TCA) cycle - because three-carboxylate compounds (citrate, isocitrate) are key intermediates
- Citric acid cycle - citrate was the first compound identified in the cycle
PART I: LOCATION
- The soluble enzymes are in the mitochondrial matrix (free or loosely attached)
- Succinate dehydrogenase (step 6) is embedded in the inner mitochondrial membrane (also a component of Complex II of the ETC)
- The enzymes and coenzymes of the respiratory chain (which reoxidize the NADH and FADH₂ produced) are also in the inner mitochondrial membrane
- O₂ is required to reoxidize NADH and FADH₂ produced by the cycle
- The ETC and ATP synthase are embedded in the inner mitochondrial membrane
- The cycle is therefore strictly aerobic
PART II: REACTIONS OF THE KREBS CYCLE - STEP BY STEP
Entry Reaction: Pyruvate → Acetyl-CoA (Pyruvate Dehydrogenase Complex)
THE KREBS CYCLE DIAGRAM
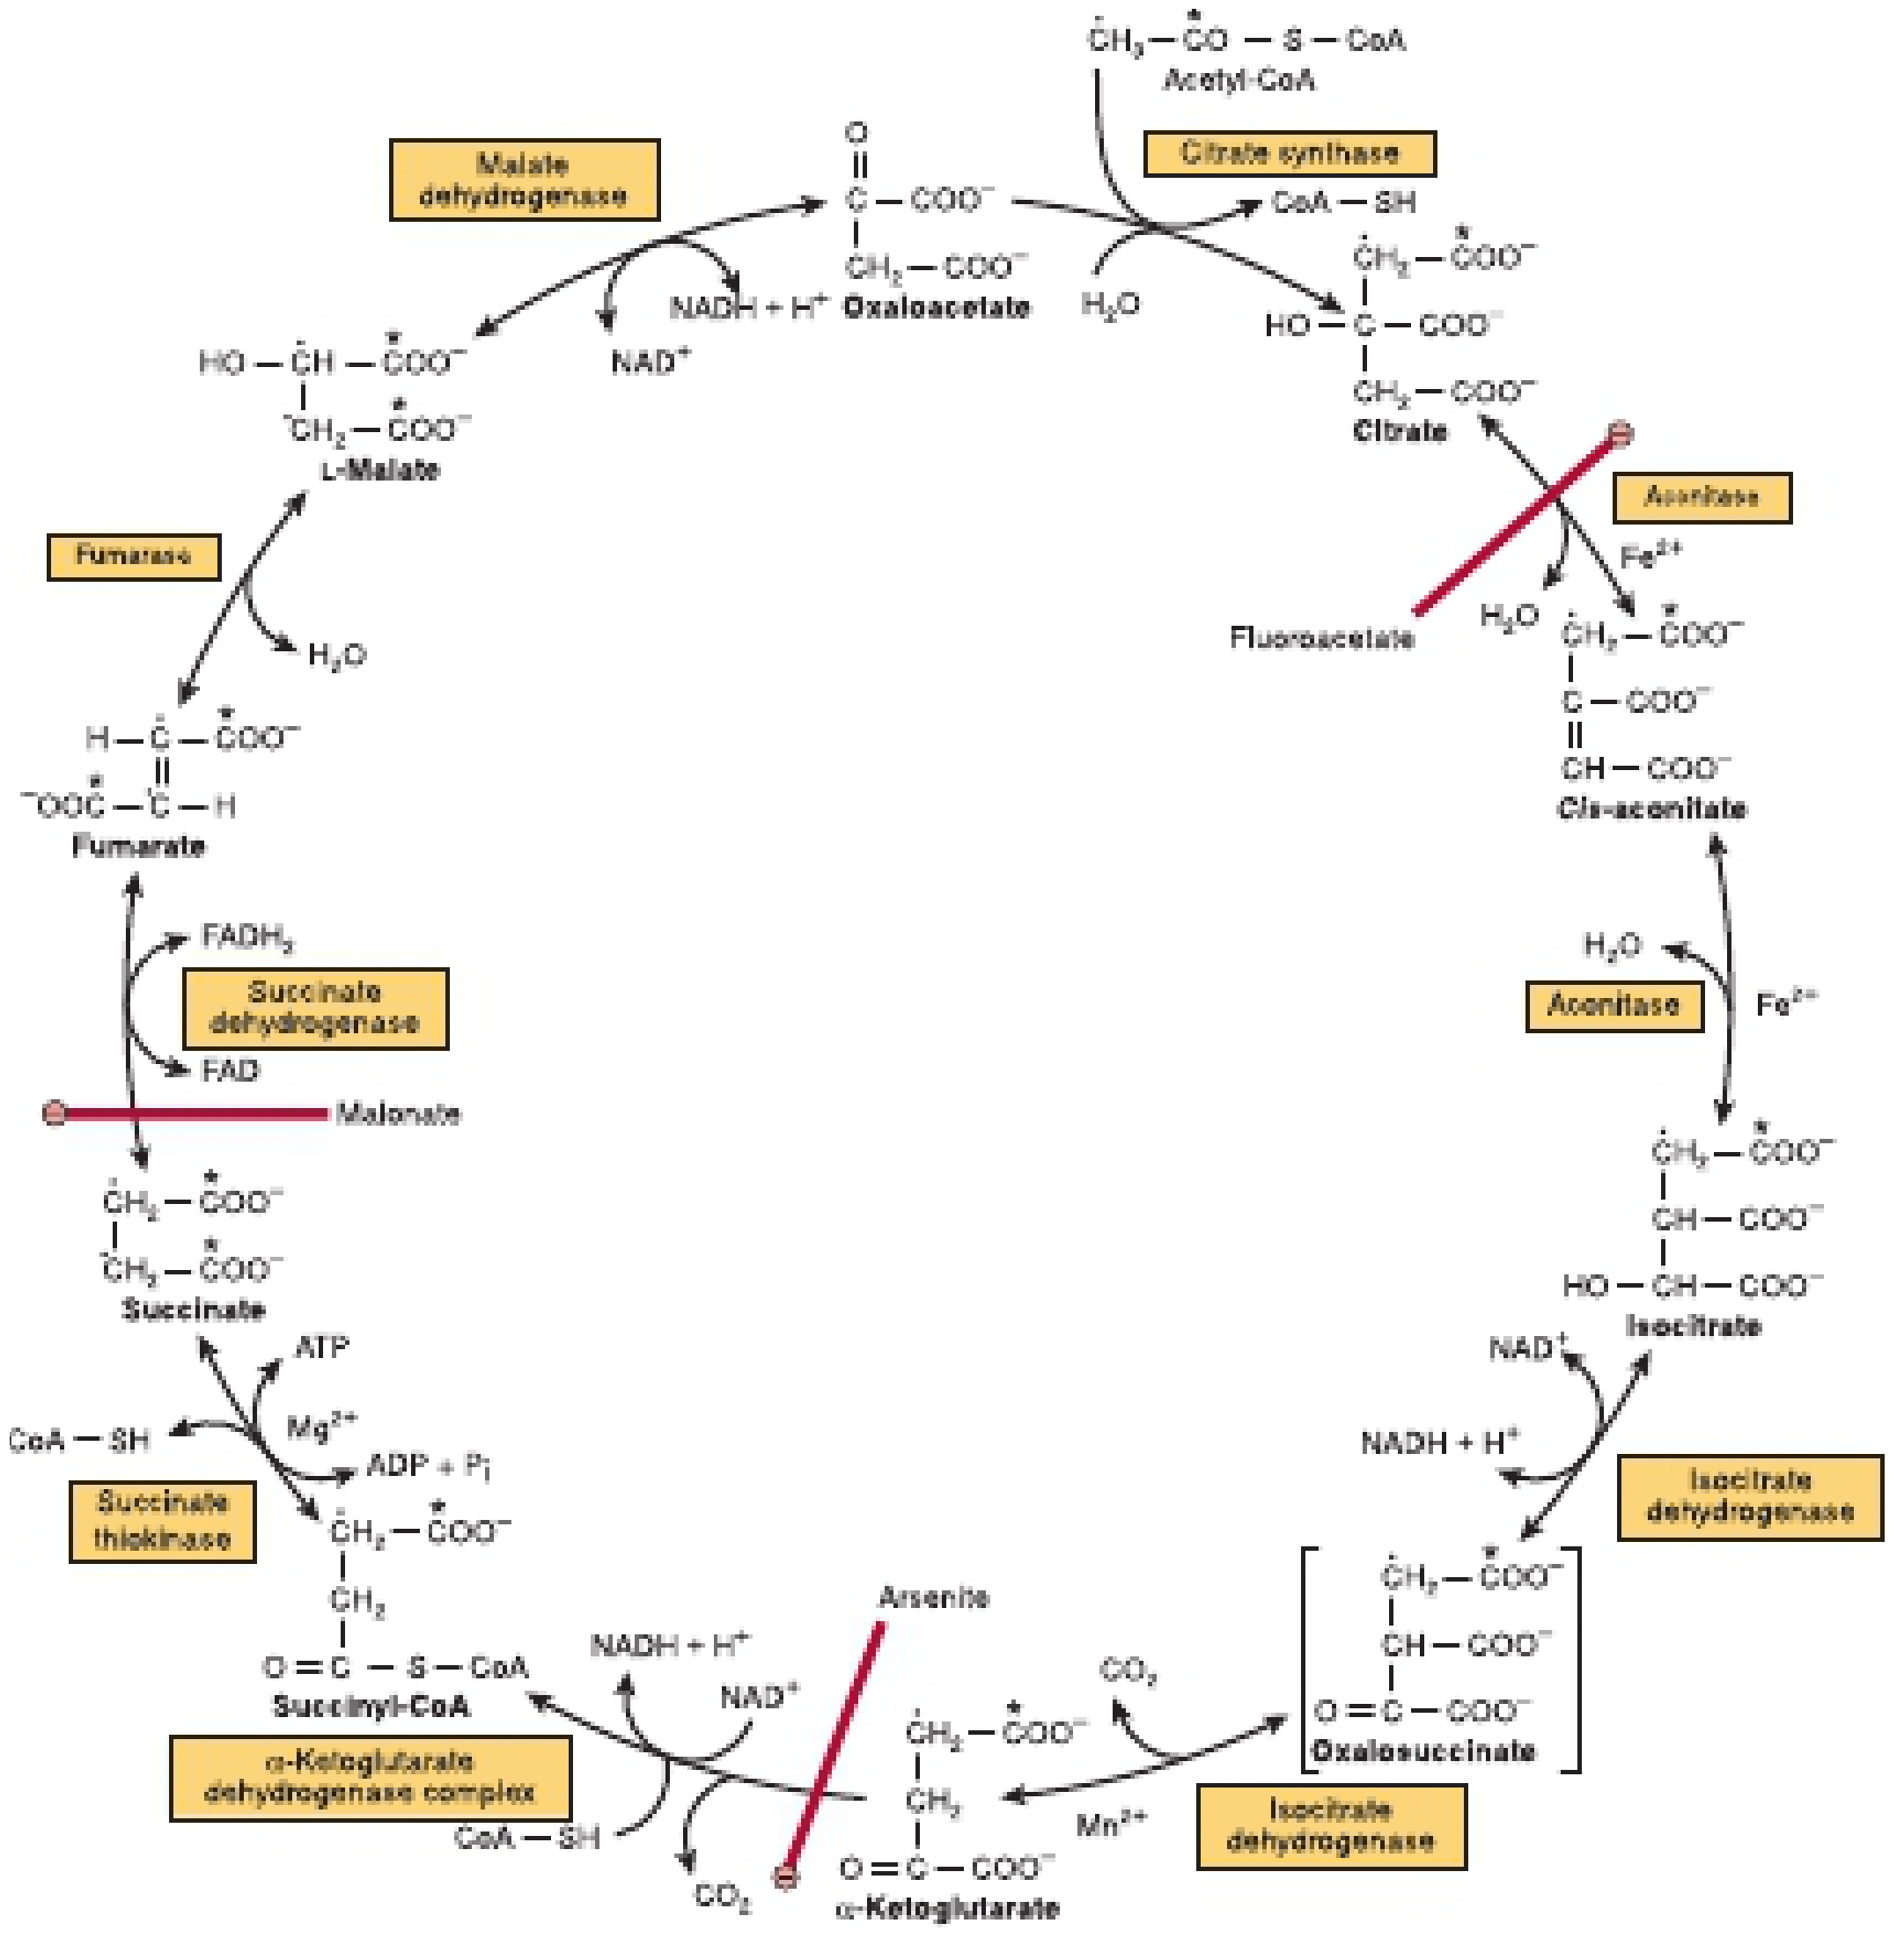
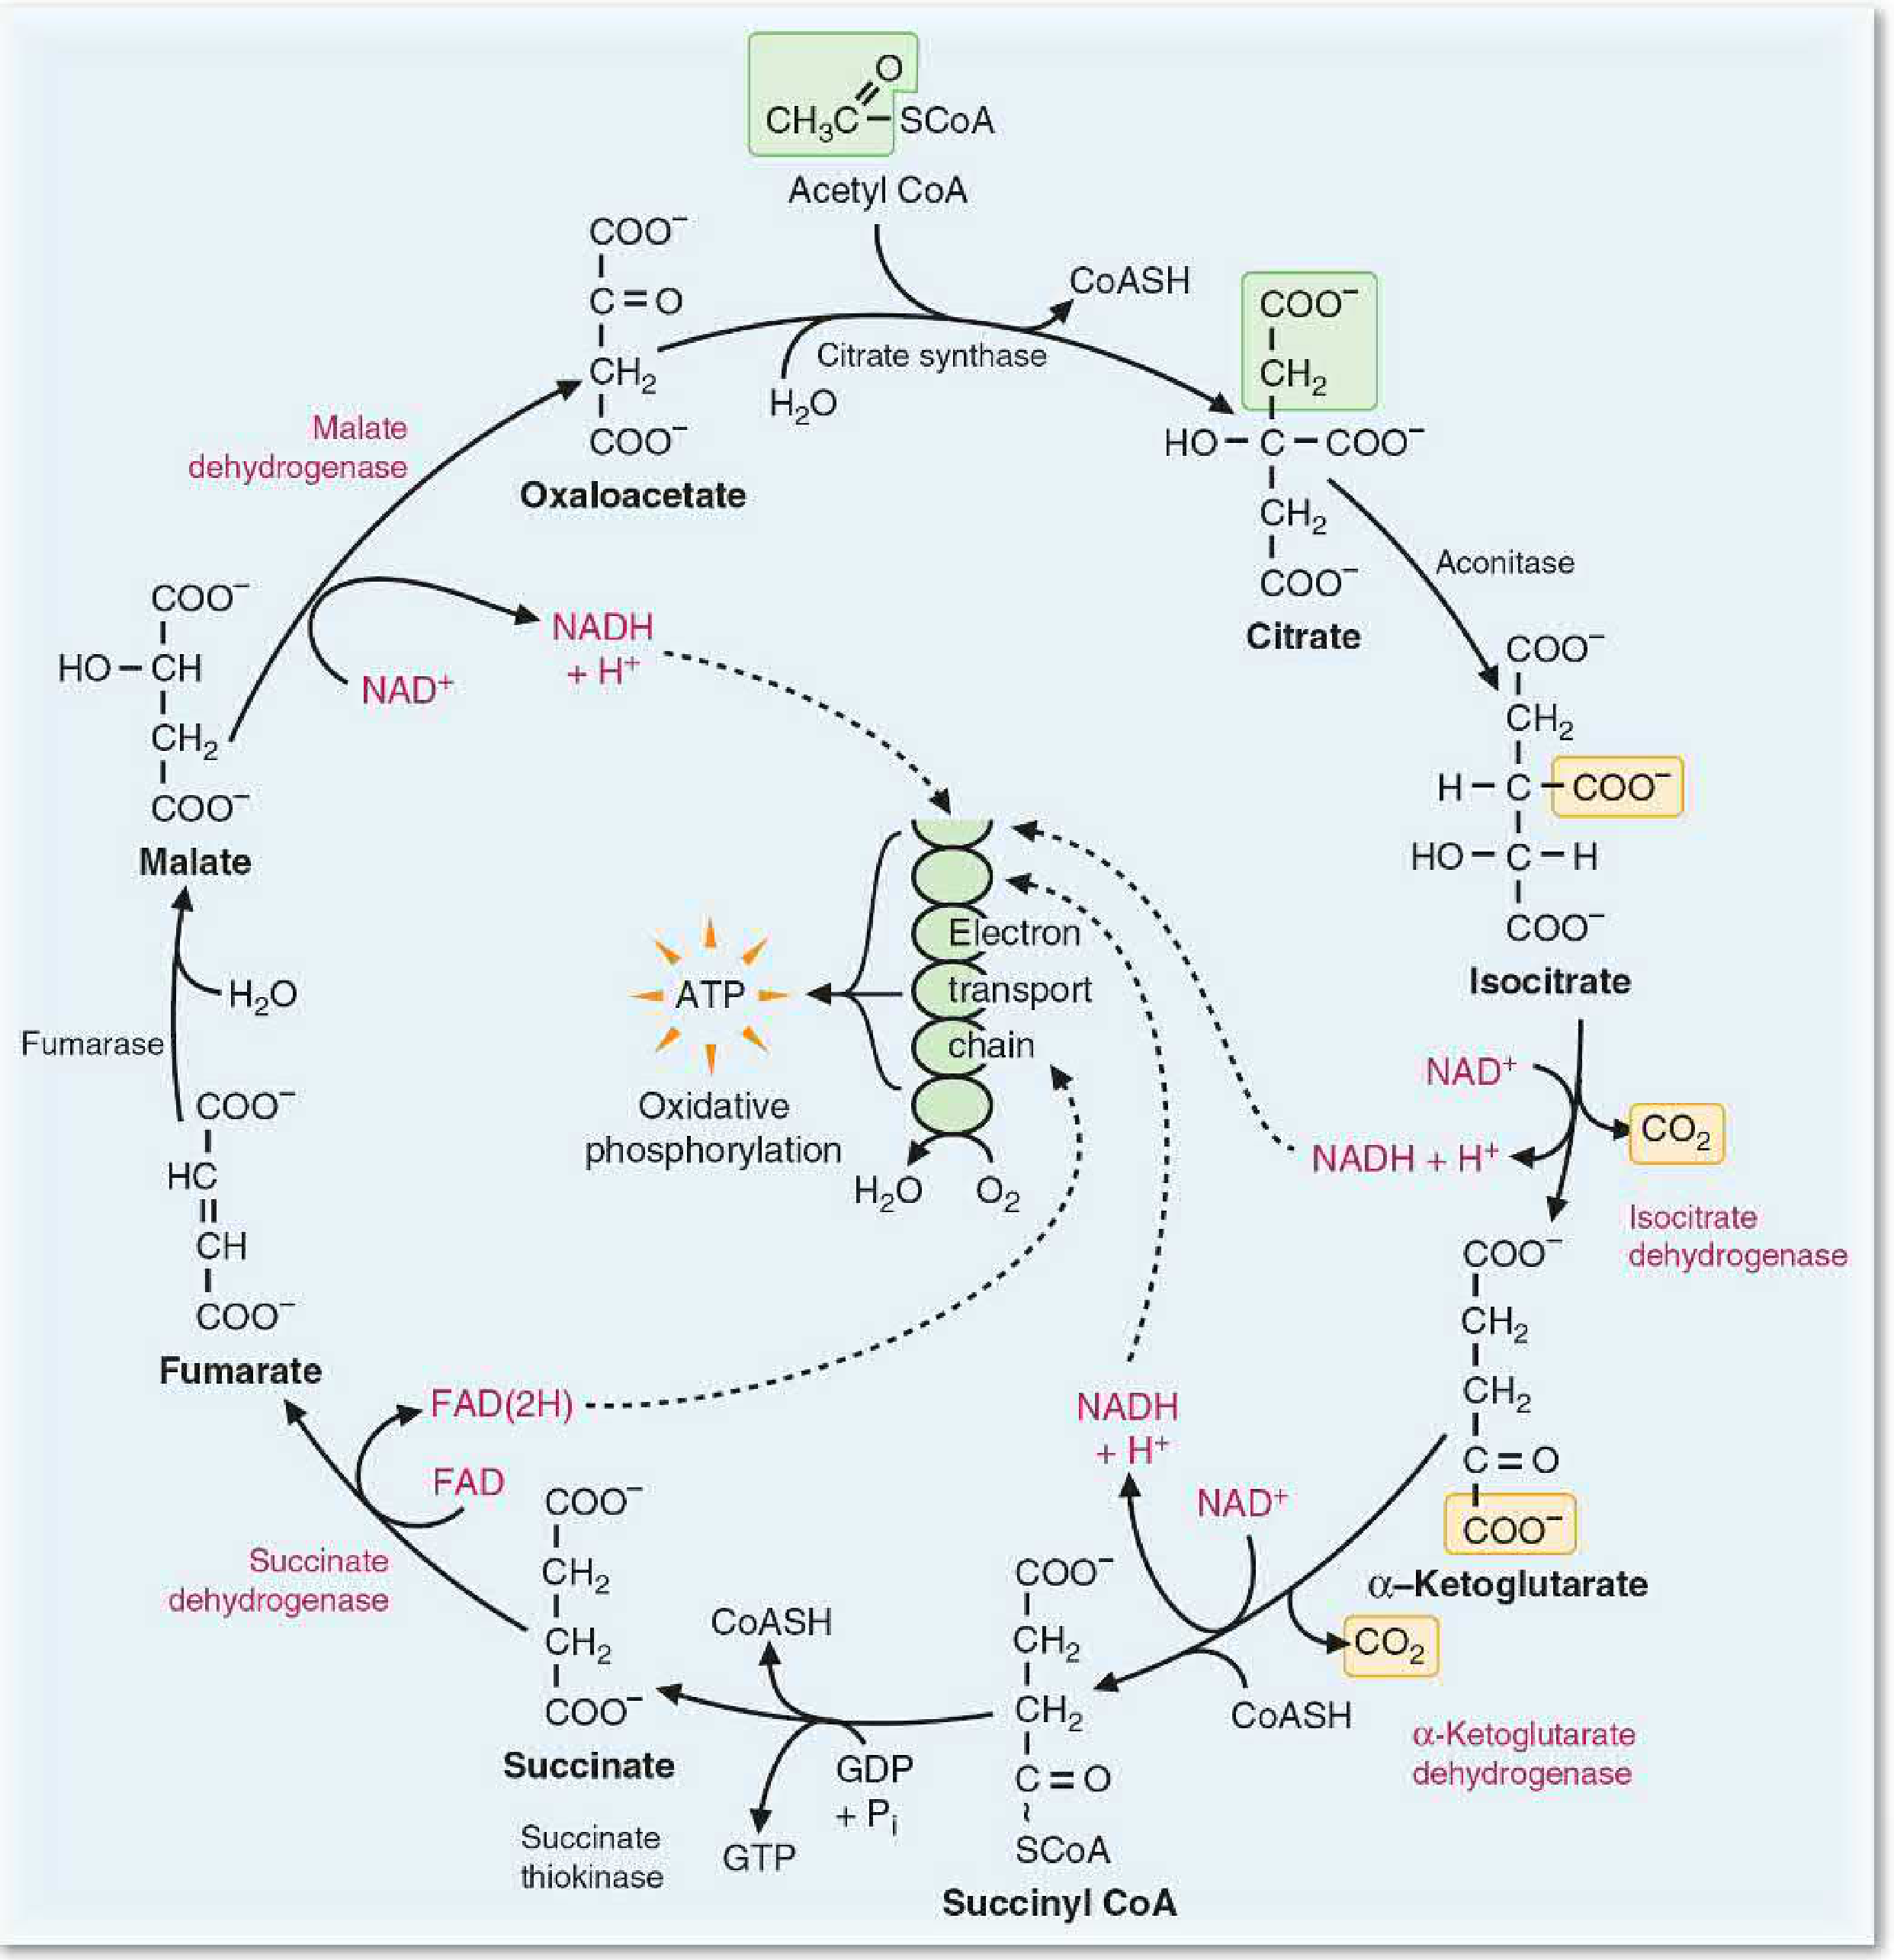
THE 8 STEPS IN DETAIL
Note: The cycle uses 2C (acetyl-CoA) + 4C (oxaloacetate) → 6C → regenerates 4C. Per turn of cycle: 2 CO₂ released, 3 NADH + 1 FADH₂ + 1 GTP produced.
STEP 1: Oxaloacetate + Acetyl-CoA → Citrate
| Detail | |
|---|---|
| Enzyme | Citrate synthase |
| Substrates | Oxaloacetate (4C) + Acetyl-CoA (2C) + H₂O |
| Products | Citrate (6C) + CoA-SH |
| Type | Condensation (C-C bond formation); exothermic, irreversible |
| Coenzyme | None |
| Regulation | Allosterically inhibited by ATP, NADH, succinyl-CoA, citrate |
| Note | Catalytic role of oxaloacetate - acts as a carrier |
STEP 2: Citrate → Isocitrate (via cis-Aconitate)
| Detail | |
|---|---|
| Enzyme | Aconitase (Aconitate hydratase) |
| Substrates | Citrate |
| Products | Isocitrate (via cis-aconitate intermediate) |
| Type | Dehydration then rehydration (isomerization); reversible |
| Cofactor | Fe²⁺ (iron-sulfur center) |
| Inhibitor | Fluoroacetate (forms fluorocitrate which inhibits aconitase - "lethal synthesis") |
| Note | Citrate is symmetrical but aconitase reacts with it asymmetrically; carbons released as CO₂ are NOT from acetyl-CoA on this turn |
STEP 3: Isocitrate → α-Ketoglutarate + CO₂
| Detail | |
|---|---|
| Enzyme | Isocitrate dehydrogenase |
| Substrates | Isocitrate (6C) + NAD⁺ |
| Products | α-Ketoglutarate (5C) + CO₂ + NADH |
| Type | Oxidative decarboxylation; irreversible → FIRST CO₂ released |
| Cofactor | NAD⁺ → NADH; Mn²⁺ |
| Regulation | Activated by ADP, Ca²⁺, NAD⁺; Inhibited by ATP, NADH |
| Note | RATE-LIMITING step of the TCA cycle; oxalosuccinate is a transient intermediate |
STEP 4: α-Ketoglutarate → Succinyl-CoA + CO₂
| Detail | |
|---|---|
| Enzyme | α-Ketoglutarate dehydrogenase complex (structurally analogous to pyruvate dehydrogenase) |
| Substrates | α-Ketoglutarate (5C) + CoA + NAD⁺ |
| Products | Succinyl-CoA (4C) + CO₂ + NADH |
| Type | Oxidative decarboxylation; irreversible → SECOND CO₂ released |
| Cofactors | TPP, Lipoic acid, CoA, FAD, NAD⁺ (same 5 as PDH) |
| Regulation | Inhibited by Succinyl-CoA, NADH, ATP; Activated by Ca²⁺ |
| Inhibitor | Arsenite (reacts with –SH of lipoic acid, same as PDH inhibition) |
| Note | After this step, all 2 carbons from acetyl-CoA have been oxidized to CO₂ |
STEP 5: Succinyl-CoA → Succinate + GTP
| Detail | |
|---|---|
| Enzyme | Succinate thiokinase (Succinyl-CoA synthetase) |
| Substrates | Succinyl-CoA + GDP + Pi |
| Products | Succinate (4C) + GTP (or ATP in some tissues) + CoA-SH |
| Type | Substrate-level phosphorylation (only such step in TCA cycle) |
| Cofactor | Mg²⁺ |
| Regulation | Driven by substrate concentrations |
| Note | GTP is energetically equivalent to ATP; in liver/kidney, GTP is used directly by PEPCK for gluconeogenesis |
STEP 6: Succinate → Fumarate
| Detail | |
|---|---|
| Enzyme | Succinate dehydrogenase (Complex II of ETC) |
| Substrates | Succinate (4C) + FAD |
| Products | Fumarate (4C) + FADH₂ |
| Type | Oxidation (trans-dehydrogenation); removes two H atoms |
| Cofactor | FAD (not NAD⁺ - because the oxidation of succinate to fumarate is not sufficiently energetic to reduce NAD⁺) |
| Location | Uniquely embedded in the inner mitochondrial membrane |
| Inhibitor | Malonate (structural analog of succinate → competitive inhibition; classic experimental inhibitor) |
| Note | Malonate inhibition of succinate dehydrogenase was used historically to prove the cyclic nature of the pathway (Krebs) |
STEP 7: Fumarate → L-Malate
| Detail | |
|---|---|
| Enzyme | Fumarase (Fumarate hydratase) |
| Substrates | Fumarate + H₂O |
| Products | L-Malate (4C) |
| Type | Hydration (addition of water across double bond); reversible |
| Cofactor | None |
| Stereospecificity | Only the L-form (not D-malate) is produced - stereospecific reaction |
STEP 8: L-Malate → Oxaloacetate + NADH
| Detail | |
|---|---|
| Enzyme | Malate dehydrogenase |
| Substrates | L-Malate (4C) + NAD⁺ |
| Products | Oxaloacetate (4C) + NADH |
| Type | Oxidation; thermodynamically unfavorable (ΔG° = +7.1 kJ/mol) |
| Cofactor | NAD⁺ → NADH |
| Note | Equilibrium strongly favors malate; reaction driven forward by rapid removal of OAA by citrate synthase (step 1). OAA concentration is very low in mitochondria |
SUMMARY TABLE OF 8 REACTIONS
| Step | Substrate | Product | Enzyme | Coenzyme | Type |
|---|---|---|---|---|---|
| 1 | OAA + Acetyl-CoA | Citrate | Citrate synthase | None | Condensation |
| 2 | Citrate | Isocitrate | Aconitase | Fe²⁺ | Isomerization |
| 3 | Isocitrate | α-KG + CO₂ | Isocitrate DH | NAD⁺→NADH | Ox. decarboxylation |
| 4 | α-KG | Succinyl-CoA + CO₂ | α-KG DH complex | NAD⁺→NADH | Ox. decarboxylation |
| 5 | Succinyl-CoA | Succinate | Succinate thiokinase | GDP→GTP | Substrate-level phosphorylation |
| 6 | Succinate | Fumarate | Succinate DH | FAD→FADH₂ | Oxidation |
| 7 | Fumarate | L-Malate | Fumarase | None | Hydration |
| 8 | L-Malate | Oxaloacetate | Malate DH | NAD⁺→NADH | Oxidation |
NET EQUATION PER ACETYL-CoA:
Acetyl-CoA + 3 NAD⁺ + FAD + GDP + Pi + 2 H₂O → 2 CO₂ + 3 NADH + FADH₂ + GTP + CoA-SH
PART III: INHIBITORS OF THE KREBS CYCLE
| Inhibitor | Enzyme Inhibited | Step | Mechanism | Clinical/Significance |
|---|---|---|---|---|
| Fluoroacetate (fluorocitrate) | Aconitase | Step 2 | Fluoroacetate is converted to fluorocitrate (by citrate synthase) → fluorocitrate tightly inhibits aconitase | Rat poison (1080); "lethal synthesis" - harmless precursor converted to toxic product inside cell |
| Arsenite (As³⁺) | α-Ketoglutarate DH complex | Step 4 | Reacts with –SH groups of lipoic acid (same as in PDH); inactivates the complex | Arsenic poisoning; also inhibits PDH |
| Malonate | Succinate dehydrogenase | Step 6 | Structural analog of succinate → competitive inhibition | Classic experimental inhibitor (used by Krebs to prove the cycle); not a natural toxin |
| NADH (high) | Isocitrate DH, α-KG DH, Malate DH, Citrate synthase | Steps 3, 4, 8, 1 | Product inhibition; signals energy sufficiency | Physiological regulation; NADH/NAD⁺ ratio controls cycle flux |
| ATP (high) | Citrate synthase, Isocitrate DH | Steps 1, 3 | Allosteric inhibition; signals high energy charge | Energy status regulation |
| Succinyl-CoA | Citrate synthase, α-KG DH | Steps 1, 4 | Product feedback inhibition | Controls acetyl-CoA entry into cycle |
| Ammonia (NH₄⁺) | α-KG DH | Step 4 | Inhibits enzyme; also depletes cycle by withdrawing α-KG to form glutamate | Hyperammonemia (liver disease) → decreased TCA flux → decreased ATP → coma |
| Oxamate | Malate DH | Step 8 | Competitive inhibitor (analog of pyruvate/oxaloacetate) | Experimental tool |
Special Note - Fluoroacetate Poisoning ("Lethal Synthesis"):
PART IV: ENERGETICS OF THE KREBS CYCLE
A. Products Per Turn (Per 1 Acetyl-CoA = Per 2C entering)
| Product | Quantity | Generated at Step |
|---|---|---|
| CO₂ | 2 | Steps 3 (isocitrate DH) and 4 (α-KG DH) |
| NADH | 3 | Steps 3, 4, and 8 |
| FADH₂ | 1 | Step 6 (succinate DH) |
| GTP | 1 | Step 5 (succinate thiokinase) |
B. ATP Yield Per Turn of the Cycle
| Source | ATP yield (modern P/O ratios) |
|---|---|
| 3 NADH × 2.5 ATP each | 7.5 ATP |
| 1 FADH₂ × 1.5 ATP | 1.5 ATP |
| 1 GTP (directly) | 1 ATP |
| Total per acetyl-CoA | ~10 ATP |
C. Total ATP from 1 Glucose (Aerobic Complete Oxidation)
| Pathway | ATP |
|---|---|
| Glycolysis (substrate-level) | 2 |
| Glycolysis (2 NADH → ETC via malate-aspartate shuttle) | 5 |
| Pyruvate dehydrogenase (2 × 1 NADH) | 5 |
| TCA cycle × 2 (per glucose = 2 acetyl-CoA) | 20 |
| TOTAL | ~30-32 ATP |
D. Efficiency
- Complete aerobic oxidation: ∼40% of free energy of glucose captured as ATP
- Compare with anaerobic glycolysis: only 2 ATP per glucose
- TCA cycle accounts for ~65% of total ATP produced from glucose oxidation
PART V: REGULATION OF THE KREBS CYCLE
Primary Regulation: Supply of NAD⁺ (Respiratory Control)
- TCA cycle is tightly coupled to the ETC via NADH and FADH₂
- When ATP demand is high → ADP accumulates → ETC and oxidative phosphorylation speed up → NAD⁺ regenerated → TCA cycle accelerates
- When ATP is plentiful → ADP falls → ETC slows → NADH accumulates → NAD⁺ is limiting → TCA cycle slows
- The ATP/ADP ratio and NADH/NAD⁺ ratio are the master regulators
Site 1: Citrate Synthase (Step 1)
| Activators | Inhibitors |
|---|---|
| OAA (substrate; low intramitochondrial concentration normally limits rate) | ATP |
| ADP, AMP | NADH |
| Succinyl-CoA (intermediate feedback) | |
| Citrate (product inhibition) | |
| Long-chain acyl-CoA (fatty acid oxidation signal) |
Site 2: Isocitrate Dehydrogenase (Step 3) - RATE-LIMITING
| Activators | Inhibitors |
|---|---|
| ADP (low energy signal) | ATP (high energy signal) |
| Ca²⁺ (during muscle contraction/secretion) | NADH (product) |
| NAD⁺ (substrate) |
- When energy is low (↑ADP, ↓NADH/NAD⁺): isocitrate DH activated → cycle accelerates
- When energy is high (↑ATP, ↑NADH): isocitrate DH inhibited → cycle slows
Site 3: α-Ketoglutarate Dehydrogenase Complex (Step 4)
| Activators | Inhibitors |
|---|---|
| Ca²⁺ (in muscle, during contraction) | Succinyl-CoA (product) |
| High [substrate] (α-KG, CoA, NAD⁺) | NADH (product) |
| ATP |
- Regulated similarly to PDH complex (product inhibition by succinyl-CoA and NADH)
Role of Calcium (Ca²⁺) in TCA Regulation
- Ca²⁺ rises during muscle contraction
- Activates all three regulated enzymes: PDH complex, isocitrate DH, and α-KG DH complex
- Ensures TCA cycle speeds up when energy demand increases (muscle contraction)
- Provides coordinated increase in ATP production to match demand
Hormonal Regulation
| Hormone | Signal | Effect |
|---|---|---|
| Insulin | Fed state | Activates PDH (via phosphatase); promotes TCA cycle |
| Glucagon/Epinephrine | Fasting/stress | Inhibits PDH (via kinase → phosphorylation → inactive); shifts toward gluconeogenesis |
PART VI: CLINICAL AND METABOLIC SIGNIFICANCE
1. Final Common Pathway
- Carbohydrates (via pyruvate → acetyl-CoA)
- Fats (fatty acids → acetyl-CoA; also propionate → succinyl-CoA)
- Amino acids (glucogenic → OAA, α-KG, succinyl-CoA, fumarate, malate; ketogenic → acetyl-CoA)
2. Anaplerotic Reactions (Refilling the cycle)
- Pyruvate carboxylase: Pyruvate + CO₂ → OAA (main anaplerotic reaction; requires biotin + ATP)
- Glutamate/glutamine → α-KG (via transamination or glutamate dehydrogenase)
- Propionyl-CoA → Succinyl-CoA (odd-chain fatty acids, Val, Ile)
3. Biosynthetic Functions (Cataplerosis)
| Intermediate | Biosynthetic Purpose |
|---|---|
| Citrate | → Cytosol → Acetyl-CoA for fatty acid synthesis |
| α-Ketoglutarate | → Glutamate → Other amino acids |
| Succinyl-CoA | → Porphyrin/heme synthesis |
| OAA | → Aspartate → Pyrimidines, urea cycle |
| OAA | → PEP → Gluconeogenesis |
4. Clinical Conditions
| Condition | TCA Cycle Impact |
|---|---|
| Thiamine (B₁) deficiency | PDH and α-KG DH inhibited → pyruvate/lactate accumulate → Wernicke's encephalopathy, beriberi |
| Arsenic poisoning | Inhibits lipoic acid-dependent dehydrogenases (PDH, α-KG DH) → lactic acidosis |
| Fluoroacetate poisoning | Aconitase inhibited → citrate accumulates → TCA halted |
| Hyperammonemia (liver failure) | α-KG withdrawn for glutamate synthesis → TCA cycle depleted → ↓ATP → coma |
| Genetic enzyme deficiencies | Severe neurological damage (CNS depends on glucose oxidation via TCA for ATP) |
SUMMARY DIAGRAM
Glucose (glycolysis)
↓
PYRUVATE
↓ PDH complex (×2) [Inhibited by arsenite, thiamine deficiency]
ACETYL-CoA (2C) + CO₂ + NADH
↓
OAA (4C) + Acetyl-CoA → CITRATE (6C) [Citrate synthase; inhibited by ATP, NADH]
↓ Aconitase [inhibited by fluoroacetate]
ISOCITRATE (6C)
↓ Isocitrate DH + NAD⁺ [RATE-LIMITING; inhibited by ATP/NADH; activated by ADP/Ca²⁺]
α-KETOGLUTARATE (5C) + CO₂ + NADH ← 1st CO₂
↓ α-KG DH complex + NAD⁺ [inhibited by arsenite/NADH/succinyl-CoA; activated by Ca²⁺]
SUCCINYL-CoA (4C) + CO₂ + NADH ← 2nd CO₂
↓ Succinate thiokinase
SUCCINATE (4C) + GTP ← [only substrate-level phosphorylation in TCA]
↓ Succinate DH + FAD [inhibited by malonate; Complex II of ETC]
FUMARATE (4C) + FADH₂
↓ Fumarase + H₂O
L-MALATE (4C)
↓ Malate DH + NAD⁺
OXALOACETATE (4C) + NADH → cycle repeats
PER TURN: 2 CO₂, 3 NADH, 1 FADH₂, 1 GTP → ~10 ATP
PER GLUCOSE (2 turns): 4 CO₂, 6 NADH, 2 FADH₂, 2 GTP → ~20 ATP from TCA
Gluconeogenesis Define Significance (cori cycle) Substrates and pathway Energetics Regulation
gluconeogenesis pathway diagram pyruvate carboxylase PEPCK fructose-1,6-bisphosphatase
gluconeogenesis pathway bypasses irreversible steps glycolysis
GLUCONEOGENESIS
MBBS Biochemistry - Complete Answer
PART I: DEFINITION
- The term comes from Greek: glukos (sweet/glucose) + neos (new) + genesis (creation)
- It is essentially the reversal of glycolysis, but is NOT a simple reversal - it uses 4 unique bypass enzymes to overcome the 3 irreversible steps of glycolysis
- Gluconeogenesis is a predominately hepatic (liver-based), aerobic, and energy-consuming process
PART II: SIGNIFICANCE OF GLUCONEOGENESIS & THE CORI CYCLE
Why Gluconeogenesis is Necessary
| Situation | Why Gluconeogenesis is Required |
|---|---|
| Fasting/starvation | Liver glycogen depleted in 12-18 hours; gluconeogenesis sustains blood glucose |
| RBCs | Lack mitochondria; absolutely dependent on glucose (anaerobic glycolysis); release lactate continuously |
| Brain | Requires ~120 g glucose/day; cannot use fatty acids (blood-brain barrier); switches to ketones only after prolonged fast |
| Renal medulla | Lacks mitochondria; obligate glucose consumer |
| Lens, cornea | Avascular; dependent on anaerobic glycolysis |
| Exercise | Muscle lactate must be recycled; gluconeogenesis maintains glucose supply |
| Low-carbohydrate states | Diabetes (uncontrolled), prolonged starvation, high-fat/protein diets |
THE CORI CYCLE (Lactic Acid Cycle)
MUSCLE / RBC LIVER
┌─────────────────────┐ ┌─────────────────────┐
│ Glucose │ │ Glucose │
│ ↓ (glycolysis) │ ←glucose─│ ↑ │
│ Lactate │──lactate→ │ Gluconeogenesis │
│ (+ 2 ATP) │ │ (costs 6 ATP) │
└─────────────────────┘ └─────────────────────┘
BLOOD (circulation)
- Anaerobic tissues (RBCs, white fast-twitch muscle fibers) produce lactate during glycolysis - net gain of 2 ATP
- Lactate enters the bloodstream and is transported to the liver (and kidney)
- Liver converts lactate → pyruvate (via LDH) → glucose via gluconeogenesis - costs 6 ATP
- Glucose re-enters circulation and is used again by muscle/RBCs
- Muscle makes 2 ATP per glucose consumed
- Liver spends 6 ATP to reconvert lactate back to glucose
- Net energetic cost of Cori cycle = 4 ATP (paid by liver via fatty acid oxidation)
- The cycle does NOT create new carbon - it recycles carbon; energy is transferred from liver to peripheral tissues
- Prevents lactic acidosis during intense exercise by clearing lactate
- Preserves glucose supply to obligate glycolytic tissues
- Abnormal Cori cycling contributes to lactic acidosis in liver failure, metformin toxicity, and sepsis
THE GLUCOSE-ALANINE CYCLE (Cahill Cycle)
MUSCLE LIVER
Glucose → Pyruvate Alanine → Pyruvate
+ Amino group (from AA catabolism) ↓
Pyruvate + NH₂ → Alanine (via ALT) Gluconeogenesis
Alanine → blood → liver → Glucose → blood → muscle
- Transfers nitrogen (amino groups) as well as carbon, from muscle to liver
- Liver deaminates alanine → pyruvate + NH₃ → urea (urea cycle)
- This is the main mechanism by which muscle amino acids contribute to gluconeogenesis during prolonged fasting
- The ATP for this glucose synthesis comes from fatty acid oxidation in the liver
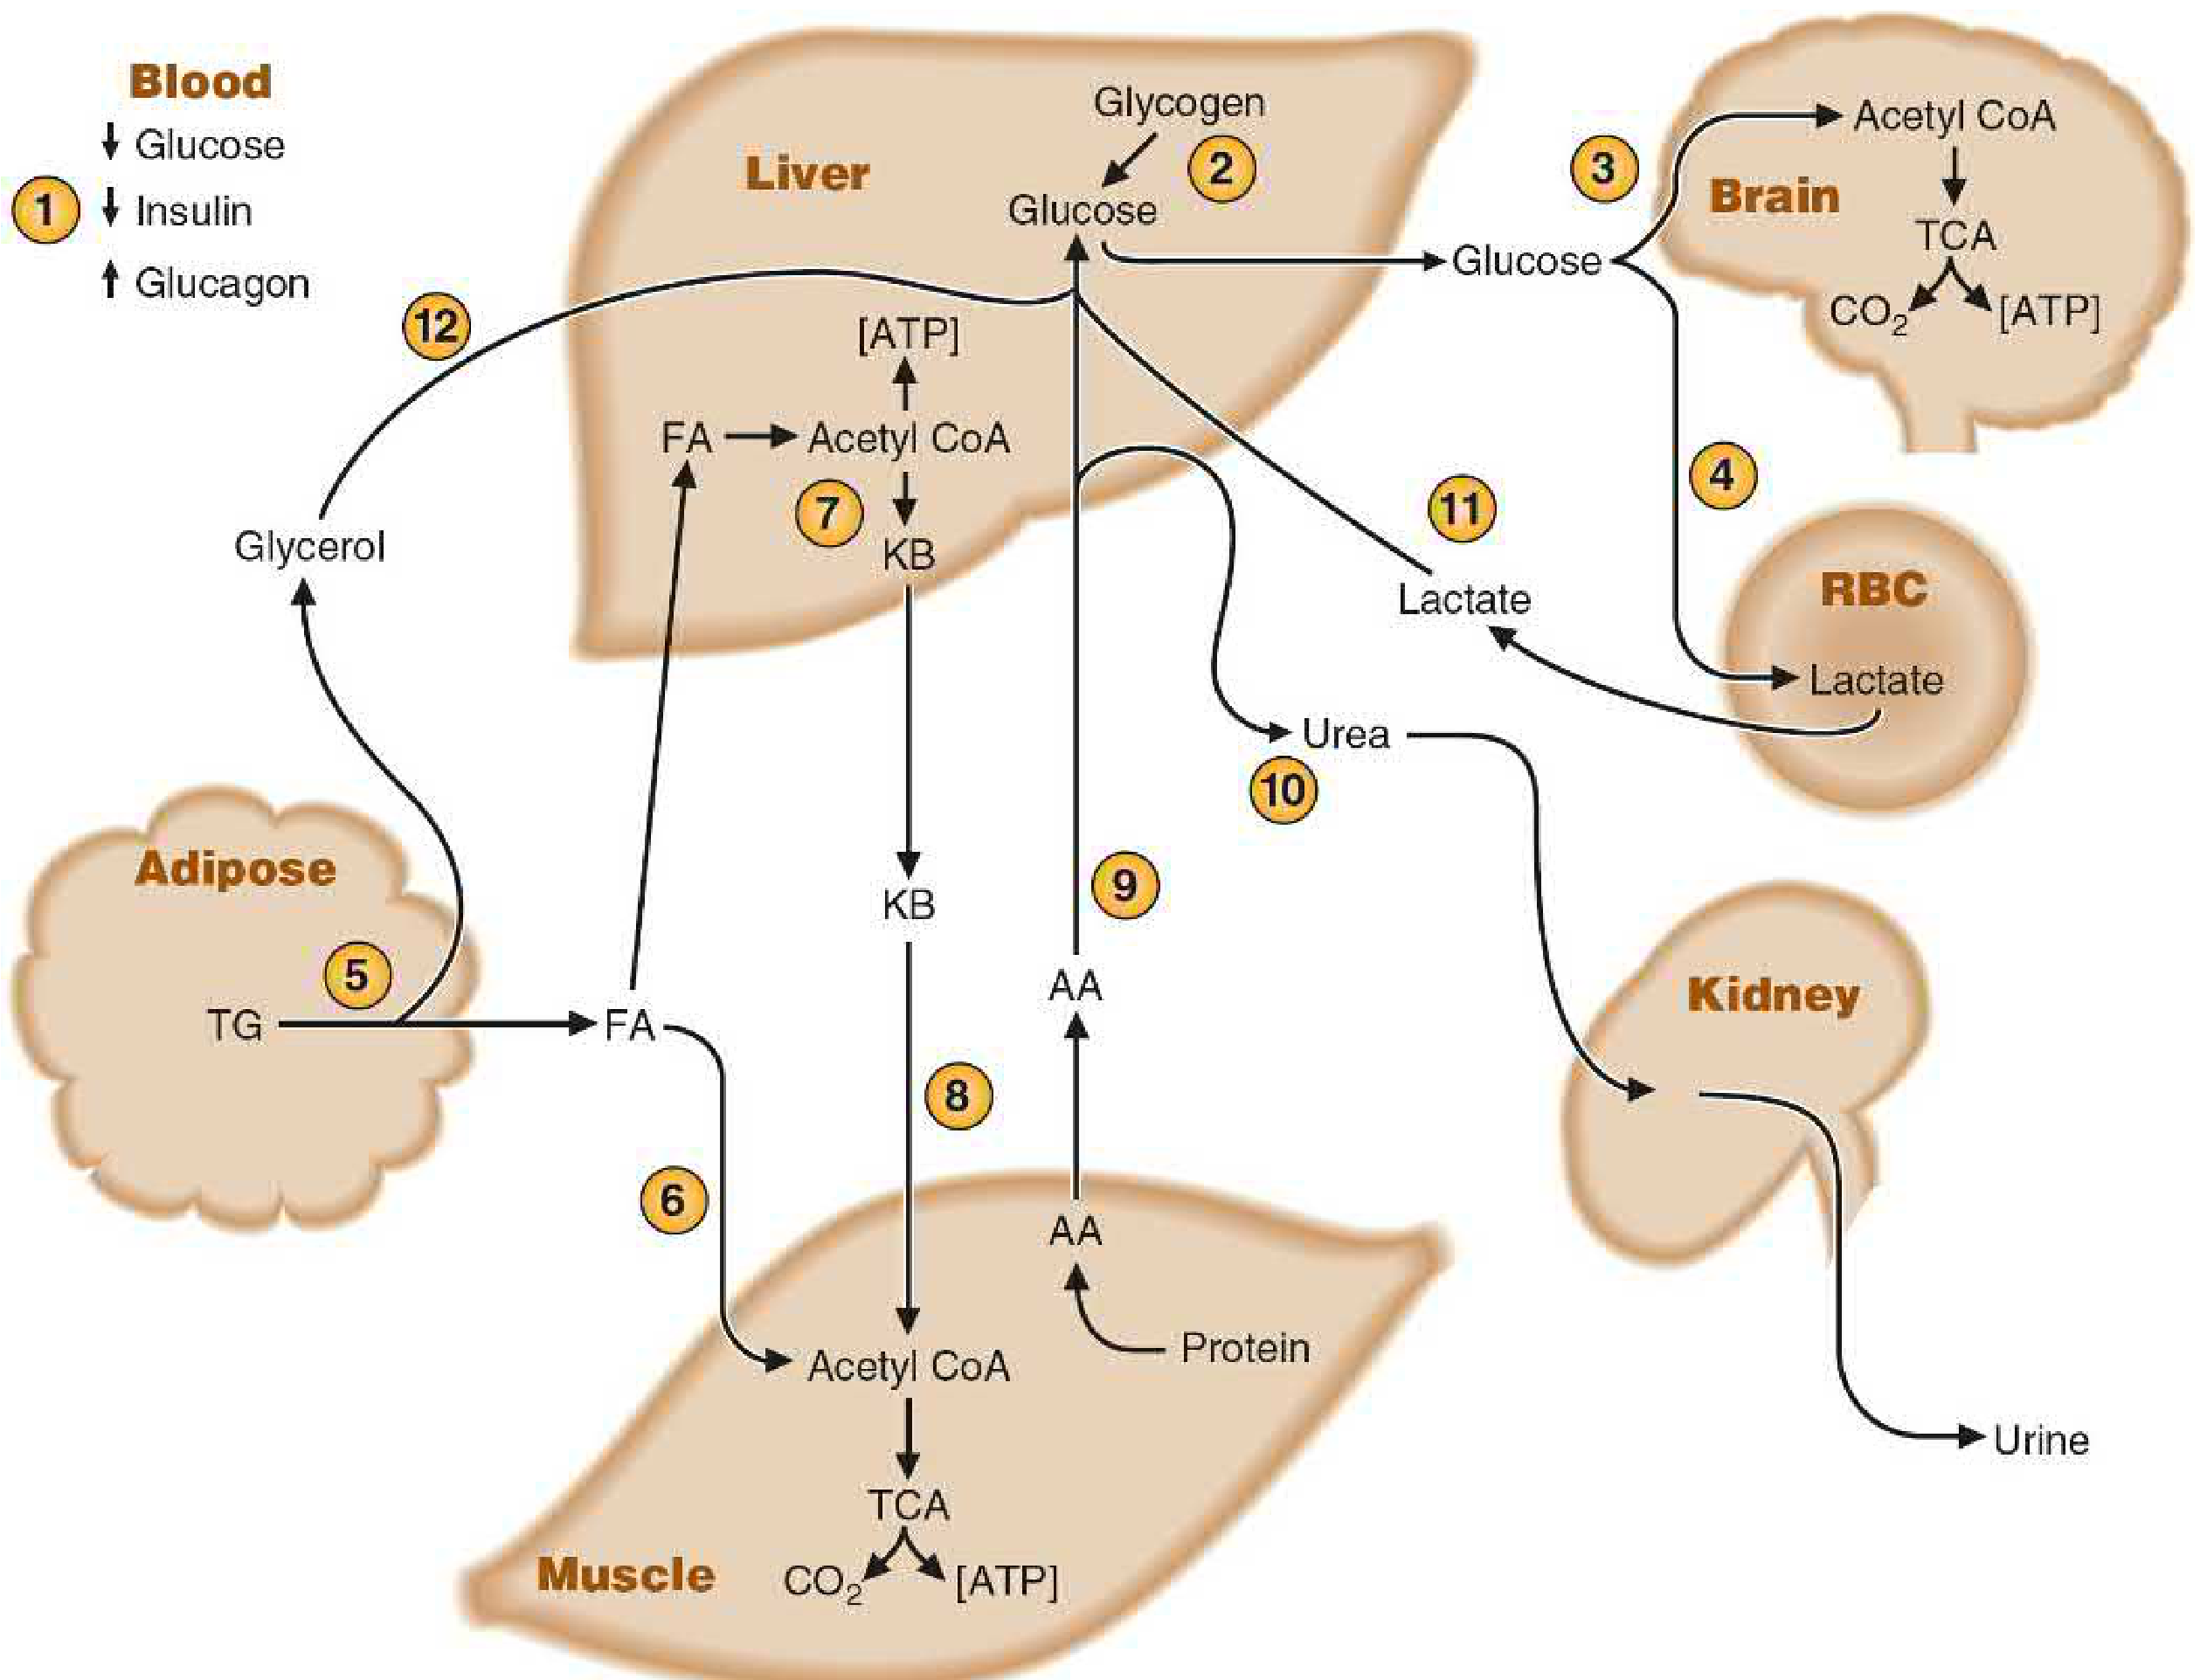
Tissue Interrelationships During Fasting
PART III: SUBSTRATES AND PATHWAY
A. Major Gluconeogenic Substrates
| Substrate | Source | Entry Point into Gluconeogenesis |
|---|---|---|
| Lactate | Anaerobic glycolysis in muscle, RBCs | → Pyruvate (LDH) → Pyruvate carboxylase step |
| Alanine (and most glucogenic AAs) | Muscle protein catabolism | → Pyruvate (ALT) → Pyruvate carboxylase step |
| Glycerol | Adipose tissue lipolysis (hydrolysis of triglycerides) | → Glycerol-3-phosphate → DHAP (enters at triose phosphate level) |
| Propionate | Odd-chain fatty acid oxidation; ruminants | → Succinyl-CoA → OAA → via TCA |
| Other glucogenic AAs | Protein catabolism | Enter as pyruvate, OAA, α-KG, succinyl-CoA, fumarate, or malate |
- The PDH reaction (pyruvate → acetyl-CoA) is irreversible
- Acetyl-CoA enters the TCA cycle as a 2C unit, and the 2 carbons released as CO₂ balance exactly the 2C added - there is no net gain of oxaloacetate
B. THE GLUCONEOGENIC PATHWAY - THE 4 UNIQUE BYPASS ENZYMES
BYPASS 1: Pyruvate → Phosphoenolpyruvate (PEP)
Pyruvate Carboxylase Pyruvate + CO₂ + ATP → Oxaloacetate (OAA) + ADP + Pi
- Cofactor: Biotin (carboxyl group carrier), Mg²⁺
- Location: Mitochondrial matrix
- Allosteric activator: Acetyl-CoA (when acetyl-CoA is high, fatty acids are being oxidized, which signals gluconeogenesis is needed)
- Allosteric inhibitor: ADP
- Reduced to malate (by mitochondrial malate dehydrogenase, using NADH)
- Malate is transported out via the malate-aspartate shuttle
- Reoxidized to OAA in the cytosol (by cytosolic malate dehydrogenase, generating NADH)
Phosphoenolpyruvate Carboxykinase (PEPCK) OAA + GTP → PEP + CO₂ + GDP
- Cofactor: GTP (donated by TCA cycle succinate thiokinase in liver/kidney)
- Location: Cytosol (in humans; some PEPCK is mitochondrial)
- Induced by glucagon, glucocorticoids; repressed by insulin
- Net at bypass 1: 1 ATP + 1 GTP consumed per pyruvate → PEP
BYPASS 2: Fructose-1,6-bisphosphate → Fructose-6-phosphate
Fructose-1,6-bisphosphatase (FBPase-1) Fructose-1,6-bisphosphate + H₂O → Fructose-6-phosphate + Pi
- Location: Cytosol
- Activators: Citrate, ATP (high energy)
- Inhibitors: AMP, Fructose-2,6-bisphosphate (F2,6P) - the most potent inhibitor
- Present in: liver, kidney, skeletal muscle; absent from heart and smooth muscle
- The opposing enzyme PFK-1 is inactive because F2,6P levels are low (glucagon → PKA → phosphorylates PFK-2 → decreases F2,6P)
BYPASS 3: Glucose-6-phosphate → Glucose
Glucose-6-phosphatase (G6Pase) Glucose-6-phosphate + H₂O → Glucose + Pi
- Location: Endoplasmic reticulum (ER) membrane - glucose-6-phosphate must be transported into the ER lumen for hydrolysis
- Present in: liver and kidney cortex ONLY (explains why only liver and kidney can export glucose)
- Absent from muscle and brain - these tissues cannot release free glucose into the blood
- Clinical: Deficiency = Von Gierke's disease (GSD Type I) - hypoglycemia, lactic acidosis, hepatomegaly
C. COMPLETE GLUCONEOGENESIS PATHWAY (from 2 Pyruvate to 1 Glucose)
2 PYRUVATE (mitochondria)
↓ Pyruvate carboxylase (×2) [+2 ATP, +2 CO₂, biotin]
2 OXALOACETATE
↓ Malate DH (×2) [using 2 NADH mitochondria]
2 MALATE → transported out of mitochondria
↓ Malate DH (×2) in cytosol [generates 2 NADH cytosol]
2 OXALOACETATE (cytosol)
↓ PEPCK (×2) [+2 GTP, releases 2 CO₂]
2 PEP ←── BYPASS 1 COMPLETE
↓ Enolase (×2) [reverse - adds H₂O]
2 2-Phosphoglycerate
↓ Phosphoglycerate mutase (×2)
2 3-Phosphoglycerate
↓ Phosphoglycerate kinase (×2) [uses 2 ATP]
2 1,3-Bisphosphoglycerate
↓ G3P dehydrogenase (×2) [uses 2 NADH - provided from OAA→malate conversion above]
2 Glyceraldehyde-3-phosphate (G3P)
↓ Triose phosphate isomerase
1 G3P + 1 DHAP
↓ Aldolase (reverse - condensation)
FRUCTOSE-1,6-BISPHOSPHATE
↓ Fructose-1,6-bisphosphatase [+H₂O] ←── BYPASS 2 COMPLETE
FRUCTOSE-6-PHOSPHATE
↓ Phosphoglucose isomerase
GLUCOSE-6-PHOSPHATE
↓ Glucose-6-phosphatase [+H₂O] ←── BYPASS 3 COMPLETE
GLUCOSE
D. ENTRY OF GLYCEROL INTO GLUCONEOGENESIS
- Glycerol + ATP → Glycerol-3-phosphate (glycerol kinase, in liver)
- Glycerol-3-phosphate + NAD⁺ → DHAP + NADH (glycerol-3-phosphate dehydrogenase)
- DHAP → Gluconeogenesis (bypasses the pyruvate carboxylase and PEPCK steps entirely)
PART IV: ENERGETICS OF GLUCONEOGENESIS
Net Equation (from 2 Pyruvate → 1 Glucose)
2 Pyruvate + 4 ATP + 2 GTP + 2 NADH + 6 H₂O → Glucose + 4 ADP + 2 GDP + 6 Pi + 2 NAD⁺
ATP Cost Breakdown
| Step | Enzyme | Energy |
|---|---|---|
| 2× Pyruvate → 2 OAA | Pyruvate carboxylase | -2 ATP |
| 2× OAA → 2 PEP | PEPCK | -2 GTP |
| 2× 1,3-BPG → 2 G3P | Phosphoglycerate kinase (reverse) | -2 ATP |
| Total | -4 ATP + -2 GTP = -6 high-energy bonds |
Comparison with Glycolysis
| Pathway | Direction | Net Energy |
|---|---|---|
| Glycolysis (glucose → 2 pyruvate) | Exergonic | +2 ATP |
| Gluconeogenesis (2 pyruvate → glucose) | Endergonic | -6 ATP equivalents |
- Gluconeogenesis costs 6 ATP equivalents per glucose - it costs 3× more than glycolysis yields
- This extra energy comes from fatty acid oxidation (which provides abundant acetyl-CoA and ATP in the fasting state)
- This also explains why acetyl-CoA activates pyruvate carboxylase - when FA oxidation is high, ATP and acetyl-CoA are abundant, signaling that gluconeogenesis can be fueled
From Lactate (Net)
- 2 ATP (pyruvate carboxylase)
- 2 GTP (PEPCK)
- 2 ATP (phosphoglycerate kinase)
- Total = 6 ATP equivalents - same total, but 2 NADH are provided by lactate → pyruvate oxidation (LDH), so no external NADH needed
PART V: REGULATION OF GLUCONEOGENESIS
A. Allosteric Regulation (Instantaneous)
1. Pyruvate Carboxylase vs. Pyruvate Dehydrogenase
| Signal | Effect on Pyruvate Carboxylase (gluconeogenesis ↑) | Effect on PDH (glycolysis ↑) |
|---|---|---|
| Acetyl-CoA ↑ | Activated (allosteric) | Inhibited |
| ADP ↑ | Inhibited | - |
| NAD⁺ ↑ | - | Activated |
- Acetyl-CoA and NADH accumulate
- Acetyl-CoA activates pyruvate carboxylase → more OAA → more glucose
- Acetyl-CoA and NADH inhibit PDH → pyruvate not burned → goes to gluconeogenesis
- This reciprocal regulation is the key switch from carbohydrate catabolism to gluconeogenesis
2. FBPase-1 vs. PFK-1 (the most important regulatory point)
| Regulator | Effect on PFK-1 (glycolysis) | Effect on FBPase-1 (gluconeogenesis) |
|---|---|---|
| Fructose-2,6-bisphosphate (F2,6P) | Strongly activated | Strongly inhibited |
| AMP | Activated | Inhibited |
| ATP | Inhibited | Activated |
| Citrate | Inhibited | Activated |
- Insulin → activates PFK-2 → ↑F2,6P → glycolysis ON, gluconeogenesis OFF
- Glucagon → PKA → phosphorylates PFK-2/FBPase-2 → FBPase-2 domain active → ↓F2,6P → gluconeogenesis ON, glycolysis OFF
3. Glucose-6-phosphatase vs. Glucokinase
| Condition | Glucokinase (glycolysis) | G6Pase (gluconeogenesis) |
|---|---|---|
| Fed (↑glucose, ↑insulin) | Active (induced) | Repressed |
| Fasting (↓glucose, ↑glucagon) | Repressed | Induced |
B. Covalent Modification (Rapid - minutes)
- Glucagon → cAMP → PKA → phosphorylates and inactivates pyruvate kinase
- PEP is no longer converted to pyruvate
- PEP can now proceed backward through gluconeogenesis
- This prevents a futile cycle (PEP → pyruvate → OAA → PEP would waste ATP)
- Glucagon → PKA → phosphorylates PFK-2/FBPase-2 → FBPase-2 domain active → ↓F2,6P → PFK-1 inhibited + FBPase-1 activated → gluconeogenesis
C. Enzyme Induction and Repression (Slow - hours)
| Enzyme | Induced by | Repressed by |
|---|---|---|
| Pyruvate carboxylase | Glucocorticoids | Insulin |
| PEPCK | Glucagon, glucocorticoids, thyroid hormones, starvation | Insulin (strongest repressor) |
| FBPase-1 | Glucagon, glucocorticoids | Insulin |
| G6Pase | Glucagon, glucocorticoids | Insulin |
| Glucokinase (glycolysis) | Insulin, glucose | Glucagon, starvation |
| PFK-1 (glycolysis) | Insulin | Glucagon |
D. Hormonal Regulation Summary
| Hormone | Primary Signal | Effect on Gluconeogenesis | Mechanism |
|---|---|---|---|
| Glucagon | Hypoglycemia, fasting | Strong activation | ↑cAMP → PKA → inactivates PK; ↓F2,6P; induces PEPCK/G6Pase; stimulates AA uptake |
| Cortisol (glucocorticoids) | Stress, prolonged fasting | Activation | Induces PEPCK, G6Pase; promotes muscle protein catabolism → more AA substrates |
| Epinephrine | Stress, exercise | Activation (in liver) | ↑cAMP (β-receptors) → same as glucagon in liver; promotes lactate production in muscle for Cori cycle |
| Thyroid hormones (T₃/T₄) | Metabolic rate | Mild activation (permissive) | Induce PEPCK |
| Insulin | Hyperglycemia, fed state | Strong inhibition | Represses PEPCK, G6Pase; activates PFK-2 (↑F2,6P); activates PK via phosphatase; activates PDH |
E. Substrate Availability (Permissive Regulation)
- Fasting → ↑glucagon → ↑lipolysis → ↑glycerol (substrate) + ↑fatty acids → ↑acetyl-CoA → activates pyruvate carboxylase
- Exercise → ↑lactate from muscle → ↑substrate supply → drives gluconeogenesis
- High-protein meal → ↑amino acids in portal blood → glucagon-stimulated hepatic AA uptake → ↑gluconeogenesis
COMPLETE SUMMARY TABLE
| Aspect | Detail |
|---|---|
| Definition | De novo synthesis of glucose from non-carbohydrate precursors |
| Location | Liver (primary), kidney cortex (secondary) |
| Major substrates | Lactate, glucogenic AAs (alanine, glutamine), glycerol, propionate |
| Unique enzymes | Pyruvate carboxylase, PEPCK, FBPase-1, G6Pase |
| Bypassed steps | Pyruvate kinase, PFK-1, Hexokinase/Glucokinase |
| Energy cost | 4 ATP + 2 GTP = 6 high-energy bonds per glucose |
| Cori cycle | Lactate (muscle/RBC) → liver → glucose → muscle (4 ATP net cost to liver) |
| Glucose-alanine cycle | Alanine (muscle) → liver → pyruvate → glucose; transfers N as urea |
| Rate-limiting step | PEPCK step (OAA → PEP); PEPCK is the most regulated inducible enzyme |
| Master switch | F2,6P: ↑ (insulin) favors glycolysis; ↓ (glucagon) favors gluconeogenesis |
| Activated by | Glucagon, glucocorticoids, acetyl-CoA, ATP, citrate (FBPase-1), fasting |
| Inhibited by | Insulin, AMP, F2,6P, ADP (pyruvate carboxylase) |
| Clinical relevance | Metformin inhibits complex I → ↓ATP/ADP → ↑AMP → inhibits gluconeogenesis; Von Gierke's disease (G6Pase deficiency); diabetes (uncontrolled gluconeogenesis despite hyperglycemia) |
- Harper's Illustrated Biochemistry, 32nd Ed. - Chapters 16, 19
- Basic Medical Biochemistry: A Clinical Approach, 6th Ed. - Chapters 23, 28
- Medical Physiology, Boron & Boulpaep - Chapter 58
Glycogen metabolism Define glycogenesis and glycogenolysis Detailed pathway Regulation of pathways Next question HMP pathway Reaction of pathway Oxidative phase Non oxidative Regulation Significance of HMP shunt
TOPIC 1: GLYCOGEN METABOLISM
PART I: DEFINITIONS
Glycogenesis
Glycogenolysis
Structure of Glycogen
- Branched glucose polymer; glucose units linked by α-1,4-glycosidic bonds in linear chains
- α-1,6 branches every 8-10 residues
- Reducing end attached to protein glycogenin
- All free ends = non-reducing ends (sites of synthesis and degradation)
- MW: 10⁷ to 10⁸ Da
- Liver glycogen: ~100-120 g (up to ~8% liver weight); depleted in ~24h fast
- Muscle glycogen: ~300-400 g total; used locally (muscle lacks glucose-6-phosphatase, so cannot export glucose)
PART II: GLYCOGENESIS - DETAILED PATHWAY
Steps of Glycogen Synthesis
Step 1: Glucose → Glucose-6-phosphate
Hexokinase (muscle) / Glucokinase (liver) Glucose + ATP → Glucose-6-phosphate + ADP Cost: 1 ATP
Step 2: Glucose-6-phosphate → Glucose-1-phosphate
Phosphoglucomutase G6P ⇌ G1P (reversible; Mg²⁺ required) Intermediate: Glucose-1,6-bisphosphate
Step 3: Glucose-1-phosphate → UDP-Glucose (Activation step)
UDP-glucose pyrophosphorylase (UTP:glucose-1-phosphate uridylyltransferase) G1P + UTP → UDP-Glucose + PPi PPi is immediately hydrolyzed by pyrophosphatase → 2 Pi (making reaction irreversible) Cost: 1 UTP (equivalent to 1 ATP) UDP-glucose is the "activated glucose" - the immediate donor for glycogen synthesis
Step 4: Elongation of Glycogen Chain
Glycogen Synthase (RATE-LIMITING, REGULATED enzyme) UDP-Glucose + glycogen (n residues) → Glycogen (n+1 residues) + UDP
- Transfers glucose from UDP-Glucose to the 4'-OH of the non-reducing end
- Forms α-1,4-glycosidic bond
- Requires a primer - cannot start a chain de novo
- Glycogenin is a self-glycosylating protein that forms the primer
- Adds glucose from UDP-glucose to its own Tyr194 residue (autoglycosylation)
- Extends the chain to ~8 residues → sufficient for glycogen synthase to act
Step 5: Branching
Branching enzyme (Amylo-4:6-transferase / α-1,4:α-1,6-glucan transferase)
- When the chain reaches ~11 residues, branching enzyme cleaves a 6-8 residue piece from the non-reducing end
- Reattaches it via an α-1,6 bond to an internal glucose (at least 4 residues from an existing branch)
- Creates a new non-reducing end → more sites for glycogen synthase
- Branching increases solubility and the rate of synthesis/degradation
Glycogenesis Diagram
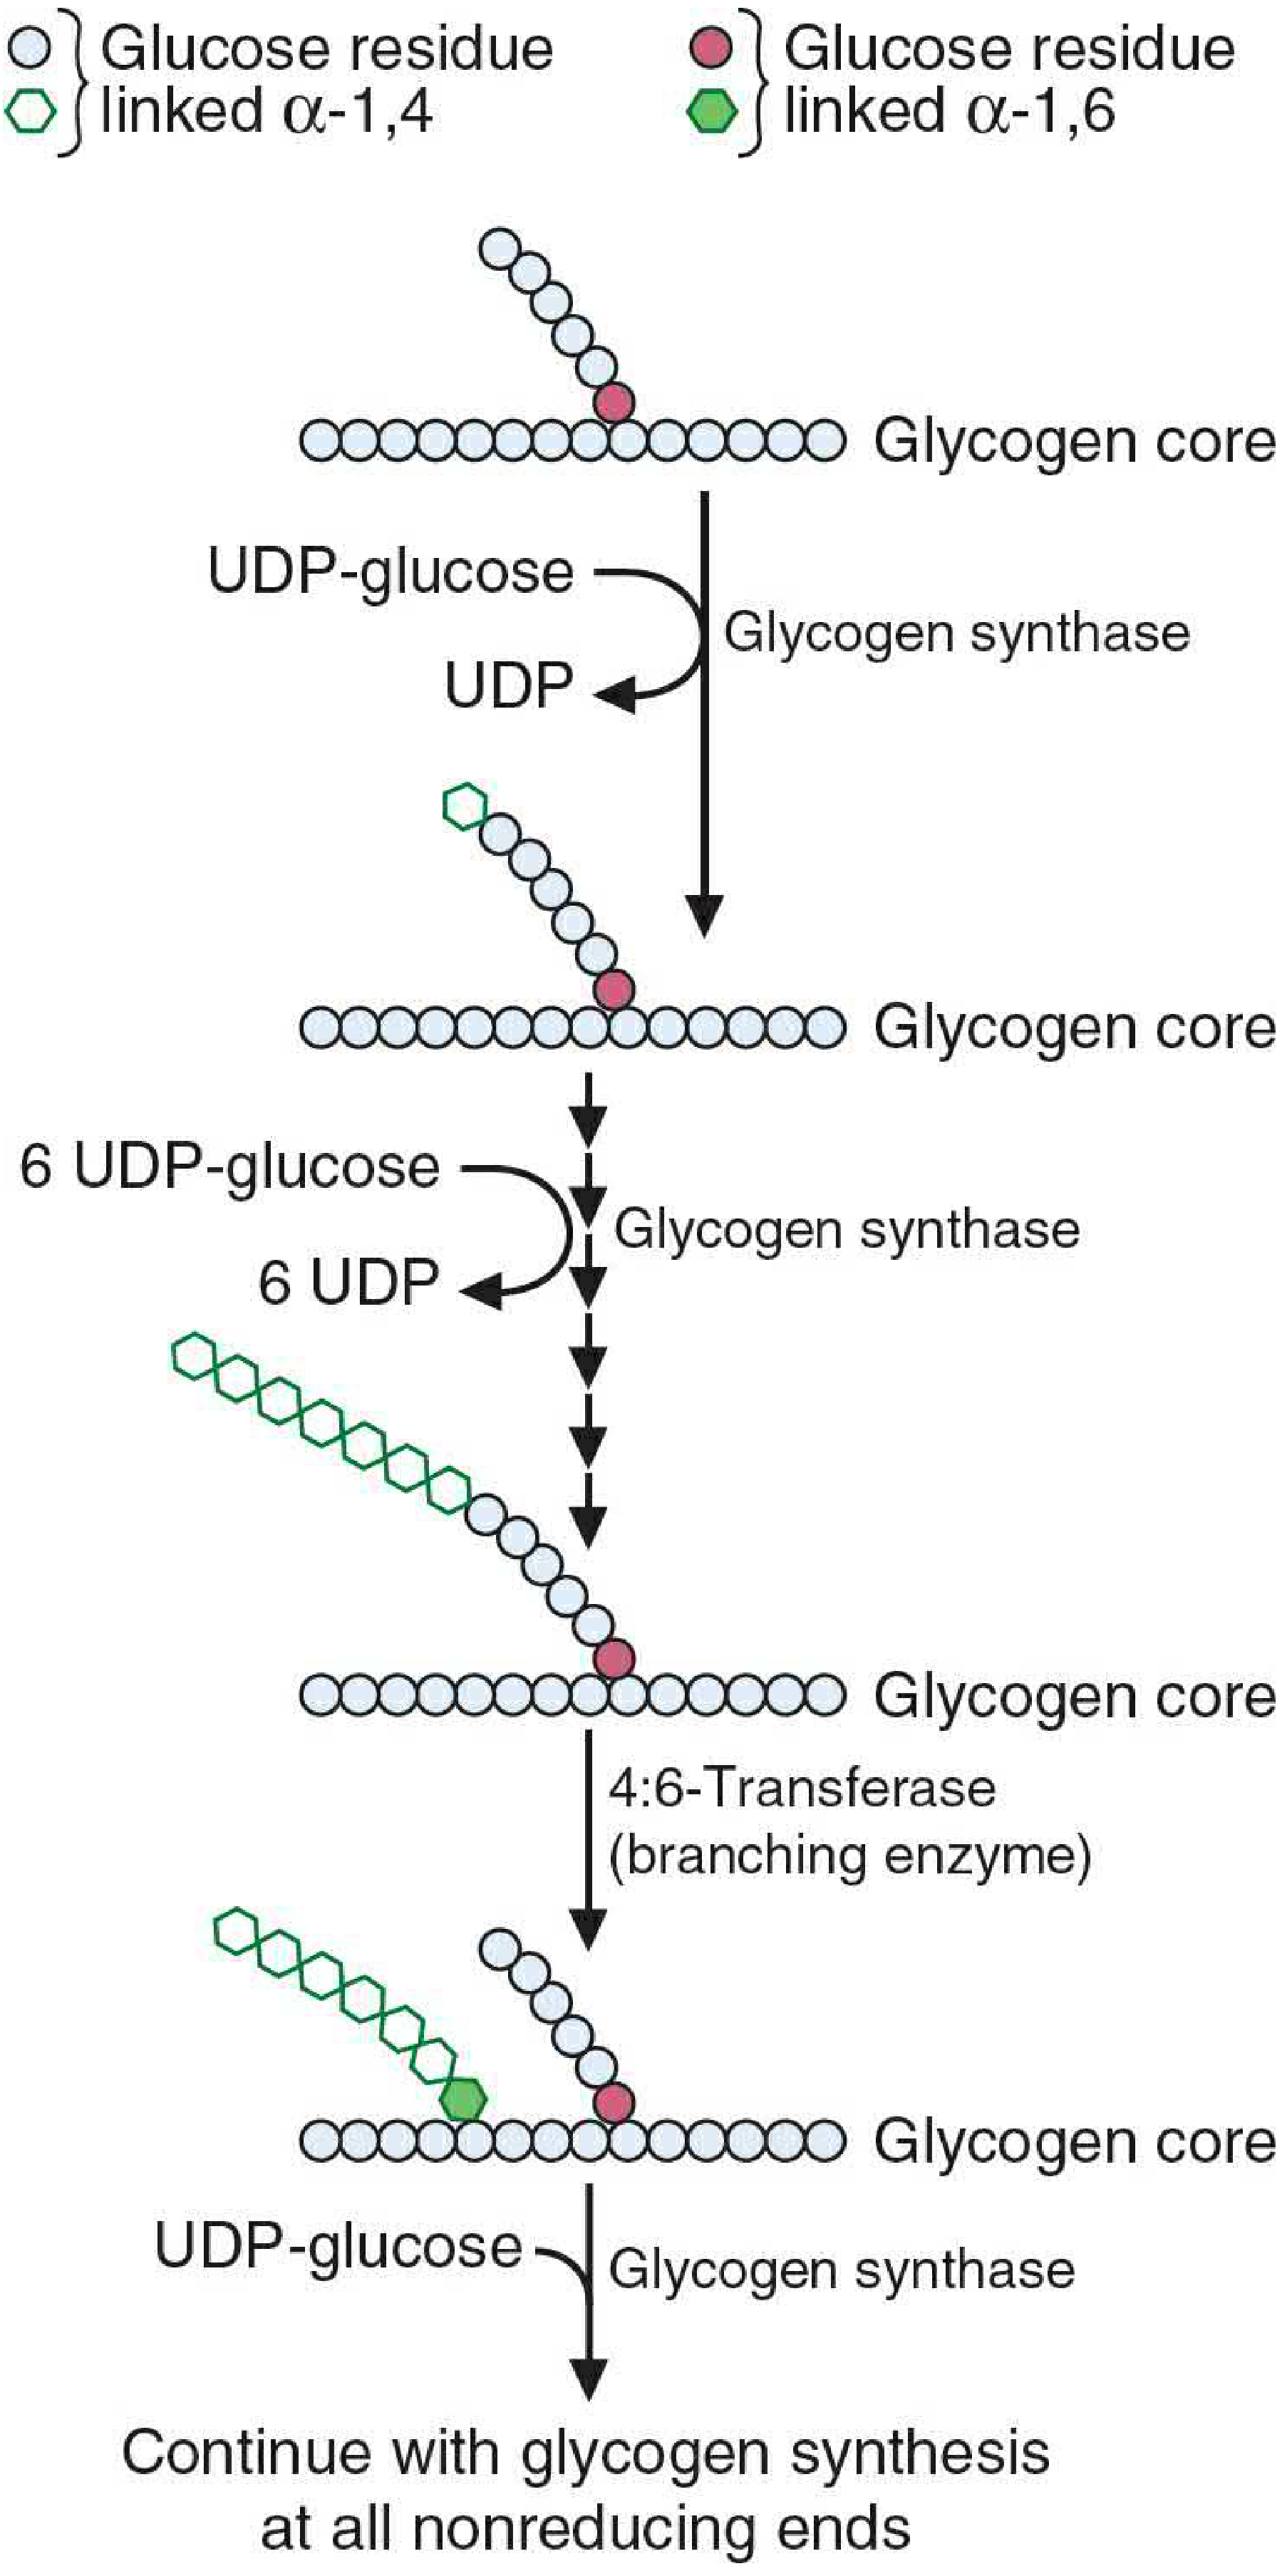
Energy Cost of Glycogenesis
- Per glucose added to glycogen: 2 ATP equivalents (1 ATP for hexokinase + 1 UTP for UDP-glucose pyrophosphorylase; 2 Pi released from PPi hydrolysis)
PART III: GLYCOGENOLYSIS - DETAILED PATHWAY
Steps of Glycogen Degradation
Step 1: Shortening of Linear Chains
Glycogen Phosphorylase (RATE-LIMITING, REGULATED enzyme) Glycogen (n) + Pi → Glucose-1-phosphate + Glycogen (n-1)
- Phosphorolysis - uses Pi (not H₂O), so produces G1P directly (already phosphorylated → saves 1 ATP)
- Works from non-reducing ends toward branch points
- Cleaves α-1,4 bonds only
- Stops 4 residues before a branch point (cannot pass the α-1,6 link)
- Cofactor: Pyridoxal-5'-phosphate (PLP/vitamin B₆) - covalently bound
- Liver isoform = PYGL gene; Muscle isoform = PYGM gene
Step 2: Debranching (two activities of ONE enzyme)
- Transfers 3 of the 4 remaining residues to the non-reducing end of another chain via α-1,4 bond
- One glucose remains at the branch point linked by α-1,6
- Hydrolyzes the α-1,6 branch link
- Releases free glucose (not glucose-1-phosphate) - this is the only step producing free glucose
Glycogenolysis Diagram
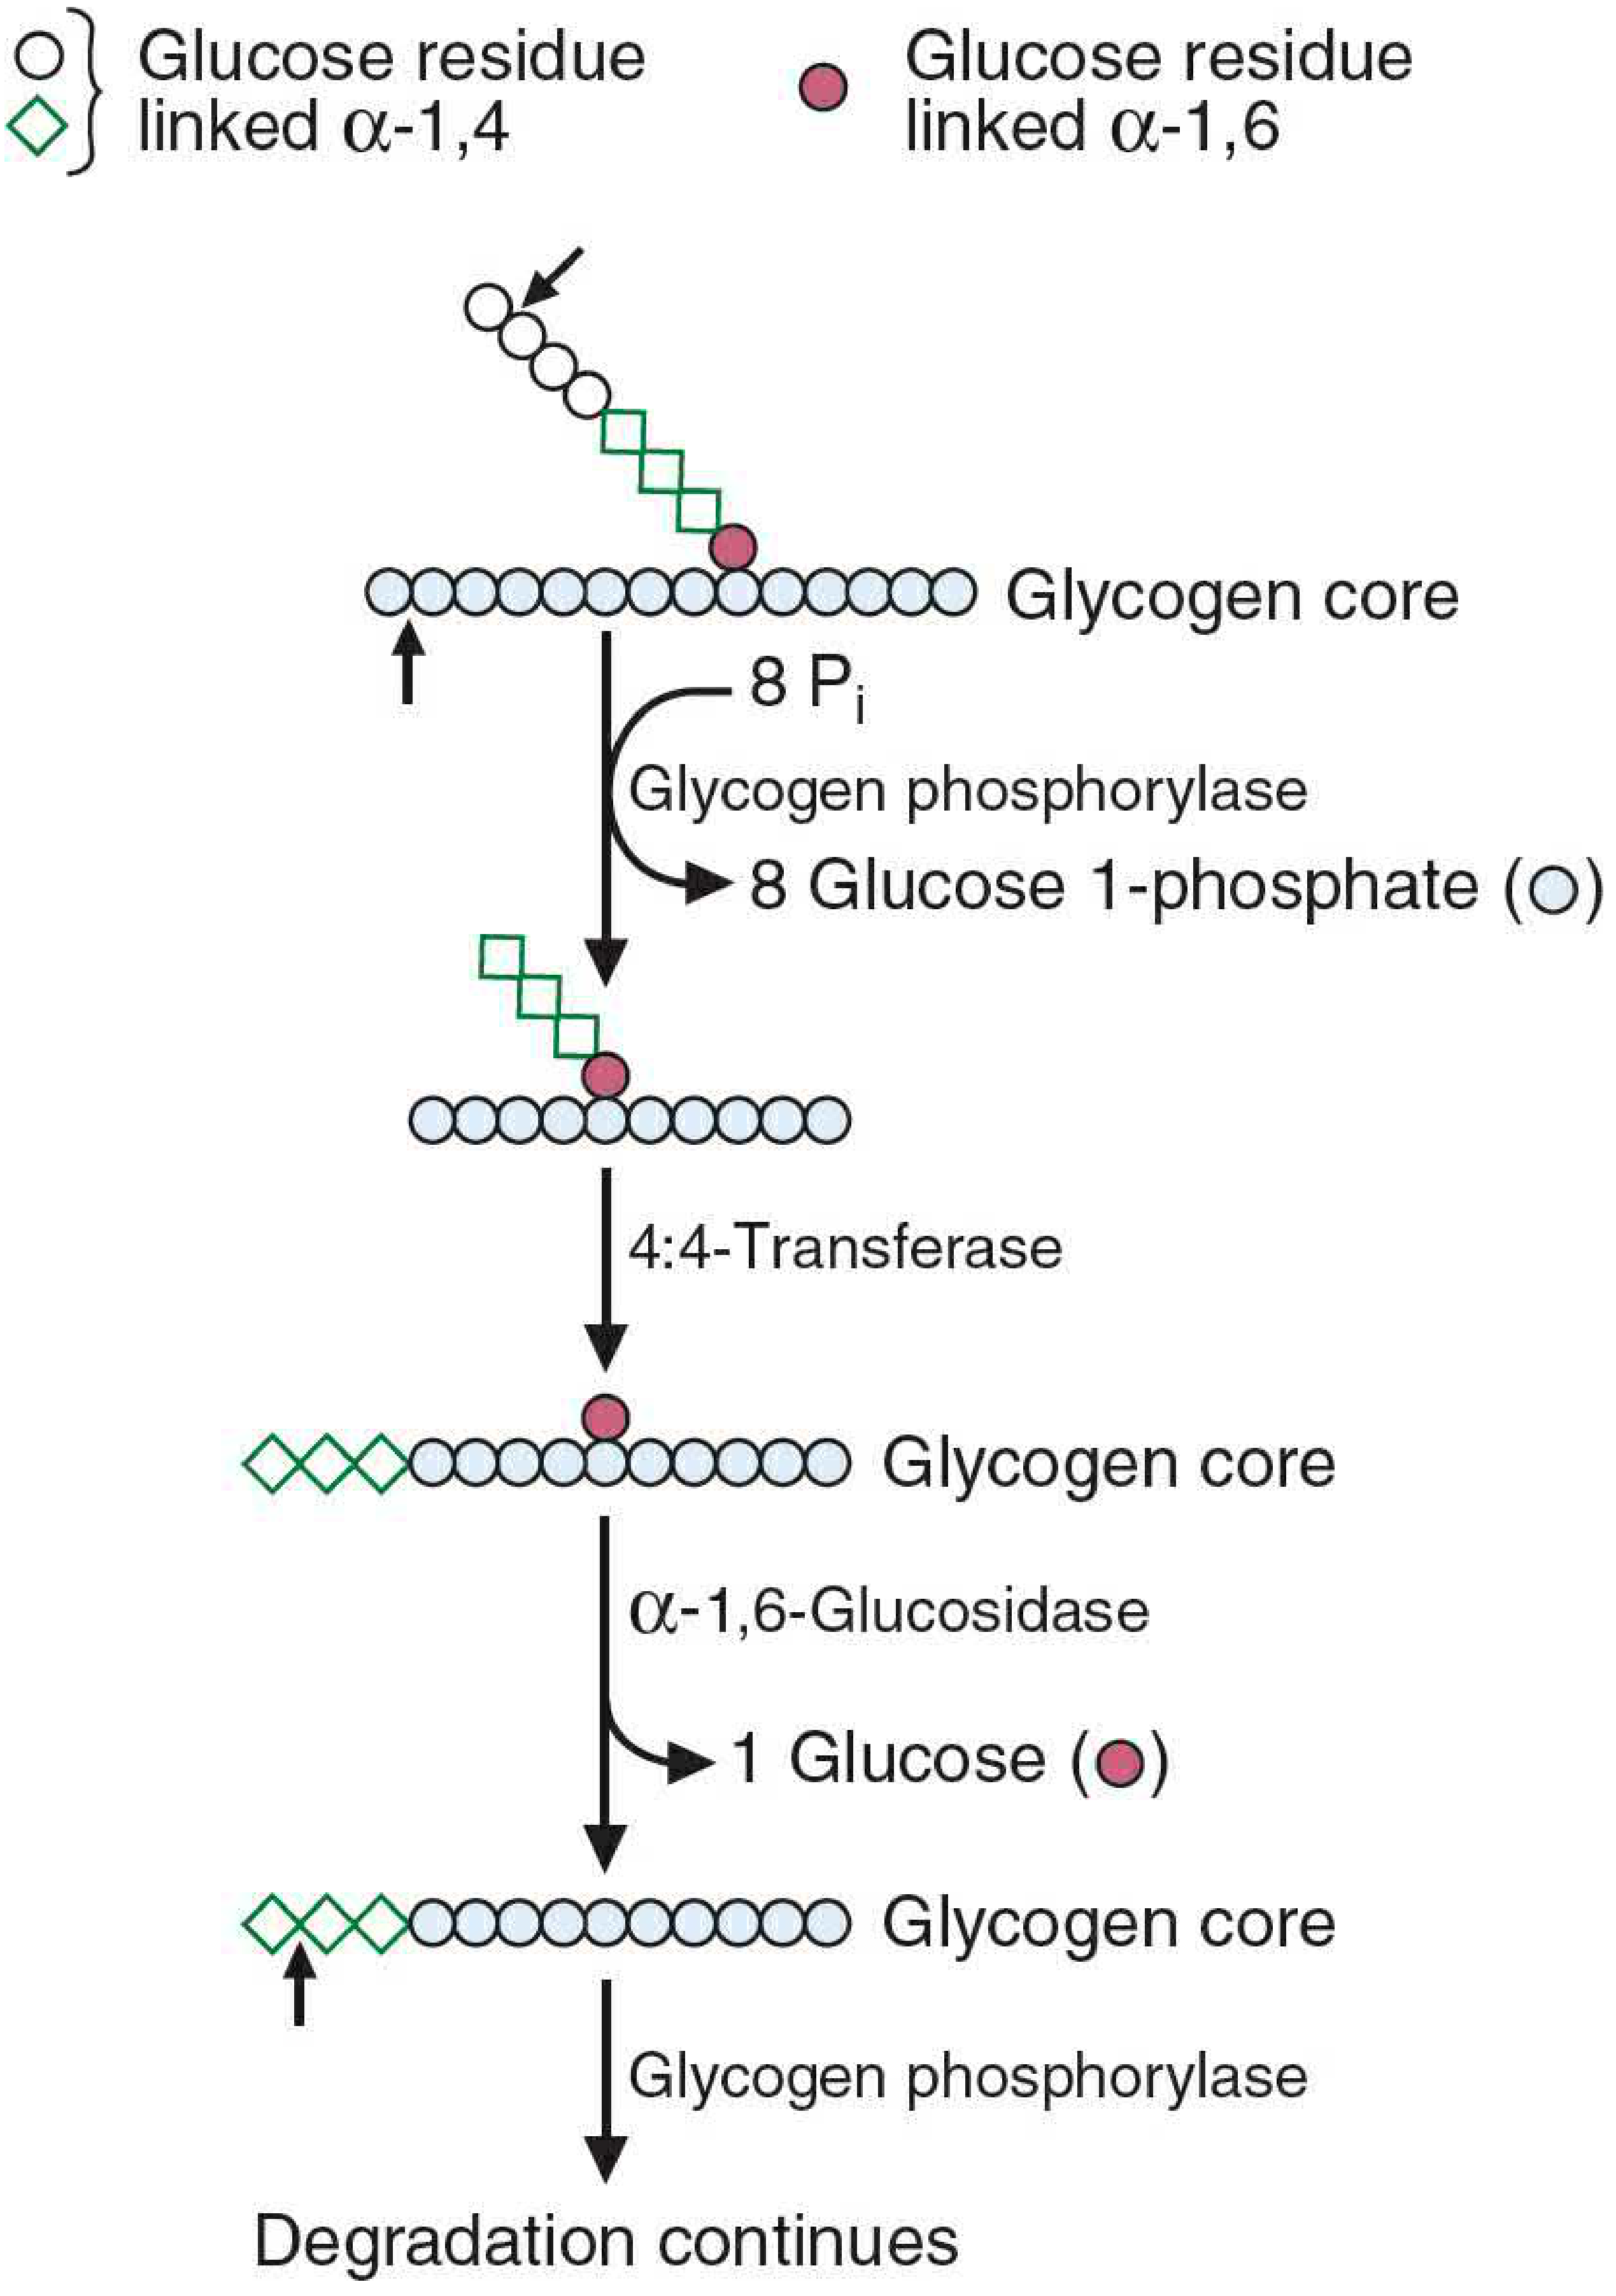
Step 3: Glucose-1-phosphate → Glucose-6-phosphate
Phosphoglucomutase (same as in synthesis, but reverse direction) G1P → G6P
Step 4: G6P → Glucose (LIVER ONLY)
Glucose-6-phosphatase (ER membrane, liver and kidney only) G6P + H₂O → Glucose + Pi
- Glucose enters bloodstream to maintain blood glucose
- Muscle lacks G6P-ase → G6P enters glycolysis directly, cannot export glucose
Energetics of Glycogenolysis
- Per glucose released as G1P: 0 ATP consumed (phosphorolysis saves the 1 ATP cost of hexokinase)
- In glycolysis: G6P enters at step 1, already phosphorylated → net 3 ATP per glucose from glycogen (vs 2 ATP per free glucose in anaerobic glycolysis)
PART IV: REGULATION OF GLYCOGEN METABOLISM
- Glycogen synthase (synthesis): active when dephosphorylated (form a/I); inactive when phosphorylated (form b/D)
- Glycogen phosphorylase (degradation): active when phosphorylated (form a); inactive when dephosphorylated (form b)
- Hormonal (covalent modification - rapid)
- Allosteric (instantaneous)
- Enzyme induction/repression (slow)
A. Regulation by Glucagon/Epinephrine (FASTING/STRESS)
Regulation Diagram
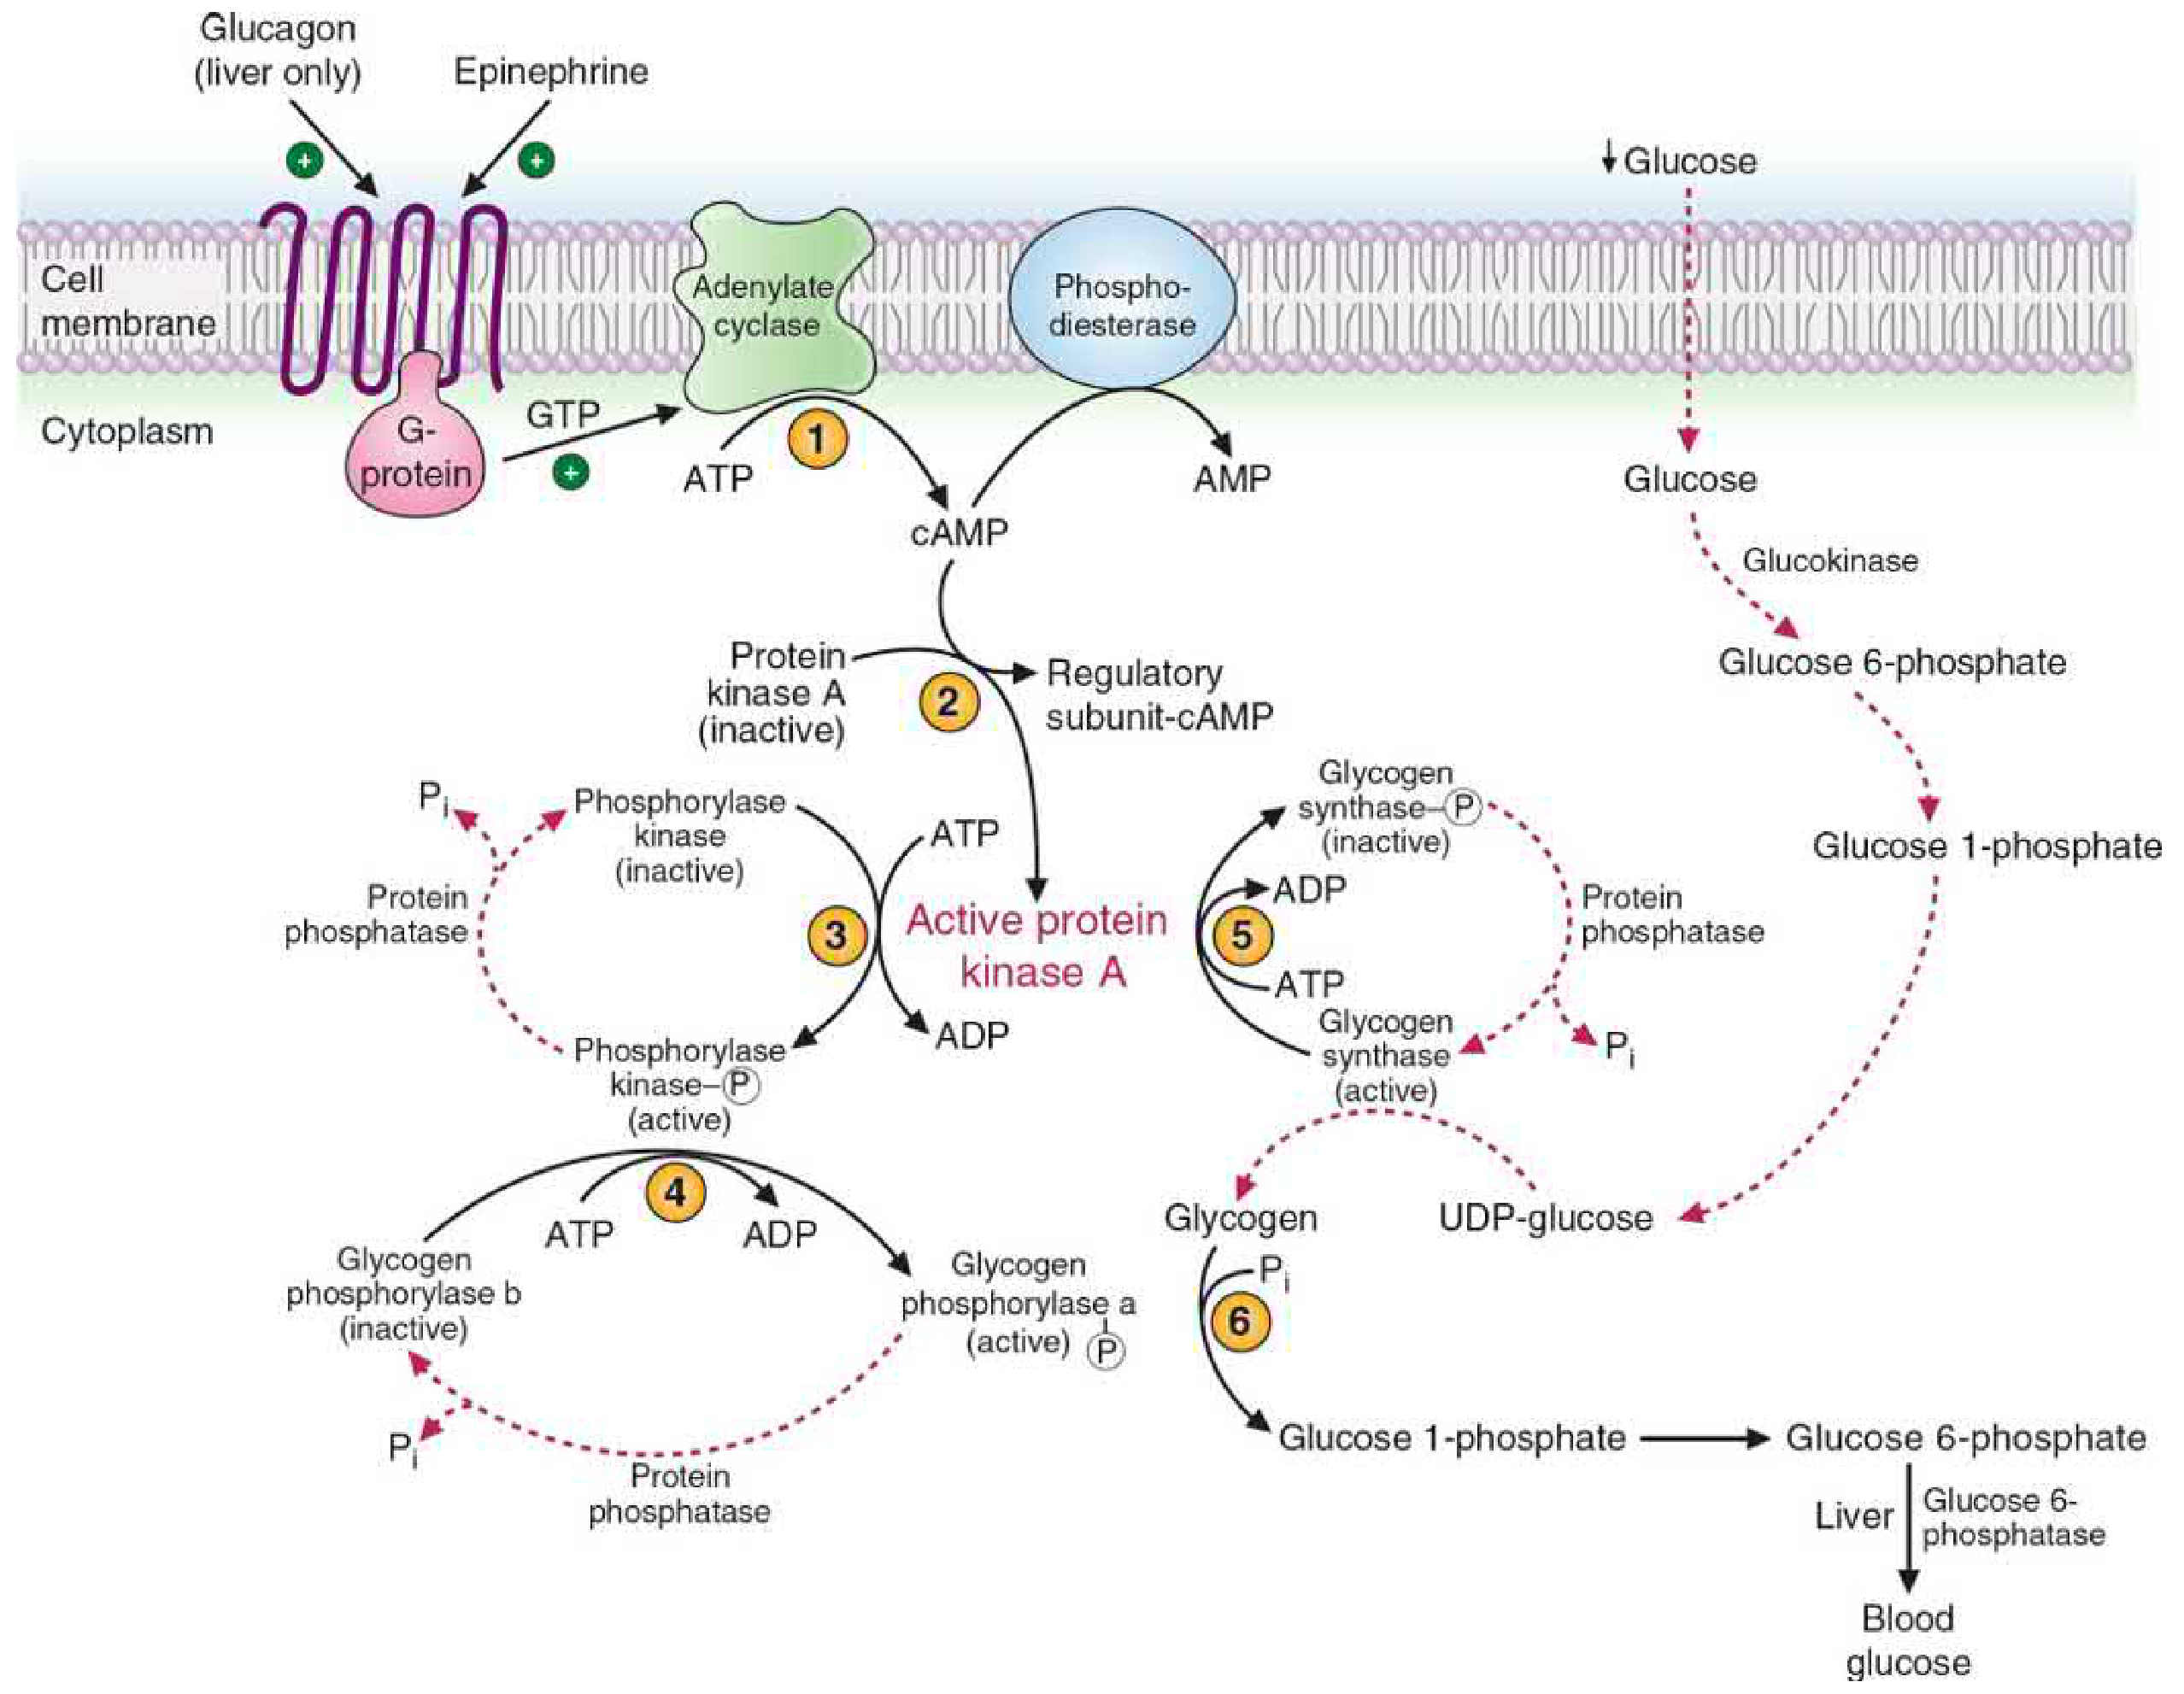
Glucagon/Epinephrine → GPCR → Adenylate cyclase → ↑cAMP
↓
Protein Kinase A (PKA) - activated
↓
Phosphorylase kinase - phosphorylated (inactive → active)
↓
Glycogen phosphorylase b (inactive) → a (active) [phosphorylated at Ser14]
↓
GLYCOGENOLYSIS ACTIVATED
PKA also:
Glycogen synthase a (active) → b (inactive) [phosphorylated → OFF]
↓
GLYCOGENESIS INHIBITED
B. Regulation by Insulin (FED STATE)
- Insulin → activates protein phosphatase 1 (PP1)
- PP1 dephosphorylates glycogen phosphorylase a → inactive phosphorylase b
- PP1 dephosphorylates glycogen synthase b → active glycogen synthase a
- Net: glycogenesis ON, glycogenolysis OFF
- Insulin also activates glucokinase (more G6P available → more UDP-glucose)
C. Allosteric Regulation (Instantaneous)
Glycogen Phosphorylase (Muscle - AMP Activation)
| Allosteric Effector | Effect on Phosphorylase |
|---|---|
| AMP (low energy signal) | Activates phosphorylase b (even without phosphorylation) |
| ATP, G6P | Inhibit phosphorylase b; favor inactive conformation |
| Glucose (liver only) | Inhibits phosphorylase a → promotes dephosphorylation |
| Ca²⁺-calmodulin | Activates phosphorylase kinase during muscle contraction |
- In muscle, AMP accumulation during intense exercise directly activates glycogenolysis even without hormonal signal
- AMP activates phosphorylase b → promotes T-state → R-state conversion (active)
Glycogen Synthase
| Allosteric Effector | Effect on Glycogen Synthase |
|---|---|
| Glucose-6-phosphate | Strongly activates synthase b (even in phosphorylated state) - can override covalent inhibition |
| ATP, UTP | Mild activation |
| AMP, ADP | Inhibitory |
- After a meal: ↑blood glucose → ↑G6P (liver) → allosterically activates glycogen synthase → glycogen synthesis despite phosphorylation
D. Ca²⁺ Regulation (Exercise/Muscle Contraction)
- During muscle contraction: ↑cytosolic Ca²⁺
- Ca²⁺ binds calmodulin subunit of phosphorylase kinase
- Activates phosphorylase kinase even without phosphorylation by PKA
- Rapidly activates glycogen phosphorylase → glucose for contracting muscle
- Coordinates glycogenolysis with muscle contraction (both triggered by same Ca²⁺ signal)
E. Summary Regulation Table
| State | Blood Signal | cAMP | Phosphorylase | Glycogen Synthase | Net Effect |
|---|---|---|---|---|---|
| Fed (post-meal) | ↑Insulin, ↓Glucagon | ↓ | b (inactive) | a (active) | Glycogenesis ↑ |
| Fasting | ↓Insulin, ↑Glucagon | ↑ | a (active) | b (inactive) | Glycogenolysis ↑ |
| Exercise/Stress | ↑Epinephrine, ↑Ca²⁺ | ↑ | a (active) | b (inactive) | Glycogenolysis ↑↑ |
Glycogen Storage Diseases (Key examples)
| Type | Enzyme Defect | Organ | Clinical Features |
|---|---|---|---|
| Type I (Von Gierke) | Glucose-6-phosphatase | Liver | Severe fasting hypoglycemia, hepatomegaly, lactic acidosis, hyperlipidemia |
| Type II (Pompe) | Lysosomal α-glucosidase | All organs | Cardiomegaly, hypotonia; death <2 years (infantile) |
| Type III (Cori) | Debrancher enzyme | Liver, muscle | Fasting hypoglycemia, hepatomegaly; short outer chain glycogen |
| Type IV (Andersen) | Branching enzyme | Liver | Hepatosplenomegaly; abnormal long-chain glycogen; usually fatal |
| Type V (McArdle) | Muscle phosphorylase | Muscle | Exercise-induced cramps, myoglobinuria; no rise in lactate after ischemic exercise |
| Type VI (Hers) | Liver phosphorylase | Liver | Mild hypoglycemia, hepatomegaly; good prognosis |
TOPIC 2: HMP PATHWAY (HEXOSE MONOPHOSPHATE SHUNT / PENTOSE PHOSPHATE PATHWAY)
PART I: OVERVIEW AND DEFINITION
- Generates NADPH (primary reducing agent for biosynthesis and antioxidant defense)
- Produces ribose-5-phosphate (essential for nucleotide/nucleic acid synthesis)
- Does NOT produce or consume ATP directly
- Serves as a link between the glucose pool and the pentose phosphate pool
Especially active in: Liver, lactating mammary glands, adrenal cortex, testes, ovaries, RBCs, adipose tissue
Consists of two phases:
- Oxidative phase (irreversible) - produces NADPH and ribulose-5-phosphate
- Non-oxidative phase (reversible) - interconverts sugar phosphates; can produce ribose-5-phosphate or return carbons to glycolysis
PART II: OXIDATIVE PHASE (IRREVERSIBLE)
Reaction 1: Glucose-6-phosphate → 6-Phosphogluconolactone
Enzyme: Glucose-6-phosphate dehydrogenase (G6PD) G6P + NADP⁺ → 6-Phosphogluconolactone + NADPH + H⁺
- RATE-LIMITING, REGULATED step (committed step)
- Cofactor: NADP⁺ (not NAD⁺ - this is key)
- Inhibited by: NADPH (product inhibition - NADPH/NADP⁺ ratio controls flux)
- Activated by: ↑NADP⁺ (when NADPH is being consumed)
- Induced by: Insulin (in fed state)
- G6PD is X-linked; deficiency is the most common enzymopathy (G6PD deficiency)
- Produces first NADPH
Reaction 2: 6-Phosphogluconolactone → 6-Phosphogluconate
Enzyme: 6-Phosphogluconolactonase (Lactonase) 6-Phosphogluconolactone + H₂O → 6-Phosphogluconate
- Simple hydrolysis; spontaneous but enzyme-accelerated
- No cofactor, no energy change
Reaction 3: 6-Phosphogluconate → Ribulose-5-phosphate + CO₂
Enzyme: 6-Phosphogluconate dehydrogenase 6-Phosphogluconate + NADP⁺ → Ribulose-5-phosphate + CO₂ + NADPH + H⁺
- Oxidative decarboxylation (removes C1 as CO₂)
- Produces second NADPH
- Also irreversible
- Product: Ribulose-5-phosphate (a pentose phosphate)
Net of Oxidative Phase (per G6P):
G6P + 2 NADP⁺ + H₂O → Ribulose-5-P + CO₂ + 2 NADPH + 2H⁺
PART III: NON-OXIDATIVE PHASE (REVERSIBLE)
Initial Isomerizations:
Ribulose-5-phosphate isomerase: Ribulose-5-P → Ribose-5-phosphate (R5P) - used for nucleotide synthesis
Ribulose-5-phosphate 3-epimerase (Phosphopentose epimerase): Ribulose-5-P → Xylulose-5-phosphate (Xu5P)
The Interconversion Reactions:
Transketolase (transfers 2-carbon "ketol" unit; requires Thiamine Pyrophosphate/TPP)
Xylulose-5-P (5C) + Ribose-5-P (5C) → Sedoheptulose-7-P (7C) + Glyceraldehyde-3-P (3C)
Transaldolase (transfers 3-carbon unit; no cofactor needed)
Sedoheptulose-7-P (7C) + Glyceraldehyde-3-P (3C) → Fructose-6-P (6C) + Erythrose-4-P (4C)
Transketolase (second reaction)
Xylulose-5-P (5C) + Erythrose-4-P (4C) → Fructose-6-P (6C) + Glyceraldehyde-3-P (3C)
THE COMPLETE HMP PATHWAY DIAGRAM
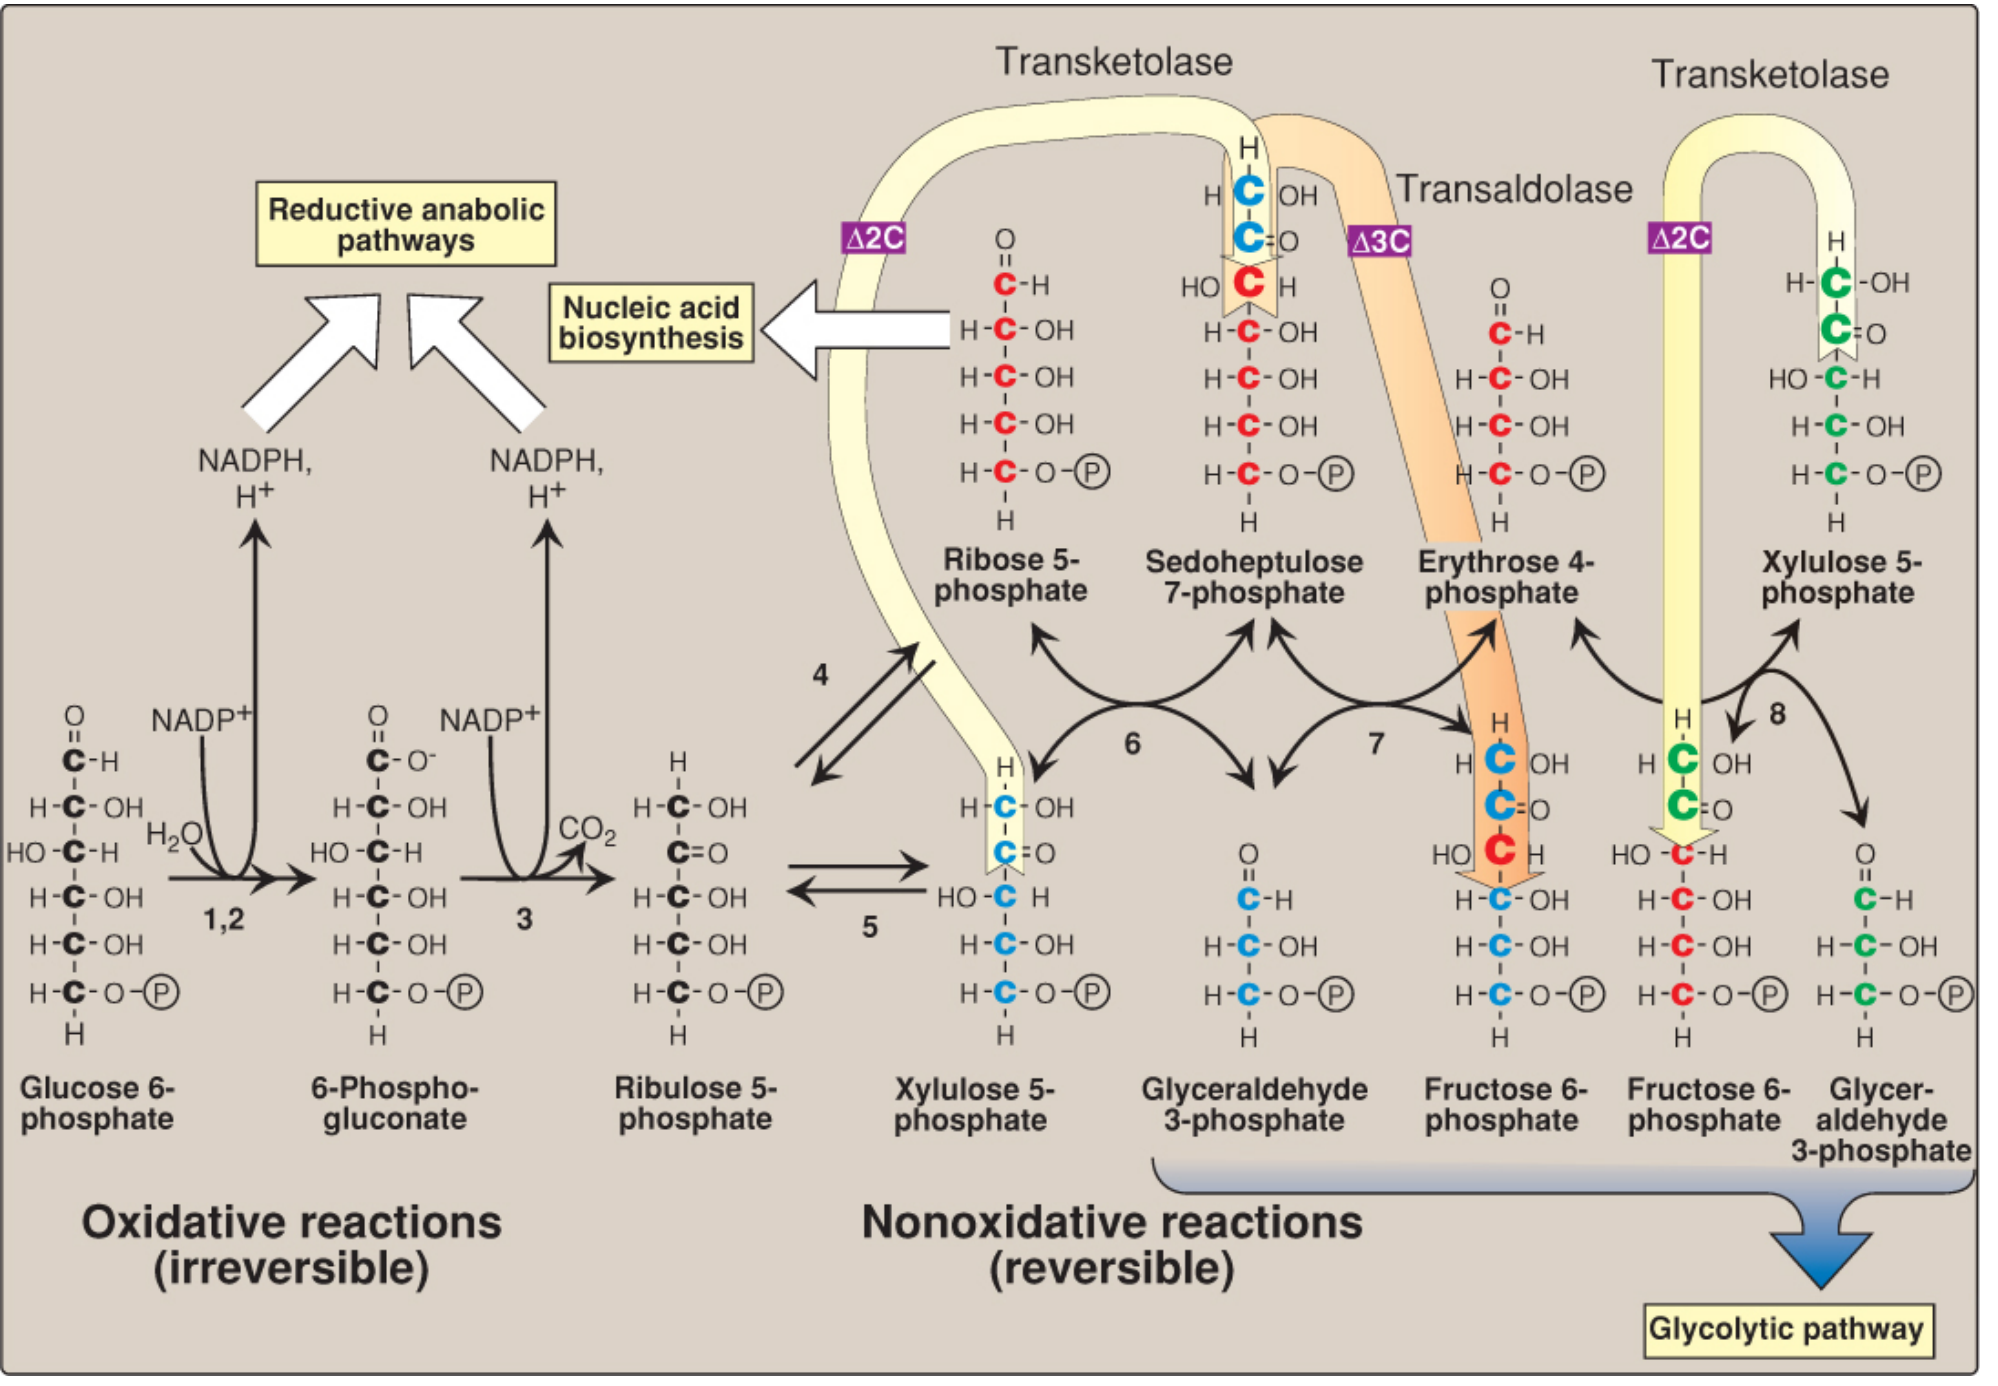
Balanced Equations for Non-Oxidative Phase
6 Ribulose-5-P → 5 Glucose-6-P (via 5 G6P regenerated)
5 G6P → 6 Ribose-5-P (without going through oxidative phase; no NADPH generated)
PART IV: REGULATION OF THE HMP PATHWAY
Primary Regulation: NADPH/NADP⁺ Ratio
| Condition | NADPH/NADP⁺ Ratio | Effect on G6PD | HMP Flux |
|---|---|---|---|
| High NADPH (e.g., resting, no biosynthesis) | High | Inhibited (competitive product inhibition) | Low |
| Low NADPH (e.g., oxidative stress, active biosynthesis) | Low | Activated (disinhibited) | High |
- This is the most important regulatory mechanism - a simple push-pull on G6PD
- The pathway is demand-driven by NADPH consumption
Secondary Regulation
| Regulator | Mechanism | Effect |
|---|---|---|
| Insulin | Induces G6PD gene transcription | ↑ HMP pathway activity in fed state |
| NADP⁺ availability | Substrate for G6PD | Rate increases as NADP⁺ rises |
| G6P availability | Substrate concentration | More G6P → more HMP flux |
| Direction of non-oxidative phase | Reversible reactions; direction determined by demand for ribose-5-P vs. F6P/G3P | Equilibrium adjusts to cellular need |
Transketolase Regulation
- Transketolase requires Thiamine Pyrophosphate (TPP, vitamin B₁) as cofactor
- Thiamine deficiency → impairs non-oxidative phase → ribose-5-phosphate cannot be interconverted to glycolytic intermediates
- Red blood cell transketolase activation test: used to diagnose thiamine deficiency
PART V: SIGNIFICANCE OF THE HMP SHUNT
1. NADPH Production (Most Important)
| Role | Detail |
|---|---|
| Fatty acid synthesis | Fatty acid synthase uses NADPH; 14 NADPH per palmitate |
| Cholesterol and steroid synthesis | Steroidogenesis requires NADPH (CYP450 reactions) |
| Glutathione regeneration | Glutathione reductase: GSSG + NADPH → 2 GSH (critical in RBCs) |
| NADPH oxidase | Phagocytes use NADPH to generate O₂⁻ (superoxide) for bacterial killing ("respiratory burst") |
| Cytochrome P450 reactions | Drug/xenobiotic metabolism in liver microsomes requires NADPH |
| Nitric oxide synthesis | NO synthase uses NADPH |
| Maintenance of RBC integrity | Prevents oxidative hemolysis (see G6PD deficiency below) |
2. Ribose-5-Phosphate Production
- Essential precursor for purine and pyrimidine nucleotide synthesis (ATP, GTP, NAD⁺, FAD, CoA)
- Required for DNA and RNA synthesis (proliferating cells)
- Active in: rapidly dividing cells, liver, bone marrow
3. Interconversion of Sugars
- Non-oxidative phase provides flexibility: pentose ↔ hexose ↔ triose
- Allows fructose-6-P and G3P to be produced from ribose-5-P when biosynthesis exceeds need
- Links HMP to glycolysis
4. G6PD Deficiency - Clinical Significance
- X-linked recessive; affects ~400 million people worldwide
- Most common in malaria-endemic regions (heterozygotes have relative protection against P. falciparum)
Oxidative stress (drugs, infection, fava beans, naphthalene)
↓
↑H₂O₂ and reactive oxygen species (ROS)
↓ Normal: NADPH → GSH → neutralizes H₂O₂
↓ In G6PD deficiency: No NADPH → GSH depleted
↓
Oxidation of hemoglobin → Heinz bodies (precipitated Hb)
↓
Rigid RBCs → splenic trapping → HEMOLYSIS
↓
Hemolytic anemia, jaundice, dark urine (hemoglobinuria)
5. NADPH Oxidase in Phagocytes (Respiratory Burst)
- Phagocytes use NADPH oxidase to generate superoxide (O₂⁻) → kills bacteria
- 2 NADPH + 2 O₂ → 2 NADP⁺ + 2 O₂⁻
- O₂⁻ → H₂O₂ → HOCl (bleach, via myeloperoxidase) → bactericidal
- Chronic Granulomatous Disease (CGD): NADPH oxidase deficiency → recurrent bacterial/fungal infections
COMBINED SUMMARY TABLES
Glycogen Metabolism Summary
| Feature | Glycogenesis | Glycogenolysis |
|---|---|---|
| Direction | Synthesis | Degradation |
| Key enzymes | Glycogen synthase, branching enzyme | Glycogen phosphorylase, debrancher enzyme |
| Activated by | Insulin, glucose-6-phosphate | Glucagon, epinephrine, AMP, Ca²⁺ |
| Inhibited by | Glucagon, cAMP, epinephrine | Insulin, ATP, G6P (muscle), glucose (liver) |
| Rate-limiting enzyme | Glycogen synthase | Glycogen phosphorylase |
| Active form | Dephosphorylated (synthase a/I) | Phosphorylated (phosphorylase a) |
| Energy cost | 2 ATP per glucose added | 0 ATP (phosphorolysis) |
| Products | Glycogen | G1P (→ G6P → glycolysis/blood glucose) |
HMP Shunt Summary
| Feature | Oxidative Phase | Non-Oxidative Phase |
|---|---|---|
| Reversibility | Irreversible | Reversible |
| Key enzyme | G6PD (rate-limiting) | Transketolase, Transaldolase |
| Products | 2 NADPH, Ribulose-5-P, CO₂ | Ribose-5-P, F6P, G3P |
| Cofactors | NADP⁺ | TPP (thiamine) for transketolase |
| Regulated by | NADPH/NADP⁺ ratio; insulin | Demand for ribose-5-P vs. glycolytic intermediates |
| Location | Cytoplasm | Cytoplasm |
| ATP | None produced or consumed | None produced or consumed |
- Basic Medical Biochemistry: A Clinical Approach, 6th Ed. - Chapters 26, 29
- Lippincott's Illustrated Reviews: Biochemistry, 8th Ed. - Chapter 13
- Harper's Illustrated Biochemistry, 32nd Ed. - Chapter 18
Vitamins a c and d Forms sources Absorption (Walds cycle) Rad Deficiency Toxicity Functions
VITAMINS A, C, AND D
MBBS Biochemistry - Complete Answer
═══════════════════════════════
VITAMIN A (RETINOL)
═══════════════════════════════
I. FORMS OF VITAMIN A
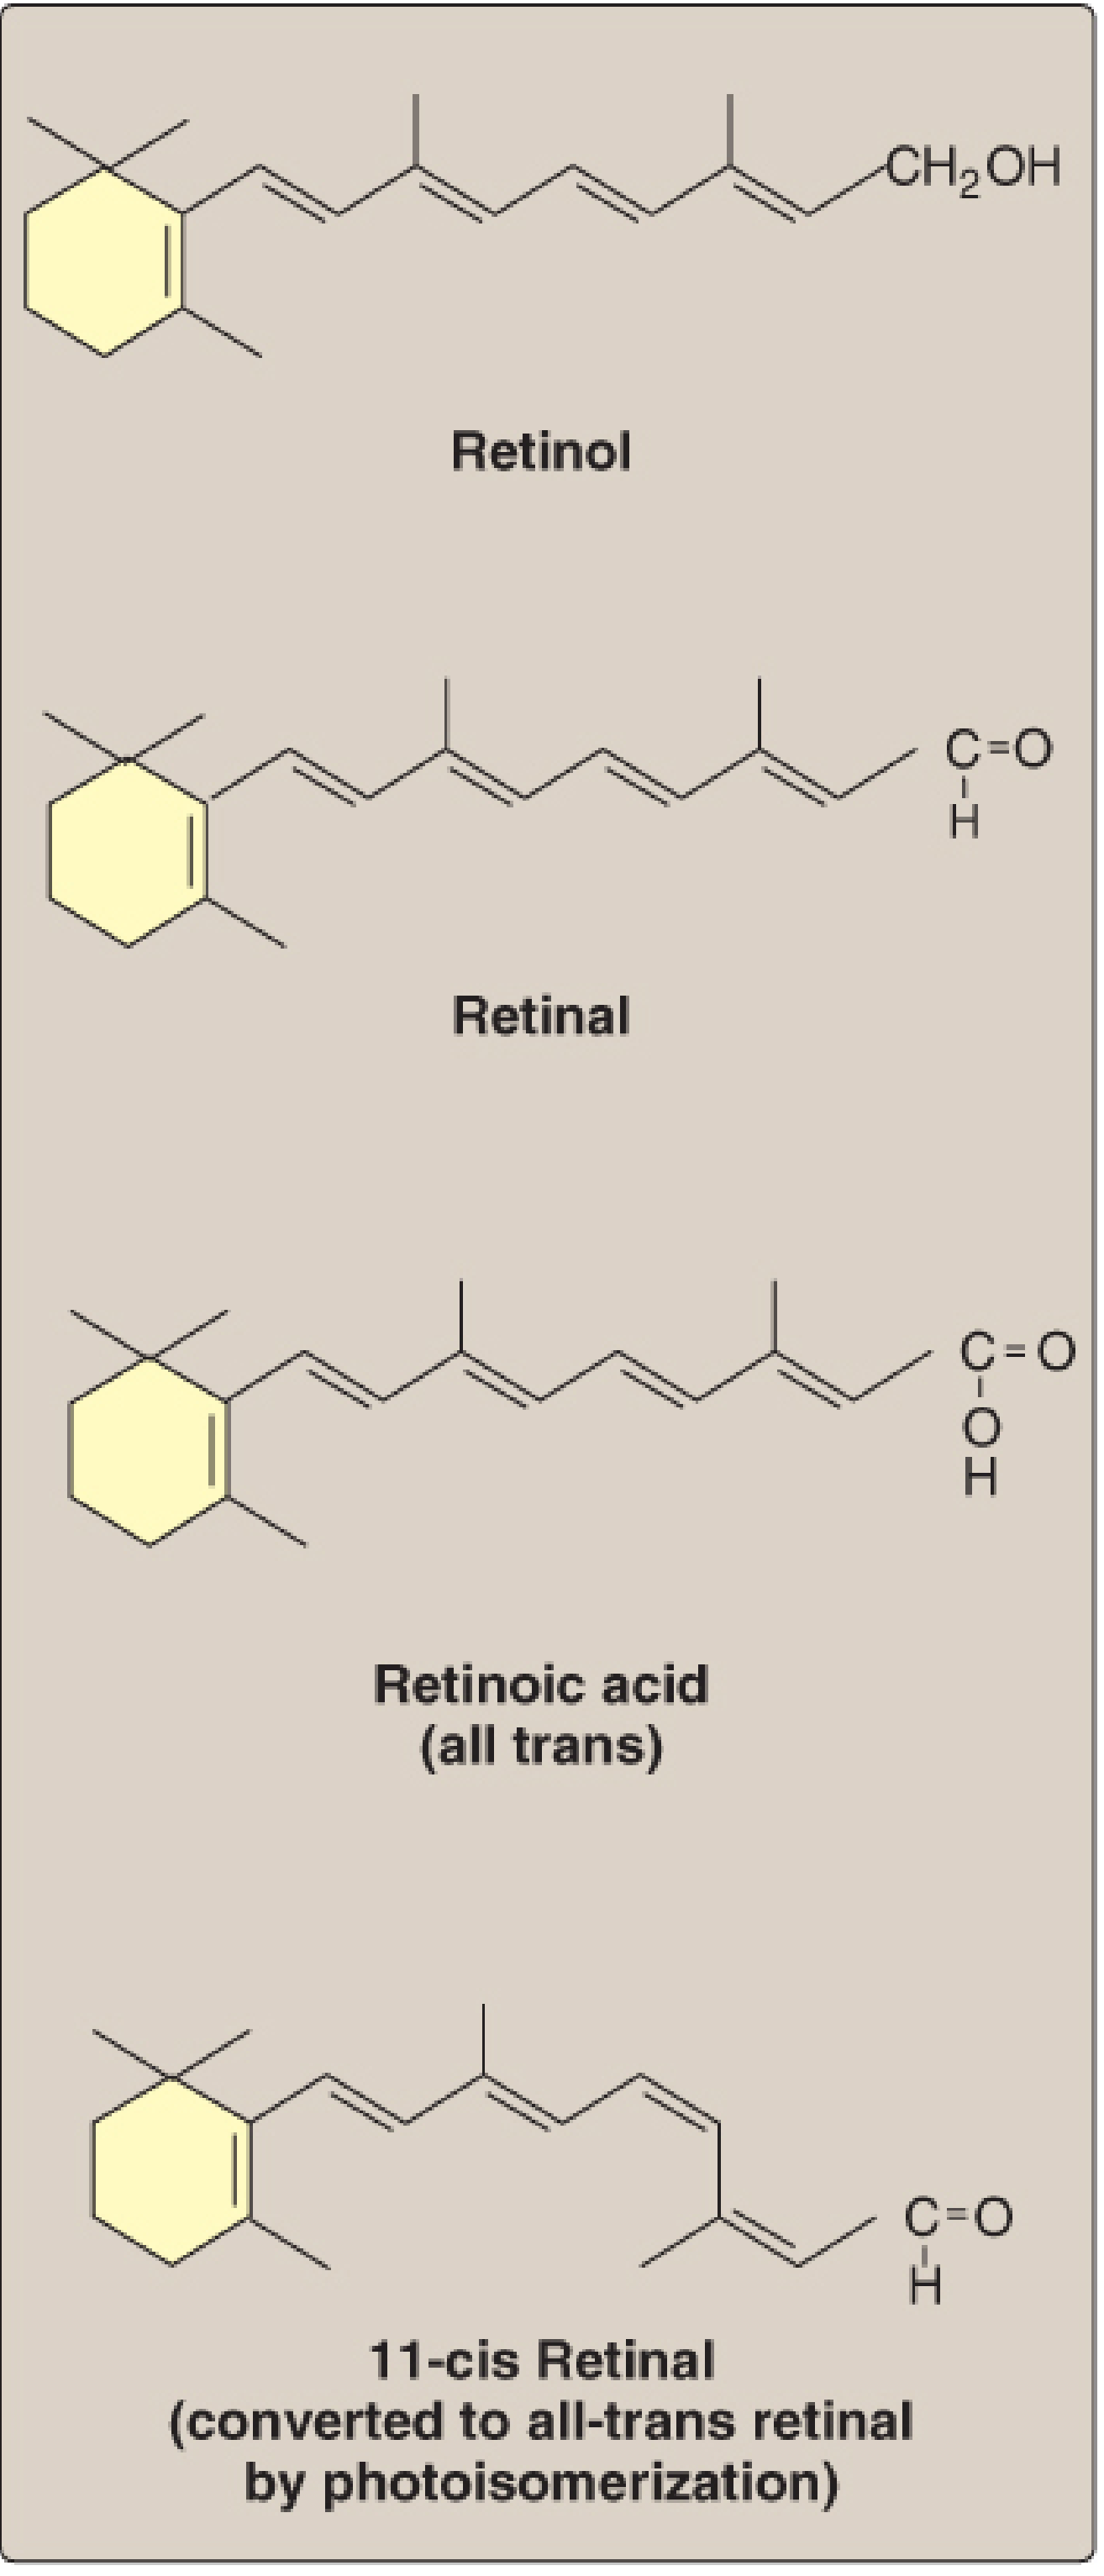
| Form | Chemical Nature | Key Role |
|---|---|---|
| Retinol | Primary alcohol (C20); β-ionone ring + polyene chain | Storage form (as retinyl esters); transport |
| Retinal (Retinaldehyde) | Aldehyde (-CHO); oxidized from retinol | Visual pigment (rhodopsin component); can be reduced back to retinol |
| Retinoic acid | Carboxylic acid (-COOH); oxidized from retinal | Gene regulation, cell differentiation; cannot be reduced back to retinal/retinol |
| 11-cis Retinal | Geometric isomer of retinal | Active visual chromophore in rhodopsin |
| Retinyl esters | Ester of retinol with long-chain FA (palmitate) | Transport in chylomicrons; liver storage form |
| Form | Source | Note |
|---|---|---|
| β-Carotene (most important) | Yellow/orange/dark green vegetables | Cleaved in intestine to 2 retinal; only 1/12 the activity of retinol (inefficient conversion) |
| α-Carotene, β-cryptoxanthin | Various fruits/vegetables | Lower provitamin A activity |
II. SOURCES
| Animal (Preformed/Retinol) | Plant (Provitamin A/Carotenoids) |
|---|---|
| Liver, kidney (richest sources) | Carrots |
| Fish liver oils (cod, halibut) | Sweet potato, pumpkin |
| Egg yolk | Dark leafy greens (spinach, kale) |
| Butter, cream, full-fat milk | Mangoes, papayas |
| Fortified margarine | Yellow/orange fruits and vegetables |
III. ABSORPTION AND TRANSPORT
A. Intestinal Absorption
- Retinyl esters in food are hydrolyzed by retinyl ester hydrolase (pancreatic and brush border) → free retinol + FA
- β-Carotene from plants is cleaved in the enterocyte by β-carotene 15,15'-dioxygenase → 2 molecules of retinal
- Retinal is reduced to retinol in the enterocyte by retinaldehyde reductase (NADPH-dependent)
- Retinol in the enterocyte is re-esterified with long-chain FA (primarily palmitate) by LRAT
- Retinyl esters are packaged into chylomicrons and secreted into lymph (thoracic duct → blood)
B. Hepatic Storage
- Chylomicron remnants (containing retinyl esters) are taken up by liver
- Stored in hepatic stellate cells (Ito cells) as retinyl esters
- Liver is the main storage organ; ~90% of body's vitamin A is in the liver
C. Release and Blood Transport
- Retinol is released from the liver bound to Retinol-Binding Protein (RBP)
- RBP complexes with transthyretin (TTR/prealbumin) to form a ternary complex (Retinol-RBP-TTR)
- TTR prevents filtration by the kidney (RBP alone is too small)
- At target cells: complex binds to membrane receptor → retinol enters cell
- Inside cell: Intracellular Retinol-Binding Protein (CRBP) carries retinol to nucleus
D. Retinoic Acid Mechanism (Genomic Action)
- Retinol → oxidized to retinoic acid inside target cells
- Retinoic acid binds Retinoic Acid Receptors (RARs) in the nucleus
- RAR-retinoic acid complex binds Retinoic Acid Response Elements (RAREs) on DNA
- Regulates transcription → controls synthesis of specific proteins (e.g., keratin, growth factors)
- Acts like a steroid hormone (nuclear receptor superfamily)
IV. WALD'S VISUAL CYCLE (The Visual Cycle)
Components of Rhodopsin
- Opsin: a G protein-coupled receptor (7 transmembrane helices); protein component
- 11-cis Retinal: the chromophore (light-absorbing molecule); prosthetic group
- Together they form Rhodopsin (visual purple) in rod cells
The Cycle:
LIGHT
↓
RHODOPSIN 11-cis retinal + Opsin
(dark adapted) photoisomerization
↓
All-trans retinal + Opsin
(BLEACHING - rhodopsin dissociates)
↓
Activates G-protein TRANSDUCIN (Gt)
↓
Phosphodiesterase activated → ↓cGMP
↓
cGMP-gated Na⁺ channels CLOSE
↓
HYPERPOLARIZATION of rod cell
↓
Nerve impulse → optic nerve → brain
(perception of image)
REGENERATION OF RHODOPSIN:
All-trans retinal
↓ Retinal reductase + NADPH
All-trans retinol (transported to RPE - Retinal Pigment Epithelium)
↓ Retinyl ester formed (LRAT)
All-trans retinyl ester
↓ Isomerase (RPE65 - Retinal Pigment Epithelium enzyme)
11-cis retinol
↓ 11-cis retinol dehydrogenase + NAD⁺
11-cis retinal
↓ returns to rod cell, recombines with opsin
RHODOPSIN (regenerated - dark adaptation)
- Light triggers 11-cis → all-trans isomerization at the C11-C12 double bond
- All-trans retinal dissociates from opsin → "bleaches" the retina
- Regeneration requires RPE (retinal pigment epithelium) and vitamin A
- In night blindness (vitamin A deficiency): insufficient 11-cis retinal → rhodopsin cannot be regenerated → cannot adapt to dim light
- Cone cells use similar cycle with different opsins and color-specific pigments (photopsins)
V. RDA (Recommended Dietary Allowance)
| Group | RDA |
|---|---|
| Adult males | 900 μg RAE/day |
| Adult females | 700 μg RAE/day |
| Pregnant women | 770 μg RAE/day |
| Lactating women | 1,300 μg RAE/day |
| Children (1-8 years) | 300-400 μg RAE/day |
- 1 RAE = 1 μg retinol = 12 μg β-carotene = 24 μg other carotenoids
- Tolerable Upper Intake Level (UL): 3,000 μg RAE/day for adults
VI. DEFICIENCY
Sequence of Deficiency Signs:
- Loss of sensitivity to green light (earliest biochemical sign)
- Night blindness (Nyctalopia) - inability to see in dim light; visual threshold elevated
- Xerophthalmia - dryness of conjunctiva and cornea due to keratinization
- Bitot's spots - triangular grey-white foamy deposits on bulbar conjunctiva (keratinized epithelium)
- Corneal ulceration (keratomalacia) - severe stage; cornea softens and ulcerates
- Corneal scarring and blindness (irreversible)
Other Deficiency Effects:
| System | Effect |
|---|---|
| Skin | Follicular hyperkeratosis ("toad skin" / phrynoderma) - plugging of hair follicles with keratin |
| Immune system | Increased susceptibility to infections; impaired T-cell and B-cell function; vitamin A is essential for differentiation of immune cells |
| Growth | Stunted growth in children |
| Reproduction | Reduced sperm production, fetal abnormalities |
VII. TOXICITY (Hypervitaminosis A)
- Nausea, vomiting
- Headache (↑intracranial pressure)
- Blurred vision
- Skin desquamation
| System | Toxic Effect |
|---|---|
| CNS | Headache, nausea, ataxia, raised intracranial pressure (pseudotumor cerebri), papilledema |
| Liver | Hepatomegaly, hepatotoxicity, hyperlipidemia |
| Bone | Periosteal thickening of long bones, hypercalcemia, calcification of soft tissues |
| Skin | Excessive dryness, desquamation, alopecia (hair loss), brittle nails |
| Teratogenicity | Most serious - retinoic acid is a known teratogen; causes craniofacial, cardiac, and CNS defects; contraindicated in pregnancy |
═══════════════════════════════
VITAMIN C (ASCORBIC ACID)
═══════════════════════════════
I. FORMS OF VITAMIN C
| Form | Nature |
|---|---|
| L-Ascorbic acid | Main active form; strong reducing agent (enediol structure); L-isomer only is biologically active |
| Dehydroascorbic acid | Oxidized form; also biologically active; can be reconverted to ascorbate |
| L-Ascorbate-2-sulfate | Minor form found in tissues |
II. SOURCES
| Rich Sources | Moderate Sources |
|---|---|
| Citrus fruits (oranges, lemons, limes) - 50-80 mg/100g | Potatoes |
| Amla (Indian gooseberry) - 600+ mg/100g (richest natural source) | Tomatoes |
| Guava - 200+ mg/100g | Milk (small amount) |
| Kiwi fruit | Liver |
| Broccoli, Brussels sprouts | |
| Bell peppers (green/red) | |
| Strawberries, blackcurrants |
III. ABSORPTION AND TRANSPORT
- Absorbed in the small intestine (primarily duodenum and jejunum) via sodium-dependent active transport (SVCT1 - Sodium-Vitamin C Co-Transporter)
- At doses < 100 mg: ~almost 100% absorbed
- At doses > 1 g: only ≤ 50% absorbed (saturable transporter - absorption efficiency decreases at high doses)
- Excess: excreted in urine (vitamin C is not stored in large amounts)
- Blood transport: as free ascorbate in plasma
- Intracellular accumulation via SVCT2 (different isoform); WBCs and adrenal glands have highest concentrations
- Increased requirements: smoking, pregnancy, lactation, infection, trauma, hemodialysis
- Reduced absorption: malabsorption syndromes, alcoholism
IV. RDA
| Group | RDA |
|---|---|
| Adult males | 90 mg/day |
| Adult females | 75 mg/day |
| Pregnant women | 85 mg/day |
| Lactating women | 120 mg/day |
| Smokers | +35 mg/day extra (oxidative stress) |
- Tolerable Upper Level (UL): 2,000 mg/day
- Minimum needed to prevent scurvy: ~10 mg/day
- Body pool: ~1,500 mg; clinical scurvy appears when pool falls below ~300 mg
V. FUNCTIONS
1. Collagen Synthesis (Most Important)
- Vitamin C is a coenzyme for prolyl hydroxylase and lysyl hydroxylase
- These enzymes hydroxylate proline → hydroxyproline and lysine → hydroxylysine within procollagen chains
- Hydroxyproline and hydroxylysine are essential for cross-linking of collagen triple helices → stable collagen
- Mechanism: Vitamin C keeps the iron cofactor of prolyl/lysyl hydroxylase in the reduced Fe²⁺ state (prevents oxidation to Fe³⁺, which inactivates the enzyme)
- In deficiency: collagen is unstable → cannot maintain connective tissue integrity → scurvy
2. Antioxidant Function
- Vitamin C is a direct free-radical scavenger
- Donates electrons to quench reactive oxygen species (ROS), superoxide, hydroxyl radical
- Regenerates Vitamin E from tocopheryl radical → synergistic antioxidant system
- Protects LDL from oxidation, cellular membranes, DNA
3. Iron Absorption Enhancement
- Reduces dietary non-heme iron (Fe³⁺ → Fe²⁺) in the intestine
- Fe²⁺ is more soluble and better absorbed via DMT-1 transporter
- Takes at the same time as iron-rich foods → significantly increases iron absorption
- Clinical use: give vitamin C with iron supplements in iron-deficiency anemia
4. Carnitine Biosynthesis
- Required for hydroxylation steps in carnitine synthesis
- Carnitine transports long-chain fatty acids into mitochondria for β-oxidation
- Vitamin C deficiency → ↓carnitine → ↓fatty acid oxidation → fatigue
5. Catecholamine Synthesis
- Dopamine β-hydroxylase requires vitamin C: converts dopamine → norepinephrine (in adrenal medulla)
- Adrenal glands have the highest concentration of vitamin C in the body
6. Tyrosine Catabolism
- Required for activity of 4-hydroxyphenylpyruvate dioxygenase → tyrosine degradation
- Deficiency → tyrosinemia of newborn
7. Drug and Steroid Metabolism
- Component of mixed-function oxidase systems (cytochrome P450) in liver microsomes
- Required for some xenobiotic hydroxylations
8. Immune Function
- Stimulates neutrophil and lymphocyte function
- Promotes production of interferon
- May reduce duration of common cold symptoms (mild effect)
9. Anti-Cancer (Emerging)
- High-dose IV ascorbic acid: pro-oxidant effect selectively toxic to cancer cells
- May work synergistically with gemcitabine, PD-1 inhibitors, radiation
VI. DEFICIENCY - SCURVY
Clinical Features (all due to defective collagen):
| Feature | Mechanism |
|---|---|
| Perifollicular hemorrhages (most characteristic) | Unstable capillary walls (perivascular collagen defect) |
| Spongy, bleeding gums (gingivitis) | Periodontal collagen breakdown |
| Corkscrew/coiled body hairs (pathognomonic) | Abnormal hair follicle structure |
| Poor wound healing | Defective collagen formation |
| Ecchymoses and petechiae | Vascular fragility |
| Hemarthrosis (bleeding into joints) | Synovial collagen defect |
| Generalized fatigue | ↓Carnitine → ↓fatty acid oxidation |
| Anemia | Often combined (Fe/folate deficiency co-existing + ↓Fe absorption) |
| Bone pain in children | Subperiosteal hemorrhage; impaired osteoid formation |
| Scorbutic rosary (children) | Rib-costochondral junction widening |
VII. TOXICITY
- Generally considered safe at usual dietary levels
- Doses > 2 g/day → abdominal pain, diarrhea, nausea (osmotic diarrhea - "bowel tolerance")
- Oxalate kidney stones: Vitamin C → metabolized to oxalate → risk of calcium oxalate stones in predisposed patients (especially those with renal disease or prior kidney stones)
- Iron overload: Theoretical risk of promoting iron absorption to excess in hereditary hemochromatosis
- Rebound scurvy: Abrupt cessation of high-dose supplements → may precipitate scurvy
- Interference with lab tests: High doses may give false-positive glucose (Clinitest) or interfere with stool occult blood tests (Hemoccult)
═══════════════════════════════
VITAMIN D (CALCIFEROL)
═══════════════════════════════
I. FORMS OF VITAMIN D
| Form | Source | Notes |
|---|---|---|
| Vitamin D₃ (Cholecalciferol) | Endogenous synthesis in skin; animal foods | Main form in humans |
| Vitamin D₂ (Ergocalciferol) | Plants, yeast, fungi | Differs by extra double bond and methyl group; metabolized similarly |
| 25-OH-D₃ (Calcidiol) | Liver hydroxylation product | Major circulating and storage form; measured in serum for vitamin D status |
| 1,25-(OH)₂-D₃ (Calcitriol) | Kidney hydroxylation product | Biologically active hormonal form (1000× more potent than D₃) |
| 24,25-(OH)₂-D₃ | Kidney (alternative hydroxylation) | Relatively inactive metabolite; degradation pathway |
| 7-Dehydrocholesterol | Skin precursor | Provitamin D₃ (photolytically converted to previtamin D₃) |
II. SOURCES
Endogenous Synthesis (Major Source in most humans)
- 7-Dehydrocholesterol (intermediate of cholesterol synthesis, accumulates in dermis/epidermis) is converted by UV-B light (280-315 nm) to Previtamin D₃ → thermally isomerizes to Cholecalciferol (D₃)
- Absorbed into bloodstream bound to Vitamin D-Binding Protein (DBP)
- In temperate climates: plasma vitamin D peaks at end of summer, lowest at end of winter
- Beyond latitude 40°N or 40°S: insufficient UV-B in winter for adequate synthesis
Dietary Sources
| Good Sources | Notes |
|---|---|
| Oily fish (salmon, mackerel, herring, sardines) | 200-500 IU/100g |
| Fish liver oil (cod liver oil) | Richest source: ~1360 IU/tsp |
| Egg yolk | ~40 IU/egg |
| Fortified foods (milk, cereal, margarine) | Primary dietary source in many countries |
| Mushrooms (UV-exposed) | Vitamin D₂; modest amount |
| Liver | Small amount |
III. ACTIVATION (Wald's Cycle equivalent = VITAMIN D METABOLISM/HYDROXYLATION)
Two-Step Activation Pathway:
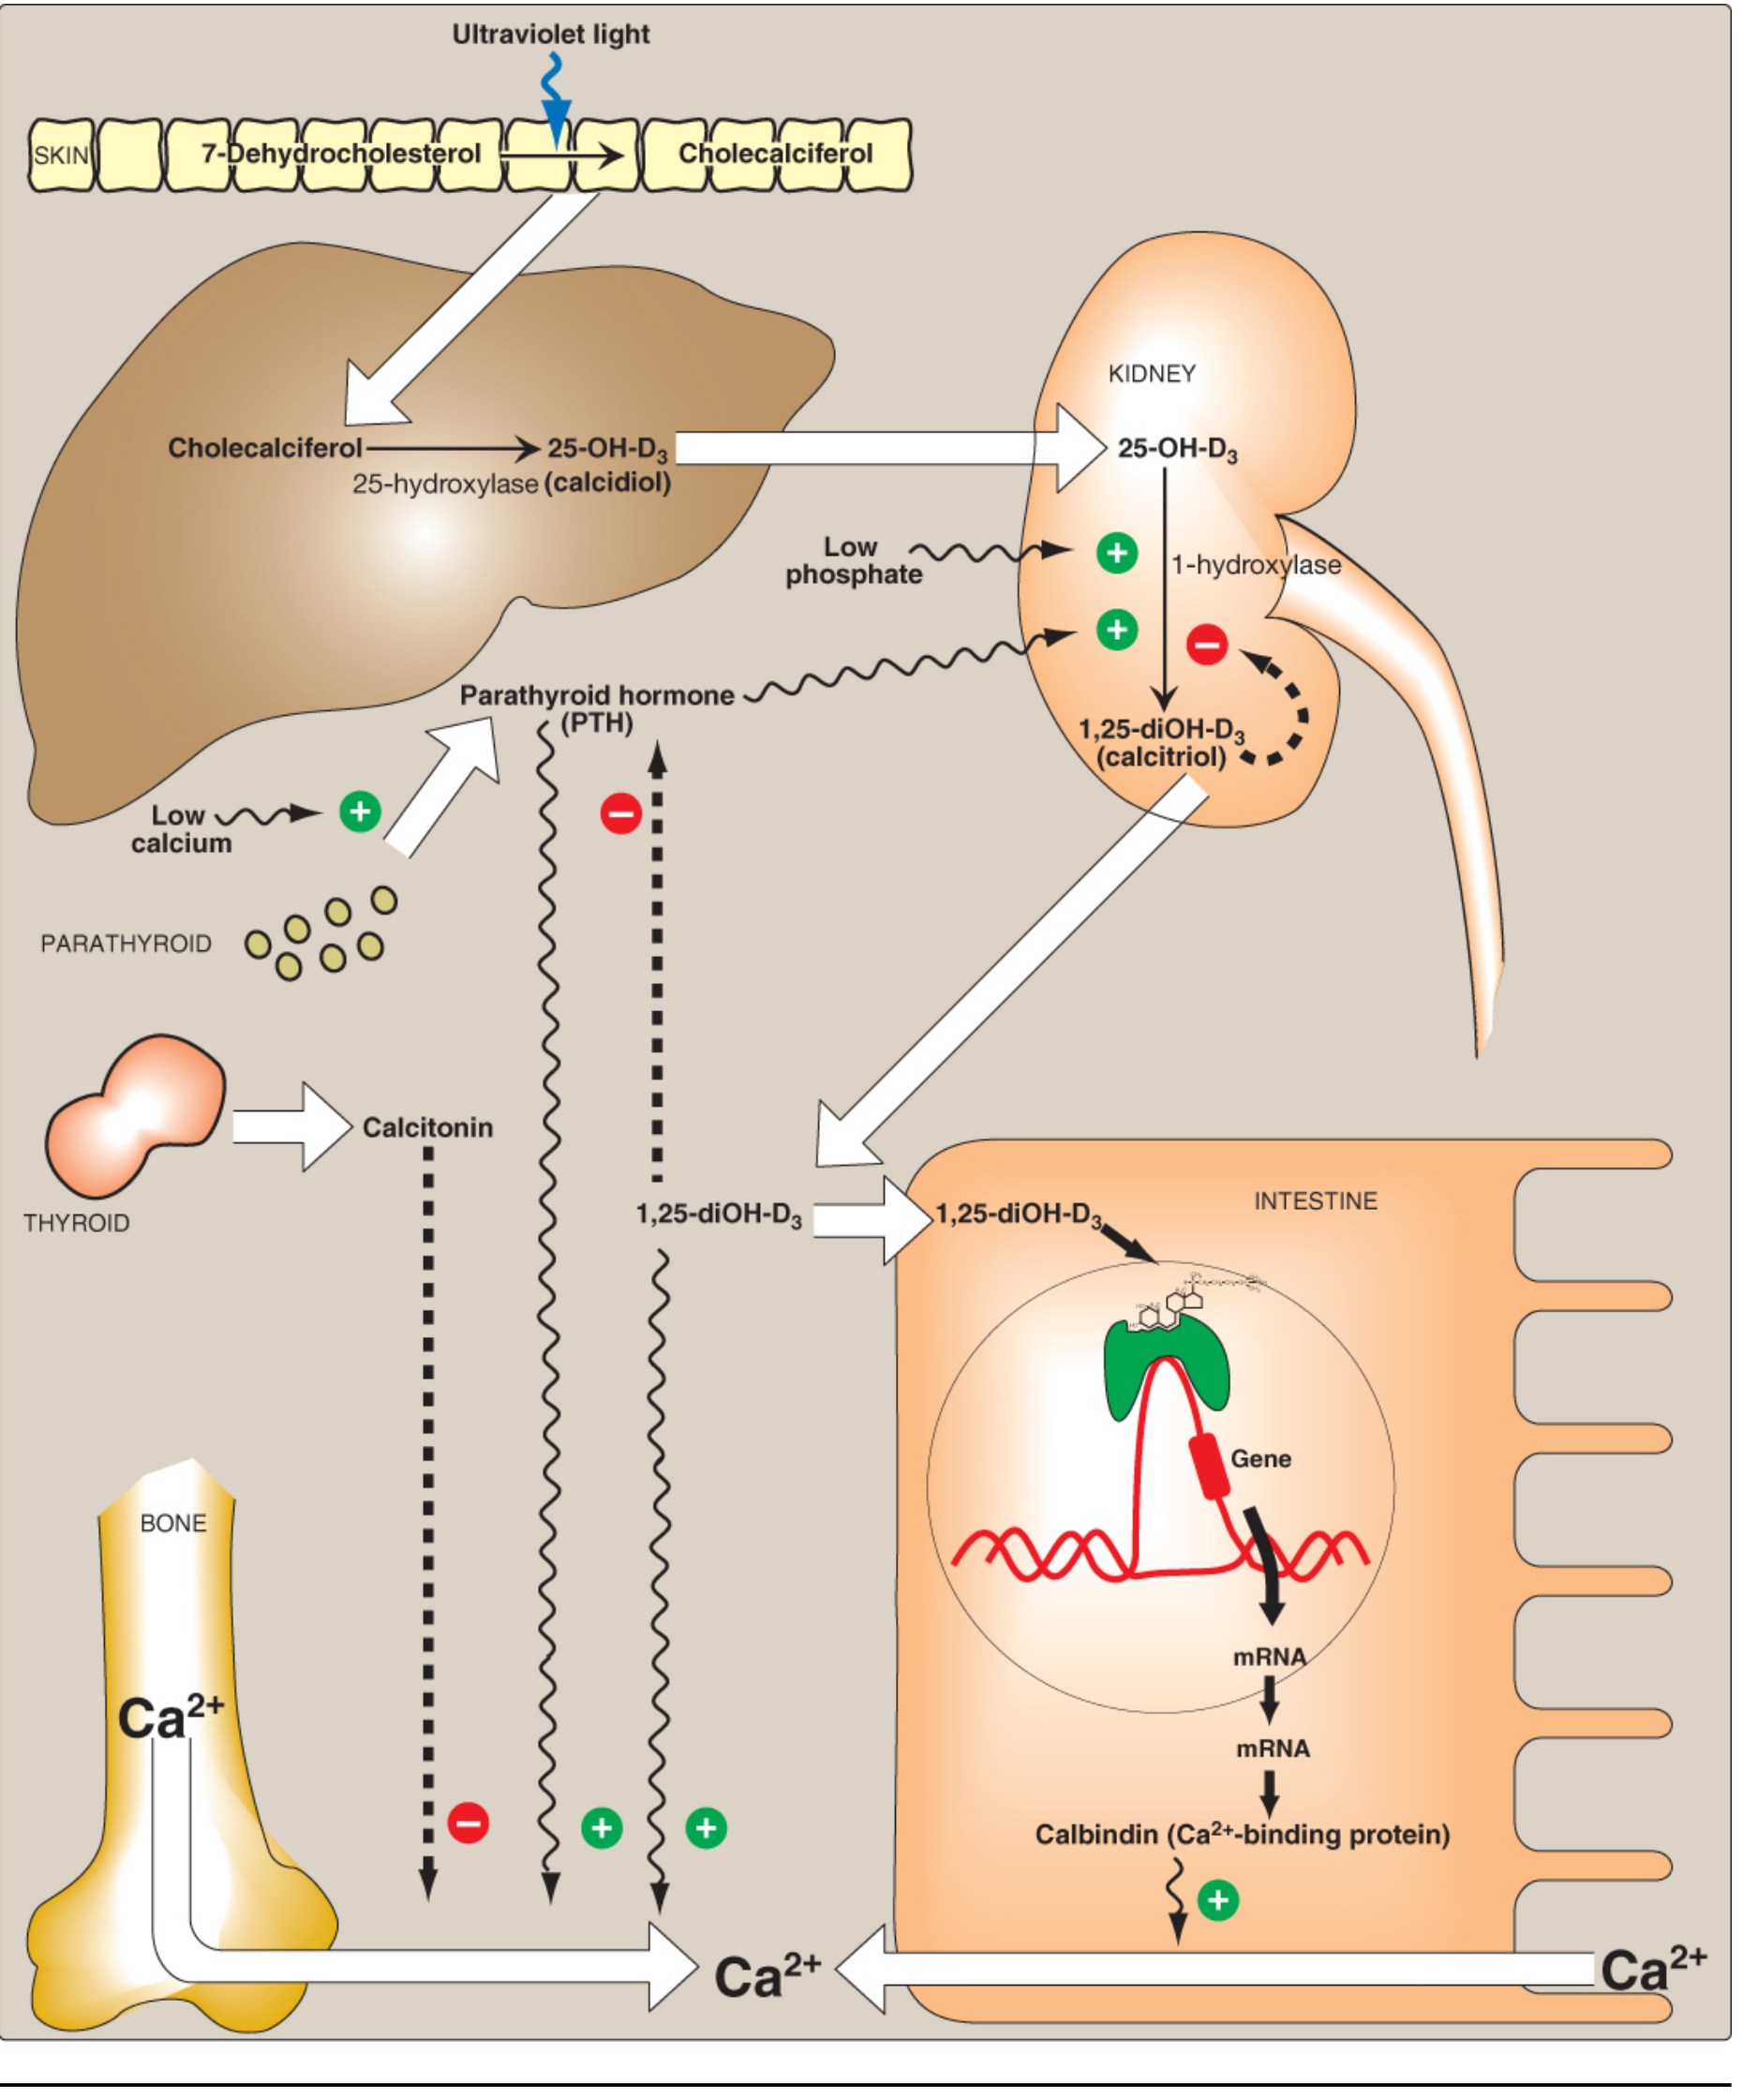
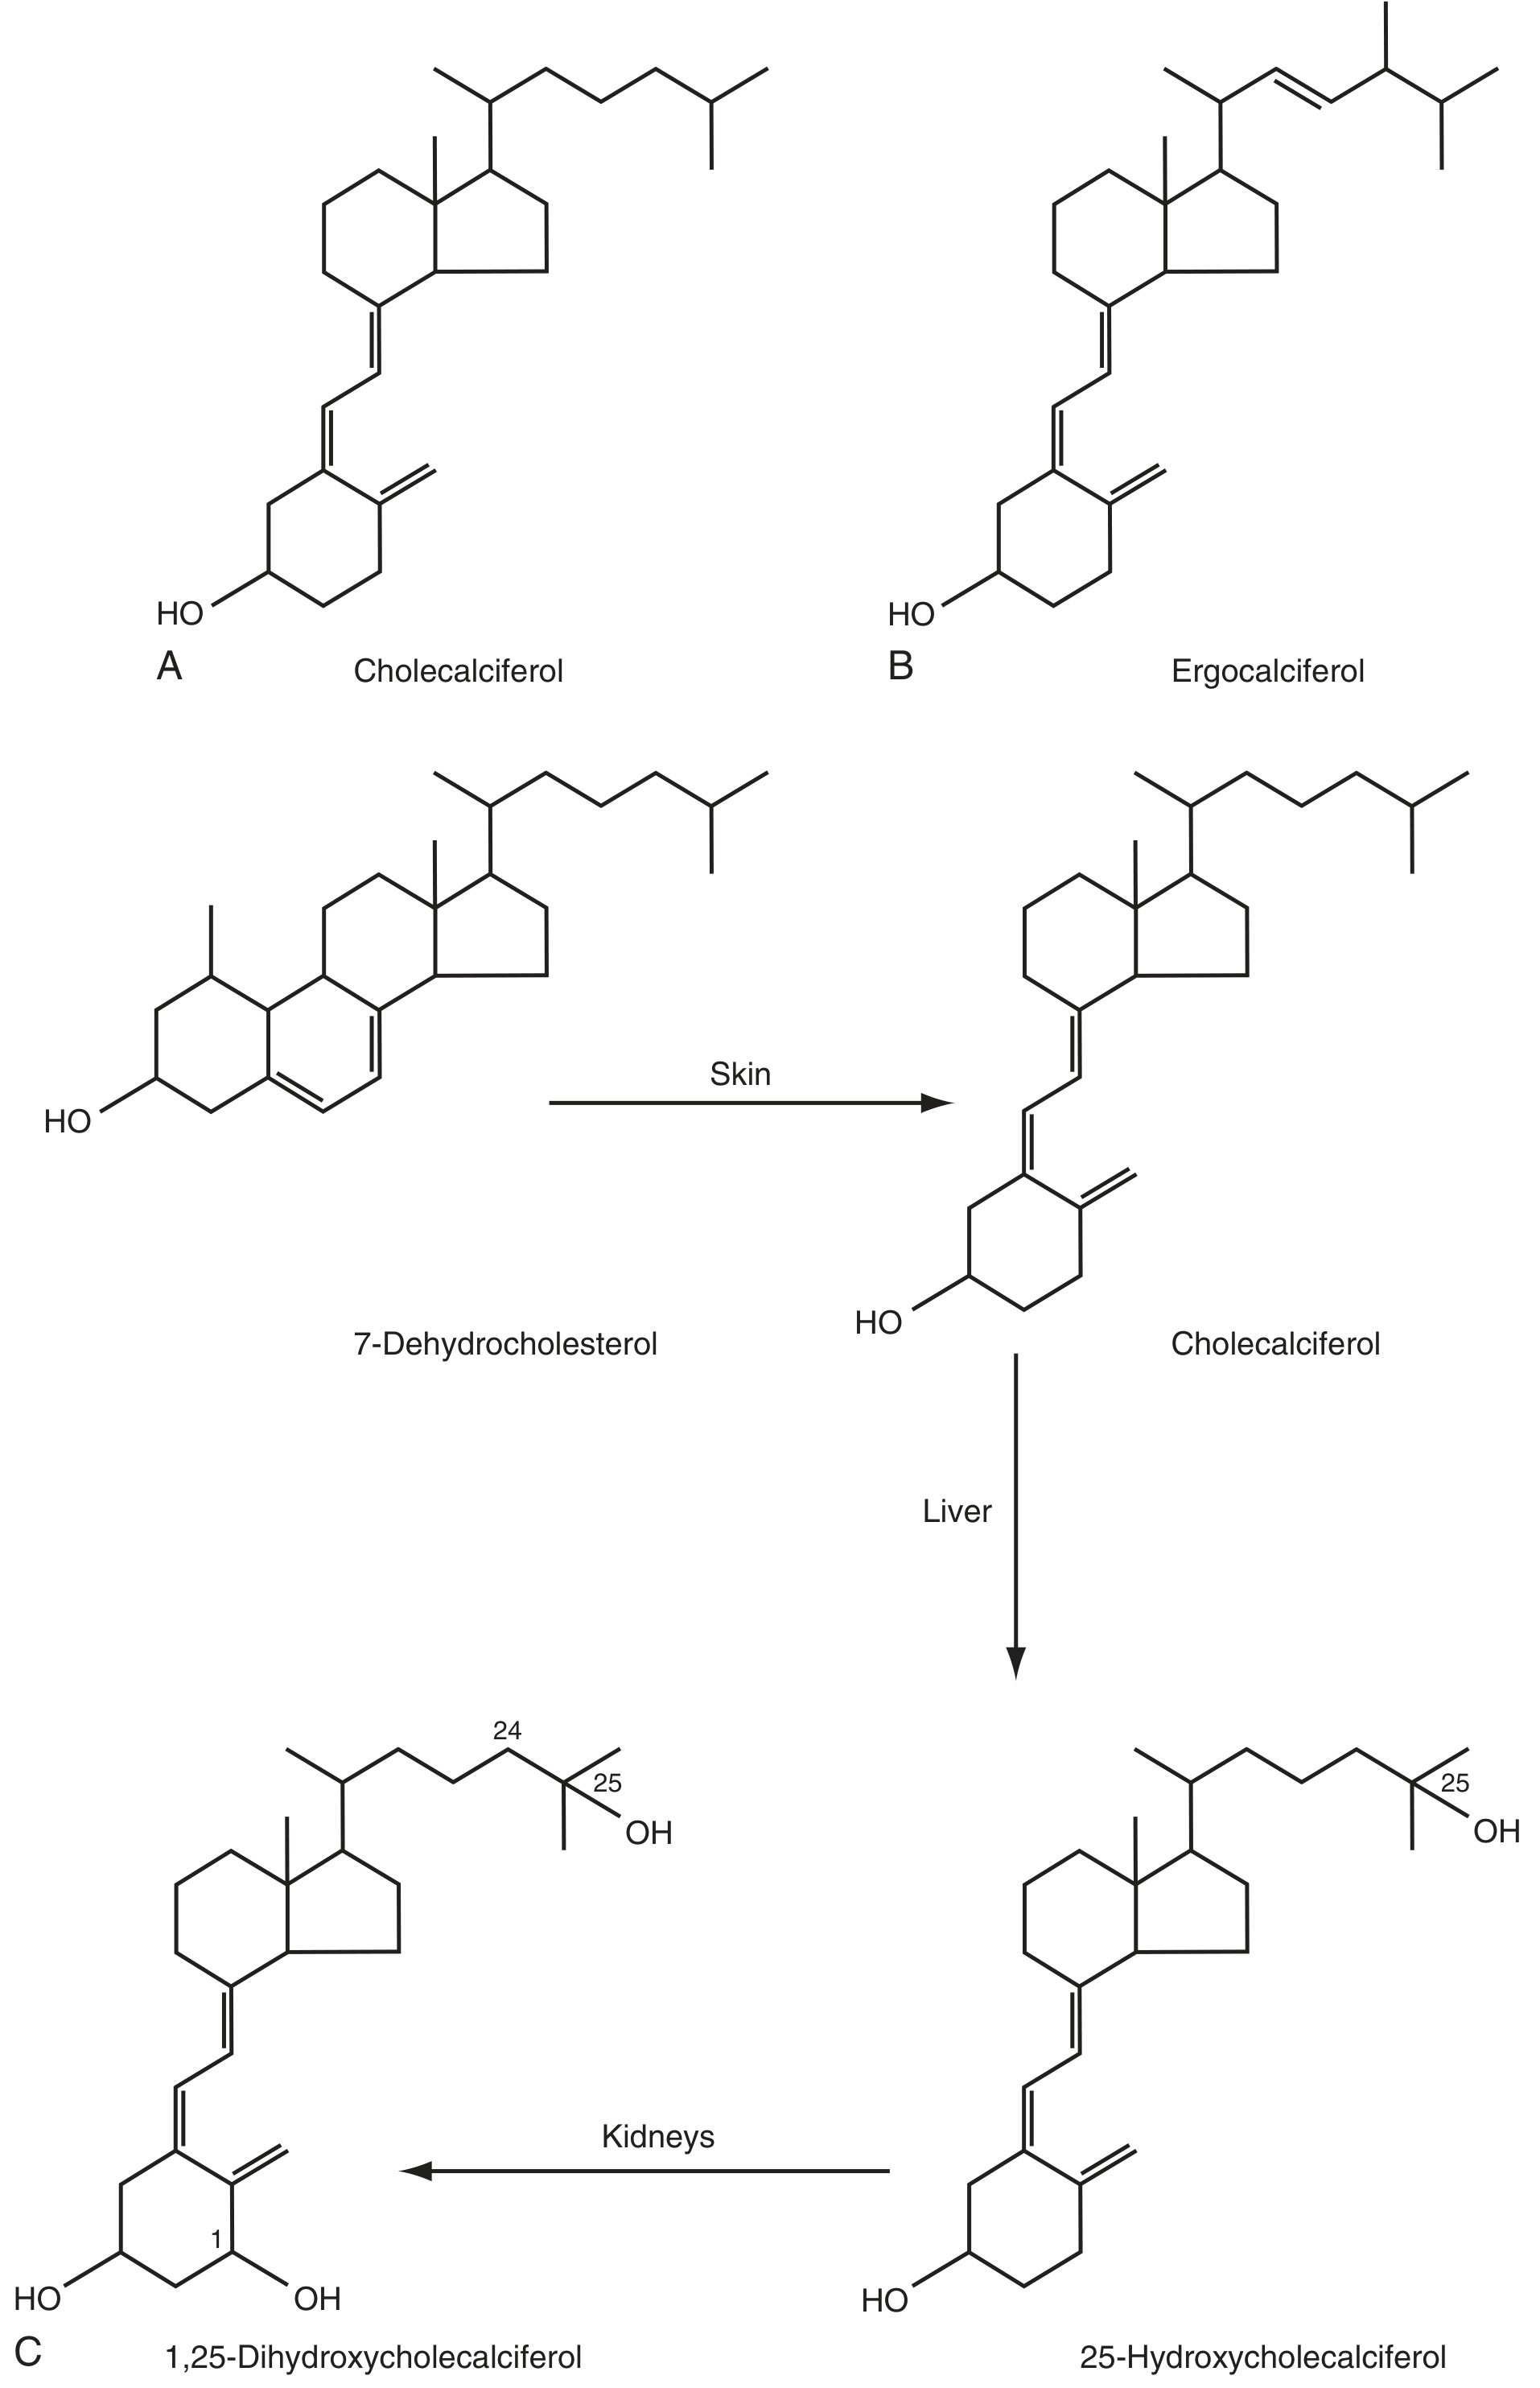
Step-by-Step:
- Relatively unregulated step
- This is the major circulating/storage form (measured for vitamin D status in blood; normal: 50-125 nmol/L or 20-50 ng/mL)
- Bound to vitamin D-binding protein (DBP) in plasma
- Tightly regulated (key control point)
- OR: 25-OH-D₃ → 24,25-(OH)₂-D₃ (inactive; degradation) by 24-hydroxylase (CYP24A1)
Regulation of 1α-Hydroxylase:
| Activators (↑ Calcitriol production) | Inhibitors (↓ Calcitriol production) |
|---|---|
| PTH (when serum Ca²⁺ is low) | Calcitriol itself (negative feedback; induces 24-hydroxylase) |
| Low serum phosphate (directly) | High serum Ca²⁺ (↓PTH → ↓1-hydroxylase) |
| Low serum calcium (via PTH) | FGF-23 (from bone; phosphaturic hormone) |
| Estrogen, prolactin, growth hormone | High calcitriol (represses 1-hydroxylase gene) |
IV. RDA
| Group | RDA | Upper Limit (UL) |
|---|---|---|
| Children 1-13 years | 600 IU (15 μg)/day | 2,500-4,000 IU/day |
| Adults 19-70 years | 600 IU (15 μg)/day | 4,000 IU (100 μg)/day |
| Adults > 70 years | 800 IU (20 μg)/day | 4,000 IU/day |
| Pregnant/Lactating | 600 IU/day | 4,000 IU/day |
- Deficient: < 50 nmol/L (< 20 ng/mL)
- Insufficient: 50-75 nmol/L
- Sufficient: > 75 nmol/L (> 30 ng/mL)
- Toxic: > 375 nmol/L (> 150 ng/mL)
V. FUNCTIONS
1. Calcium Homeostasis (Primary Function)
- Calcitriol enters intestinal enterocyte → binds nuclear Vitamin D Receptor (VDR)
- VDR-calcitriol complex → binds VDRE on DNA → induces transcription of:
- Calbindin D (calcium-binding protein) - major calcium transport protein
- TRPV6 (apical calcium channel)
- PMCA1b (basolateral calcium pump)
- Net: ↑active Ca²⁺ absorption from duodenum and jejunum (up to 30-40% of intake vs 10-15% without vitamin D)
- Calcitriol induces calbindin D₂₈k in distal tubule → ↑ calcium reabsorption
- Works synergistically with PTH
- Calcitriol acts on osteoblasts → induces RANKL → activates osteoclasts
- Osteoclasts resorb bone → release Ca²⁺ and PO₄³⁻ into blood
- (Paradoxically, vitamin D is needed for bone formation; it ensures adequate serum Ca²⁺ for mineralization)
2. Phosphate Homeostasis
- Increases intestinal phosphate absorption (via sodium-phosphate cotransporter Npt2b)
- Increases renal phosphate reabsorption
3. Gene Regulation and Cell Differentiation
- VDR is a nuclear receptor found in >30 tissues
- Calcitriol regulates >1,000 genes
- Anti-proliferative / pro-differentiation effects in many tissues
- Used therapeutically in psoriasis (induces keratinocyte differentiation)
4. Immune Function
- Regulates T-lymphocyte and B-lymphocyte function
- Promotes differentiation of monocyte precursors
- Inhibits production of interleukins by activated T cells → anti-inflammatory
- Deficiency associated with ↑risk of autoimmune diseases (MS, T1DM, IBD)
5. Endocrine Effects
- Regulates insulin secretion from pancreatic β-cells
- Involved in parathyroid and thyroid hormone synthesis and secretion
- Deficiency linked to metabolic syndrome, insulin resistance, obesity
VI. DEFICIENCY
In Children: RICKETS
| Feature | Detail |
|---|---|
| Craniotabes | Soft, ping-pong ball-like skull (early sign in infants) |
| Frontal bossing | Prominent forehead |
| Rachitic rosary | Beaded appearance at costochondral junctions (enlarged cartilage) |
| Harrison's sulcus | Horizontal groove along lower chest margin (diaphragm pull on soft ribs) |
| Pigeon chest (pectus carinatum) | Anterior protrusion of sternum |
| Bowing of legs (genu varum) | Weight-bearing on soft bones |
| Knock knees (genu valgum) | Alternative deformity pattern |
| Delayed dentition and dental caries | Defective tooth enamel |
| Hypocalcemic tetany/convulsions | In severe cases |
| Pot belly | Abdominal distension |
| Widening of wrists and ankles | Metaphyseal expansion |
| Delayed closure of anterior fontanelle | Soft skull bones |
In Adults: OSTEOMALACIA
- Demineralization of already formed bone (bone matrix present but unmineralized)
- Bone pain and tenderness (diffuse, especially pelvis, lower back, legs)
- Proximal muscle weakness (myopathy) - very common
- Waddling gait
- Pathological fractures (low-trauma fractures)
- Looser zones (pseudofractures) on X-ray: radiolucent bands perpendicular to bone cortex
- Biochemistry: ↓Ca²⁺, ↓PO₄³⁻, ↑ALP, ↑PTH, ↓25-OH-D₃
High-Risk Groups for Vitamin D Deficiency:
- Premature infants (stores only transferred in last trimester)
- Dark-skinned individuals (melanin blocks UV-B)
- Elderly (↓7-dehydrocholesterol in skin; less outdoor exposure)
- People with malabsorption (celiac, Crohn's, short bowel syndrome)
- Patients on anticonvulsants (accelerated vitamin D catabolism)
- Chronic kidney disease (↓1-hydroxylase activity → cannot make calcitriol)
- Persons with limited sun exposure (veiled women, housebound, night workers)
- Obese individuals (vitamin D sequestered in fat)
VII. TOXICITY (Hypervitaminosis D)
- Vitamin D is the most toxic of all fat-soluble vitamins (low therapeutic index)
- Toxicity ONLY occurs with supplements (excess sun exposure converts excess D₃ to inactive forms in skin - self-regulating)
- Toxic dose: chronic > 100 μg/day (4,000 IU) in adults; some infants sensitive at 50 μg/day
| Feature | Mechanism |
|---|---|
| Anorexia, nausea, vomiting, constipation | Direct GI effects of hypercalcemia |
| Polyuria, polydipsia | Nephrogenic diabetes insipidus (Ca²⁺ inhibits ADH action) |
| Nephrocalcinosis / Renal calculi | Ca²⁺ deposits in kidney |
| Metastatic calcification of soft tissues | Calcium deposits in vessels, lungs, heart, joints |
| Hypertension (vasoconstriction) | Elevated Ca²⁺ → vascular smooth muscle contraction |
| Weakness, lethargy, confusion | Neuromuscular effects of hypercalcemia |
| Cardiac arrhythmias | Shortened QT interval |
COMPARATIVE SUMMARY TABLE
| Feature | Vitamin A | Vitamin C | Vitamin D |
|---|---|---|---|
| Type | Fat-soluble | Water-soluble | Fat-soluble (pro-hormone) |
| Active form | Retinol, Retinal, Retinoic acid | L-Ascorbic acid | 1,25-(OH)₂-D₃ (Calcitriol) |
| Provitamin | β-Carotene (plants) | None | 7-Dehydrocholesterol (skin) |
| RDA | 700-900 μg RAE | 75-90 mg | 600-800 IU (15-20 μg) |
| Primary function | Vision, gene regulation, differentiation | Antioxidant, collagen hydroxylation | Calcium homeostasis |
| Key enzyme | Retinal reductase, RPE65 (visual cycle) | Prolyl/Lysyl hydroxylase (collagen) | 25-hydroxylase (liver), 1α-hydroxylase (kidney) |
| Deficiency disease | Night blindness → Xerophthalmia | Scurvy | Rickets (children), Osteomalacia (adults) |
| Deficiency sign | Bitot's spots, follicular hyperkeratosis | Perifollicular hemorrhage, bleeding gums, corkscrew hairs | Rachitic rosary, bow legs, Harrison's sulcus |
| Toxicity | Teratogen, liver damage, ↑ICP, alopecia | Kidney stones (oxalate), diarrhea | Hypercalcemia, metastatic calcification |
| Storage | Liver (stellate cells) | Minimal (water-soluble) | Liver and fat (as 25-OH-D₃) |
| Carrier protein | RBP + transthyretin | Dissolved in plasma | Vitamin D-Binding Protein (DBP) |
| Mechanism of action | Nuclear RAR receptors (like steroid) | Enzyme cofactor (reductant) | Nuclear VDR receptors (like steroid) |
- Lippincott's Illustrated Reviews: Biochemistry, 8th Ed. - Chapter 28
- Harper's Illustrated Biochemistry, 32nd Ed. - Chapter 44
- Harrison's Principles of Internal Medicine, 22nd Ed. - Chapter on Vitamins
- Tietz Textbook of Laboratory Medicine, 7th Ed. - Chapter 46
Describe metabolism of ca Sources rda functions regulation of plasma calcium factors effecting it hypo and hyper calcium Describe iron metabolism Source daily requirements absorption and transport functions factors affecting it deficiency overload(primary and secondary)
TOPIC 1: CALCIUM METABOLISM
PART I: DEFINITION AND BODY DISTRIBUTION
| Compartment | Amount | % of Total |
|---|---|---|
| Bone and teeth | ~1,000 g | 99% |
| Intracellular | ~9 g | ~0.9% |
| Extracellular fluid (ECF) | ~1 g | ~0.1% |
| Fraction | % of Total | Notes |
|---|---|---|
| Ionized (free) Ca²⁺ | ~50% | Biologically active; tightly regulated |
| Protein-bound (albumin ~80%, globulins) | ~40% | Not filtered by kidney; not biologically active |
| Complexed (citrate, phosphate, bicarbonate) | ~10% | Diffusible but not ionized |
PART II: SOURCES AND RDA
Dietary Sources
| Source | Ca content |
|---|---|
| Milk (full fat, 200 mL) | ~240 mg |
| Cheese | 700-1200 mg/100g |
| Yogurt | ~200 mg/100g |
| Paneer (Indian cottage cheese) | ~480 mg/100g |
| Dark green vegetables (broccoli, kale) | 100-200 mg/100g |
| Fish with edible bones (sardines) | ~350 mg/100g |
| Fortified foods (milk, cereals, orange juice) | Variable |
| Ragi (finger millet) | ~344 mg/100g - excellent plant source |
| Sesame seeds (til) | ~975 mg/100g |
| Almonds | ~264 mg/100g |
RDA
| Group | RDA |
|---|---|
| Children 1-3 years | 700 mg/day |
| Children 4-8 years | 1,000 mg/day |
| Adolescents 9-18 years | 1,300 mg/day (peak bone mass formation) |
| Adults 19-50 years | 1,000 mg/day |
| Adults >51 years (women), >71 (men) | 1,200 mg/day |
| Pregnant/Lactating | 1,000-1,300 mg/day |
| Tolerable Upper Limit | 2,500 mg/day |
PART III: FUNCTIONS OF CALCIUM
| Function | Mechanism |
|---|---|
| Bone and teeth mineralization | Hydroxyapatite [Ca₁₀(PO₄)₆(OH)₂] crystal deposition in osteoid matrix; gives rigidity |
| Neuromuscular excitability | Ca²⁺ regulates threshold potential; low Ca → tetany; high Ca → depressed excitability |
| Muscle contraction | Ca²⁺ binds troponin-C → unmasks actin-myosin binding sites → contraction |
| Blood coagulation | Required for multiple clotting factors (II, VII, IX, X activation); bridges factors to platelet membrane phospholipids via Gla residues |
| Enzyme activation | Cofactor for many enzymes (ATPases, lipases, phospholipases, proteases) |
| Cell signaling (second messenger) | Intracellular Ca²⁺ rise triggers exocytosis, enzyme activation, gene expression |
| Membrane permeability | Stabilizes nerve membrane; membrane potential regulation |
| Cardiac function | Action potential plateau (Ca²⁺ channels); EC coupling in heart |
| Hormone secretion | Triggers exocytosis from endocrine cells (insulin, catecholamines) |
| Cell division | Required at multiple points in cell cycle |
PART IV: ABSORPTION OF CALCIUM
Two Mechanisms:
- Luminal entry via TRPV6 (transient receptor potential vanilloid 6) channel
- Inside cell: bound to calbindin D9k (Ca-binding protein) - prevents toxic free Ca²⁺ - ferried across cytoplasm
- Exit at basolateral membrane via PMCA1b (Ca²⁺-ATPase; primary) and NCX1 (Na⁺/Ca²⁺ exchanger)
- Calbindin and TRPV6/PMCA are induced by calcitriol (1,25-(OH)₂-D₃)
- Diffusion through tight junctions down electrochemical gradient
- Concentration-dependent; not regulated
PART V: REGULATION OF PLASMA CALCIUM
- Intestine (absorption)
- Bone (reservoir - largest)
- Kidney (excretion and conservation)
HORMONE 1: Parathyroid Hormone (PTH)
Produced by: Chief cells of 4 parathyroid glands
Stimulus for secretion: ↓ Ionized Ca²⁺ (sensed by Calcium-Sensing Receptor, CaSR)
Inhibited by: ↑ Ca²⁺, 1,25-(OH)₂-D₃ (negative feedback), FGF-23
| Target | Action | Mechanism |
|---|---|---|
| Bone | ↑ Osteoclast activity → bone resorption → releases Ca²⁺ + PO₄³⁻ | PTH stimulates RANKL on osteoblasts → activates osteoclasts |
| Kidney (distal tubule) | ↑ Ca²⁺ reabsorption | Upregulates TRPV5, NCX1, calbindin in DCT |
| Kidney (proximal tubule) | ↑ Phosphate excretion (phosphaturia) | Reduces Npt2a, Npt2c expression; prevents calcium-phosphate precipitation |
| Kidney (proximal tubule) | ↑ 1α-hydroxylase → ↑ calcitriol synthesis | Indirect intestinal Ca²⁺ absorption increase |
HORMONE 2: Calcitriol (1,25-(OH)₂-D₃ / Active Vitamin D)
| Target | Action |
|---|---|
| Intestine | ↑↑ Ca²⁺ absorption (major action); ↑ PO₄³⁻ absorption |
| Bone | Mild bone resorption (↑RANKL); more importantly, ensures adequate Ca²⁺/PO₄³⁻ for mineralization |
| Kidney | ↑ Ca²⁺ and PO₄³⁻ reabsorption |
| Parathyroid gland | ↓ PTH synthesis (negative feedback) |
- ↑ Made when: ↓Ca²⁺, ↓PO₄³⁻, ↑PTH
- ↓ Made when: ↑Ca²⁺, ↑PO₄³⁻, ↑calcitriol itself (induces 24-hydroxylase → inactive 24,25 metabolite)
HORMONE 3: Calcitonin
Stimulus: ↑ Ca²⁺ (also gastrin, CCK)
Actions (lowers plasma Ca²⁺):
- Bone: ↓ Osteoclast activity → ↓ bone resorption (direct inhibition of osteoclasts)
- Kidney: ↑ Ca²⁺ excretion + ↑ PO₄³⁻ excretion
Summary: Calcium Homeostasis Response
LOW PLASMA Ca²⁺
↓
CaSR → PTH released
↓
BONE: osteoclast activation → Ca²⁺ + PO₄³⁻ released
KIDNEY: ↑Ca²⁺ reabsorption, ↑phosphaturia, ↑1α-hydroxylase
↓
↑ Calcitriol → ↑ intestinal Ca²⁺ absorption
↓
PLASMA Ca²⁺ RESTORED
↓
↑Ca²⁺ → CaSR → ↓PTH (negative feedback)
↑Ca²⁺ → ↑Calcitonin → ↓osteoclasts
HIGH PLASMA Ca²⁺
↓
↑Calcitonin, ↓PTH, ↓calcitriol
→ ↓bone resorption, ↑renal Ca²⁺ excretion, ↓intestinal absorption
PART VI: FACTORS AFFECTING PLASMA CALCIUM
Factors Increasing Plasma Calcium:
| Factor | Mechanism |
|---|---|
| PTH excess (hyperparathyroidism) | ↑ Bone resorption, ↑renal Ca²⁺ reabsorption, ↑calcitriol |
| Vitamin D excess/toxicity | ↑ Intestinal and renal Ca²⁺ absorption |
| Malignancy | PTHrP (parathyroid hormone-related peptide) acts on PTH1R; direct bone metastasis; some tumors make 1,25-OH-D₂ |
| Immobilization | Uncouples bone formation from resorption → net resorption |
| Milk-alkali syndrome | Excess Ca²⁺ + alkali intake |
| Thiazide diuretics | ↑ Distal tubular Ca²⁺ reabsorption |
| Sarcoidosis/granulomas | Macrophages produce 1,25-(OH)₂-D₃ from 25-OH-D₃ without negative feedback |
| Acidosis | Displaces Ca²⁺ from protein binding (↑ ionized Ca²⁺) |
| Paget's disease | Increased bone turnover |
Factors Decreasing Plasma Calcium:
| Factor | Mechanism |
|---|---|
| Hypoparathyroidism (post-thyroidectomy, autoimmune) | ↓ PTH → ↓ bone resorption, ↓ calcitriol, ↑ renal Ca²⁺ loss |
| Vitamin D deficiency | ↓ Intestinal Ca²⁺ absorption |
| Malabsorption (celiac, Crohn's) | ↓ Ca²⁺ absorption |
| Hypoalbuminemia | ↓ Total Ca²⁺ (ionized Ca²⁺ normal) |
| Alkalosis | ↑ Ca²⁺ binding to albumin → ↓ ionized Ca²⁺ |
| Hyperphosphatemia (renal failure) | Ca²⁺ × PO₄³⁻ product precipitation; ↓ 1α-hydroxylase |
| Pancreatitis | Saponification of fat by lipases sequesters Ca²⁺ as calcium soaps |
| Acute rhabdomyolysis | Ca²⁺ deposits in injured muscle |
| Magnesium deficiency | Impairs PTH secretion and action |
| Loop diuretics (furosemide) | ↑ Renal Ca²⁺ excretion |
| Bisphosphonates, calcitonin | ↓ Bone resorption |
| Excessive oxalate/phytate intake | Binds Ca²⁺ in gut, forming insoluble salts → ↓ absorption |
PART VII: HYPOCALCEMIA
Causes:
- Hypoparathyroidism (most common: post-surgical after thyroidectomy/parathyroidectomy)
- Pseudohypoparathyroidism (PTH resistant tissues; PTH high, Ca low - Albright's hereditary osteodystrophy)
- Vitamin D deficiency (rickets, osteomalacia)
- Hypomagnesemia
- Chronic kidney disease (↓1α-hydroxylase, hyperphosphatemia)
- Acute pancreatitis
- Malabsorption
- Hyperphosphatemia
Clinical Features:
| Feature | Description |
|---|---|
| Tetany | Spontaneous repetitive muscle contractions (hallmark) |
| Chvostek's sign | Facial muscle twitch on tapping facial nerve anterior to ear |
| Trousseau's sign | Carpal spasm with blood pressure cuff inflated above systolic for 3 minutes (carpopedal spasm) |
| Carpopedal spasm | "Accoucheur's hand" - flexion of wrist and MCP joints, extension of PIP/DIP |
| Perioral numbness and paresthesias | Tingling around mouth and fingertips |
| Laryngospasm | Life-threatening; can cause stridor |
| Seizures | In severe/prolonged hypocalcemia |
| Prolonged QT interval | ECG finding (risk of torsades de pointes) |
| Papilledema | Raised intracranial pressure |
| Cataract | Chronic hypocalcemia |
| Basal ganglia calcification | Chronic hypoparathyroidism (Fahr's disease) |
| Psychiatric | Depression, anxiety, cognitive impairment |
Biochemistry:
| Parameter | Hypocalcemia due to Hypoparathyroidism | Due to Vit D deficiency |
|---|---|---|
| Ca²⁺ | ↓ | ↓ |
| PO₄³⁻ | ↑ | ↓ |
| PTH | ↓ (or absent) | ↑↑ (secondary hyperPTH) |
| ALP | Normal | ↑ |
| 25-OH-D₃ | Normal | ↓↓ |
Treatment:
- Acute (symptomatic/severe): IV calcium gluconate 10% (1-2 ampoules slowly)
- Chronic: Oral calcium + vitamin D (calcitriol in hypoparathyroidism, as 1-hydroxylase is absent)
- Magnesium replacement if hypomagnesaemia present
PART VIII: HYPERCALCEMIA
Causes:
| Cause | Frequency | Key Feature |
|---|---|---|
| Primary hyperparathyroidism | ~50-55% | Asymptomatic in most; ↑PTH, ↑Ca, ↓PO₄; single adenoma in 80% |
| Malignancy | ~35% | PTHrP, direct bone metastasis, 1,25-D production in lymphoma |
- Vitamin D intoxication
- Sarcoidosis and granulomatous diseases (↑ macrophage 1α-hydroxylase without feedback)
- Thiazide diuretics
- Immobilization
- Milk-alkali syndrome
- Hyperthyroidism (rapid bone turnover)
- Adrenal insufficiency
- Paget's disease (immobilization phase)
Clinical Features (remember "Bones, Stones, Groans, Psychic Moans, Fatigue Overtones"):
| System | Features |
|---|---|
| Bones ("Bones") | Bone pain, pathological fractures, osteitis fibrosa cystica (severe PTH excess), subperiosteal erosions |
| Renal ("Stones") | Nephrolithiasis (calcium oxalate/phosphate), nephrocalcinosis, polyuria, polydipsia (nephrogenic DI), renal failure |
| GI ("Groans") | Nausea, vomiting, constipation, anorexia, peptic ulcer disease (↑ gastric acid secretion), pancreatitis |
| CNS ("Psychic Moans") | Depression, anxiety, cognitive impairment, confusion, stupor, coma (severe) |
| Cardiac ("Fatigue") | Shortened QT interval (opposite of hypocalcemia), hypertension, bradycardia, cardiac arrest (severe) |
| Soft tissue ("Overtones") | Metastatic calcification (kidneys, vessels, cornea, skin) |
Biochemistry of Primary Hyperparathyroidism:
- ↑ Total and ionized Ca²⁺
- ↓ PO₄³⁻ (PTH-induced phosphaturia)
- ↑↑ PTH (intact PTH assay - second or third generation immunometric assay)
- ↑ ALP (bone turnover)
- ↑ Urinary Ca²⁺ and cAMP
- ↑ 1,25-(OH)₂-D₃
Management of Hypercalcemia:
| Treatment | Mechanism | Notes |
|---|---|---|
| IV saline rehydration | ↑ GFR → ↑ Ca²⁺ excretion | First-line; most patients are volume-depleted |
| Loop diuretics (furosemide) | ↑ Renal Ca²⁺ excretion | Only after adequate rehydration |
| Bisphosphonates (zoledronate, pamidronate) | Inhibit osteoclast bone resorption | Onset 1-2 days; effects last weeks |
| Calcitonin | ↓ Bone resorption, ↑ renal Ca²⁺ excretion | Rapid but short-lived action |
| Denosumab | Anti-RANKL antibody → ↓ osteoclasts | Potent; used in bisphosphonate-refractory |
| Glucocorticoids | Reduce 1,25-D production; ↓ GI absorption | Used specifically for vitamin D toxicity, sarcoidosis, lymphoma |
| Dialysis | Removes Ca²⁺ directly | Life-threatening cases with renal failure |
| Parathyroidectomy | Removes source of excess PTH | Definitive treatment for primary hyperPTH |
TOPIC 2: IRON METABOLISM
PART I: OVERVIEW
- Fe²⁺ (ferrous) - reduced; soluble; absorbed; transported across membranes
- Fe³⁺ (ferric) - oxidized; insoluble; requires reduction for absorption; form bound to transferrin
PART II: SOURCES AND DAILY REQUIREMENTS
Dietary Forms:
| Form | Sources | Absorption |
|---|---|---|
| Heme iron (Fe²⁺ in heme ring) | Red meat, organ meat (liver), fish, poultry | ~20-25% absorbed; efficient; not affected by dietary factors |
| Non-heme iron (Fe³⁺; inorganic) | Vegetables, legumes, cereals, eggs, dairy | ~1-10% absorbed; highly affected by dietary factors |
Dietary Sources:
| Source | Iron content |
|---|---|
| Liver | 6-10 mg/100g |
| Red meat | 2-4 mg/100g |
| Leafy vegetables (spinach, fenugreek) | 2-4 mg/100g |
| Legumes (lentils, rajma, chana) | 3-7 mg/100g |
| Ragi (finger millet) | 3.9 mg/100g |
| Jaggery (gud) | 11 mg/100g |
| Amla | ~1.2 mg/100g + promotes Fe absorption (vit C) |
Daily Requirements:
| Group | RDA |
|---|---|
| Adult males | 8 mg/day |
| Adult females (premenopausal) | 18 mg/day (menstrual losses) |
| Pregnant women | 27 mg/day |
| Adolescents (males 14-18) | 11 mg/day |
| Adolescents (females 14-18) | 15 mg/day |
| Post-menopausal women | 8 mg/day |
PART III: ABSORPTION AND TRANSPORT
Iron Absorption Diagram
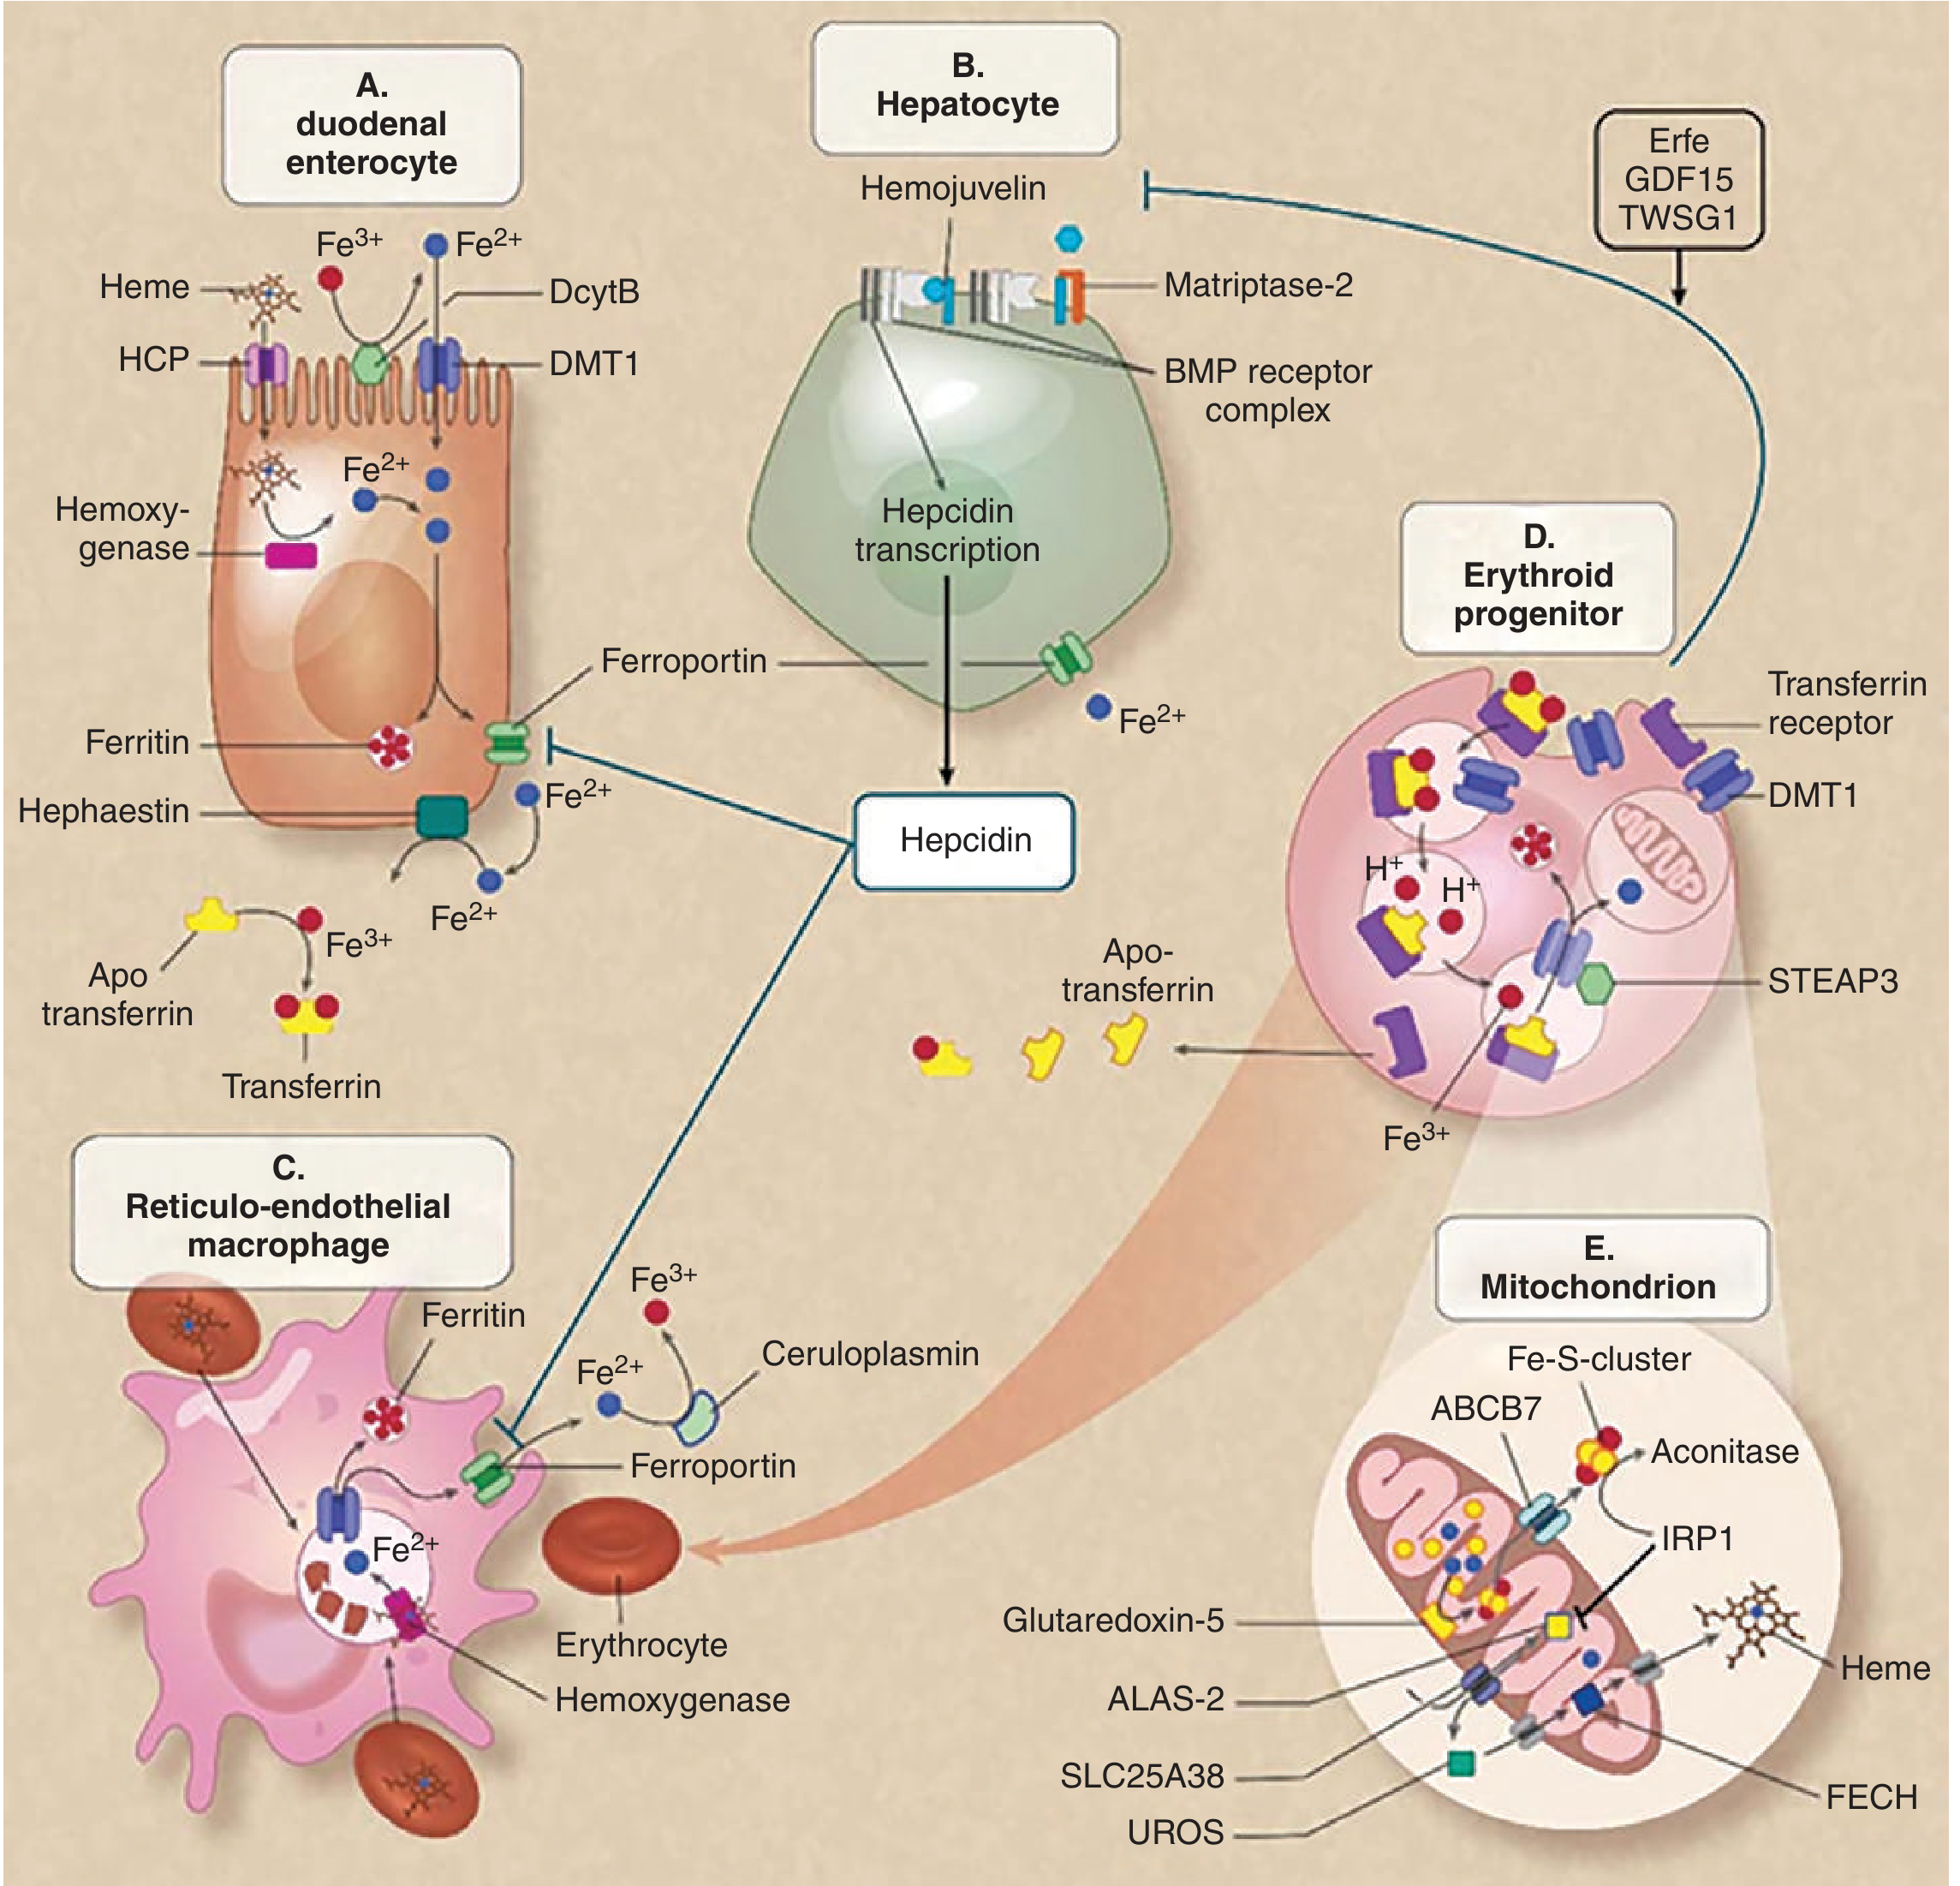
Step-by-Step Absorption:
- Dietary Fe³⁺ (non-heme) must be reduced to Fe²⁺ for absorption
- Gastric acid (HCl): Keeps iron soluble; converts Fe³⁺ → Fe²⁺; achlorhydria severely impairs absorption
- Duodenal cytochrome B (DcytB): Brush border ferrireductase reduces Fe³⁺ → Fe²⁺ at luminal surface
- Vitamin C (ascorbic acid): Reduces Fe³⁺ → Fe²⁺ in lumen; dramatically increases non-heme Fe absorption
- DMT1 (Divalent Metal Transporter-1): Transports Fe²⁺ across apical membrane into enterocyte
- HCP1 (Heme Carrier Protein-1): Transports intact heme molecule into enterocyte
- Hemoxygenase: Splits heme → Fe²⁺ + CO + biliverdin inside enterocyte
- Fe²⁺ enters the common intracellular iron pool
- Iron is either:
- Stored as ferritin (if body iron stores high; not absorbed - lost when enterocyte sloughs off in ~3-5 days - "mucosal block")
- Or transported directly to basolateral side for export
- Ferroportin (FPN1/SLC40A1): The ONLY known cellular iron exporter; transports Fe²⁺ across basolateral membrane
- Hephaestin: Multi-copper oxidase on basolateral membrane; oxidizes Fe²⁺ → Fe³⁺
- Apotransferrin in plasma binds Fe³⁺ → forms transferrin (TF) = transport form in blood
PART IV: TRANSPORT
- Transferrin (TF): β-globulin glycoprotein (MW 79 kDa); synthesized in liver; 2 Fe³⁺ binding sites; normally 30-35% saturated (TIBC reflects total transferrin; transferrin saturation = serum Fe/TIBC × 100%)
- Transferrin delivers iron to tissues (especially bone marrow) via Transferrin Receptor 1 (TfR1)
- Transferrin-TfR1 complex → endocytosis → endosome
- Acidification of endosome → Fe³⁺ released from transferrin
- STEAP3 (ferrireductase in endosome): Fe³⁺ → Fe²⁺
- DMT1: Fe²⁺ transferred to cytoplasm
- Apotransferrin recycled back to cell surface → released back to plasma
- In mitochondria: Fe²⁺ → heme synthesis (ALAS2, UROS, ferrochelatase/FECH)
PART V: STORAGE FORMS
| Form | Location | Notes |
|---|---|---|
| Ferritin | Liver, spleen, bone marrow, macrophages, enterocytes; small amount in plasma | Soluble; rapidly mobilizable; reflects body iron stores; serum ferritin: normal 12-300 μg/L men; 12-150 μg/L women |
| Hemosiderin | Liver, spleen, macrophages | Degraded/aggregated ferritin; visible on Prussian blue stain; mobilized slowly |
| Hemoglobin | RBCs | ~2.5 g (largest fraction) |
| Myoglobin | Muscle cells | ~130 mg |
| Tissue iron (enzymes) | All cells | ~150 mg - cytochromes, Fe-S enzymes |
| Plasma (transferrin-bound) | Circulation | Only ~3 mg at any time |
PART VI: THE MASTER REGULATOR - HEPCIDIN
- Hepcidin binds ferroportin on enterocytes, macrophages, and hepatocytes
- → Ferroportin is internalized and degraded (ubiquitin-proteasome)
- → Iron cannot exit these cells → ↓ plasma iron
- Iron overload (↑ iron stores, ↑ transferrin saturation)
- Inflammation/infection (IL-6 → hepcidin → anemia of chronic disease; iron sequestered from pathogens)
- Effect: ↓ Intestinal iron absorption, ↓ macrophage iron release → ↓ plasma iron
- Iron deficiency
- Anemia
- Hypoxia (HIF-2α → ↑ erythropoietin → ↑ erythropoiesis → ↑ iron demand → ↓ hepcidin)
- Erythropoietic signals (erythroferrone/Erfe from erythroblasts inhibits hepcidin)
- Effect: ↑ Iron absorption, ↑ macrophage iron release → ↑ plasma iron
PART VII: FUNCTIONS OF IRON
| Function | Detail |
|---|---|
| Oxygen transport (Hemoglobin) | Fe²⁺ in heme binds O₂ reversibly; each Hb carries 4 O₂ molecules |
| Oxygen storage (Myoglobin) | Fe²⁺ in heme stores O₂ in muscle |
| Electron transport chain | Fe-S clusters in Complex I, II, III; cytochrome c (heme); essential for oxidative phosphorylation |
| DNA synthesis | Ribonucleotide reductase (rate-limiting enzyme of deoxyribonucleotide synthesis) is an iron-dependent enzyme; explains megaloblastic-like changes in Fe deficiency |
| Drug metabolism | Cytochrome P450 enzymes (CYP450) contain Fe-heme; essential for liver drug oxidation |
| Antioxidant defense | Catalase and peroxidases contain heme iron; break down H₂O₂ |
| Immune function | Required for neutrophil/macrophage killing (NADPH oxidase, myeloperoxidase) |
| Collagen synthesis | Prolyl and lysyl hydroxylases require Fe²⁺ |
| Carnitine synthesis | Iron-dependent hydroxylases involved |
| Neurotransmitter synthesis | Tyrosine hydroxylase (dopamine, norepinephrine synthesis) requires iron |
| Thyroid hormone synthesis | Thyroid peroxidase is heme-containing enzyme |
PART VIII: FACTORS AFFECTING IRON ABSORPTION
Factors INCREASING Absorption:
| Factor | Mechanism |
|---|---|
| Vitamin C (ascorbic acid) | Reduces Fe³⁺ → Fe²⁺; forms soluble chelate; most important dietary enhancer |
| Heme iron | Directly absorbed via HCP1; more efficient than non-heme |
| Acidic gastric environment | Solubilizes iron; reduces Fe³⁺ → Fe²⁺ |
| Iron deficiency | ↑ DMT1 and TfR1 expression; ↓ hepcidin |
| Increased erythropoiesis | ↓ Hepcidin via erythroferrone |
| Hypoxia | ↑ HIF → ↑ DcytB, ↑ DMT1 expression |
| Pregnancy | Increased iron demand; ↓ hepcidin |
| Meat/poultry/fish ("MFP factor") | "Meat factor" enhances non-heme iron absorption (mechanism unclear) |
| Fructose, citrate, amino acids (cysteine) | Form soluble iron chelates |
Factors DECREASING Absorption:
| Factor | Mechanism |
|---|---|
| Phytates (whole grains, legumes) | Bind Fe³⁺ → insoluble phytate-iron complexes |
| Oxalates (spinach, rhubarb) | Bind iron → insoluble oxalate-iron complexes |
| Polyphenols/tannins (tea, coffee, red wine) | Tea especially potent - reduces absorption by 60-90% if drunk with meals |
| Calcium (dairy products) | Competes with iron at DMT1 |
| Phosphates | Form insoluble ferric phosphate |
| Antacids/PPIs | Raise gastric pH → Fe³⁺ less soluble, less reduced |
| Achlorhydria | Same mechanism as above |
| High iron stores (↑ hepcidin) | "Mucosal block" + hepcidin-mediated ferroportin degradation |
| Inflammation (↑ hepcidin) | IL-6 → ↑ hepcidin → ↓ ferroportin |
| Celiac disease, Crohn's | Reduces absorptive surface area |
| Competitive cations (Zn²⁺, Mn²⁺, Pb²⁺) | Compete for DMT1 |
PART IX: IRON DEFICIENCY
Three Stages of Iron Deficiency:
| Stage | Iron Stores | Serum Iron/TIBC | Hemoglobin | Features |
|---|---|---|---|---|
| Stage 1: Pre-latent (Iron depletion) | ↓ Ferritin | Normal | Normal | Tissue stores depleted; no functional deficit; detectable only by ↓ ferritin |
| Stage 2: Latent (Iron-deficient erythropoiesis) | Very ↓ | ↓ Fe, ↑ TIBC, ↓ TSAT | Normal or borderline | Insufficient iron for erythropoiesis; ↑ free erythrocyte protoporphyrin |
| Stage 3: Iron deficiency anemia | Absent | ↓↓ Fe, ↑↑ TIBC, ↓↓ TSAT | ↓↓ | Hypochromic microcytic anemia; clinical symptoms |
Causes of Iron Deficiency:
- Increased demand: Pregnancy, infancy, adolescence
- Decreased intake: Vegetarians, infants on milk-only diet, poor diet
- Decreased absorption: Achlorhydria, celiac disease, gastrectomy, post-bariatric surgery
- Increased losses (most common cause in adults):
- Chronic bleeding (GI: peptic ulcer, colorectal cancer, hookworm infestation; most common cause in adults)
- Menorrhagia (most common cause in premenopausal women)
- Haematuria, haemoptysis, factitious
Clinical Features of Iron Deficiency:
- Pallor (conjunctival, palmar, nail bed)
- Fatigue, weakness, exertional dyspnea, palpitations
- Headache, poor concentration
| Feature | Mechanism |
|---|---|
| Koilonychia (spoon-shaped nails) | Brittle nails from ↓ iron-containing enzymes |
| Angular stomatitis / cheilosis | Mucosal iron deficiency |
| Atrophic glossitis (smooth, beefy tongue) | Mucosal changes |
| Dysphagia (Plummer-Vinson/Paterson-Kelly syndrome) | Postcricoid web in esophagus |
| Pica | Craving for clay, ice (pagophagia), dirt (geophagia) |
| Restless leg syndrome | Iron involved in dopamine synthesis |
| Blue sclerae | Reduced collagen cross-linking |
| Impaired immune function | Iron needed for immune cell function |
| Hair loss |
Laboratory Findings in IDA:
| Test | IDA | Anemia of Chronic Disease | β-Thalassemia trait |
|---|---|---|---|
| Hb | ↓ | ↓ | ↓ |
| MCV | ↓ (microcytic) | Normal or ↓ | ↓ |
| Serum iron | ↓↓ | ↓ | Normal/↑ |
| TIBC | ↑↑ | Normal/↓ | Normal |
| Transferrin saturation | ↓↓ (<15%) | ↓ | Normal/↑ |
| Serum ferritin | ↓↓ (<12 μg/L) | Normal/↑ (acute phase) | Normal/↑ |
| Hepcidin | ↓ | ↑ | Variable |
| Blood film | Hypochromic microcytes, pencil cells, target cells | Normocytic/mildly microcytic | Target cells, basophilic stippling |
PART X: IRON OVERLOAD
PRIMARY IRON OVERLOAD (Genetic/Hereditary Hemochromatosis - HH)
| Type | Gene | Protein | Inheritance | Features |
|---|---|---|---|---|
| Type 1 (Classical HH) | HFE | HFE protein | Autosomal recessive (C282Y homozygous most common) | Most common; adult onset; presents 40-60 years |
| Type 2A (Juvenile HH) | HJV | Hemojuvelin | AR | Severe; onset <30 years; cardiomyopathy, hypogonadism |
| Type 2B | HAMP | Hepcidin (directly mutated) | AR | Severe; low hepcidin → uncontrolled iron absorption |
| Type 3 | TFR2 | Transferrin receptor 2 | AR | Moderate severity |
| Type 4 (Ferroportin disease) | SLC40A1 | Ferroportin | Autosomal dominant | Macrophage iron loading |
- Mutant HFE protein → impaired sensing of iron loading → inappropriately low hepcidin despite high iron stores
- Low hepcidin → ferroportin not degraded → unrestrained Fe²⁺ export from enterocytes and macrophages
- Excessive iron absorbed → accumulates in hepatocytes, cardiac myocytes, pancreatic beta cells, pituitary, joints
| Organ | Feature |
|---|---|
| Liver | Hepatomegaly → cirrhosis → hepatocellular carcinoma (200-fold increased risk) |
| Pancreas | "Bronze diabetes" (diabetes mellitus from β-cell destruction) |
| Skin | Bronze/grey hyperpigmentation (melanin + hemosiderin deposition; Schmorl's "bronze diabetes") |
| Heart | Cardiomyopathy (dilated or restrictive), arrhythmias, heart failure |
| Joints | Arthropathy (chondrocalcinosis, 2nd-3rd MCP joints pathognomonic) |
| Pituitary | Hypogonadotropic hypogonadism → loss of libido, amenorrhoea, testicular atrophy |
| Liver | The combination: Cirrhosis + Diabetes + Skin bronzing = "Bronze Diabetes" |
- ↑ Serum iron
- ↑↑ Transferrin saturation (>45% in women, >50% in men; >90% in severe cases)
- ↑↑ Serum ferritin (>300 μg/L in men, >200 μg/L in women)
- ↓ TIBC
- Liver biopsy: hepatic iron concentration; stainable iron on Prussian blue
- Genetic testing: HFE C282Y/H63D mutation
- Therapeutic phlebotomy (venesection): 500 mL blood (= ~250 mg iron) removed weekly until ferritin < 50 μg/L, then maintenance every 3-4 months
- Iron chelators: Desferrioxamine (IV/SC), deferasirox (oral), deferiprone (oral) - for those who cannot tolerate phlebotomy
- Diet: avoid alcohol, vitamin C supplements, raw shellfish (Vibrio vulnificus risk)
- Screen first-degree relatives
SECONDARY IRON OVERLOAD
| Cause | Mechanism |
|---|---|
| Repeated blood transfusions (most common secondary cause) | Each unit of blood = ~200-250 mg iron; no excretion mechanism; 1 transfusion/month → hemosiderosis in 1-2 years |
| Hemolytic anemias (sickle cell, thalassemia, G6PD) | Ineffective erythropoiesis → ↑ erythropoietic drive → ↓ hepcidin → ↑ absorption; + transfusion-related loading |
| Refractory sideroblastic anemia | Ineffective erythropoiesis + ↑ absorption |
| Excessive oral iron intake | Rare; usually requires underlying predisposition |
| African iron overload ("Bantu siderosis") | High iron content of home-brewed beer in iron pots + possible genetic susceptibility (SLC40A1 variant) |
| Liver disease (chronic) | Impaired hepcidin production → iron accumulation |
| Neonatal hemochromatosis | Alloimmune-mediated liver injury; massive hepatic iron deposition |
- Iron chelation therapy (desferrioxamine SC or IV; deferasirox oral; deferiprone oral)
- Minimize transfusions where possible; use leukodepleted blood
- Phlebotomy if erythropoiesis adequate
COMBINED SUMMARY TABLES
Calcium - Quick Reference
| Parameter | Normal Value |
|---|---|
| Total serum Ca²⁺ | 8.5-10.5 mg/dL (2.12-2.62 mmol/L) |
| Ionized Ca²⁺ | 4.6-5.3 mg/dL (1.15-1.32 mmol/L) |
| Urine Ca²⁺ | 100-300 mg/24h |
| RDA (adult) | 1,000 mg/day |
Iron - Quick Reference
| Test | Normal | IDA | Overload |
|---|---|---|---|
| Serum iron | 60-150 μg/dL | ↓ | ↑↑ |
| TIBC | 250-370 μg/dL | ↑ | ↓ |
| Transferrin saturation | 20-50% | ↓ (<15%) | ↑↑ (>50%) |
| Serum ferritin (men) | 30-300 μg/L | ↓ (<12) | ↑↑ (>300) |
| Serum ferritin (women) | 12-150 μg/L | ↓ (<12) | ↑↑ (>200) |
| Hepcidin | Normal | ↓ | ↑ (unless HH) |
- Harrison's Principles of Internal Medicine, 22nd Ed. - Chapters 422, Iron Deficiency
- Tietz Textbook of Laboratory Medicine, 7th Ed. - Chapter 40 (Iron)
- Brenner and Rector's The Kidney - Calcium homeostasis
- Medical Physiology, Boron & Boulpaep - Chapter 45
Explain de novo synthesis of fatty acids (fatty acid synthase complex regulation reactions ) Describe beta oxidation of fatty acids with a note on energetics and regulation and oxidation of odd chain fatty acids
de novo fatty acid synthesis fatty acid synthase complex steps ACP malonyl-CoA palmitate
TOPIC 1: DE NOVO FATTY ACID SYNTHESIS
OVERVIEW
| Feature | Detail |
|---|---|
| Primary site | Liver (most active); lactating mammary glands; adipose tissue (minor) |
| Subcellular location | Cytoplasm (cytosol) - contrast with β-oxidation (mitochondrial matrix) |
| Process character | Endergonic + reductive (requires ATP + NADPH) |
| End product | Palmitate (16:0) - the only fatty acid released from FAS |
| Carbon source | Acetyl-CoA (from carbohydrates, amino acids, alcohol) |
| Hormonal trigger | Insulin ↑, glucagon ↓ (fed state) |
STEP 1: TRANSFER OF ACETYL-CoA FROM MITOCHONDRIA TO CYTOSOL
Mitochondrial matrix:
Acetyl-CoA + OAA ──[citrate synthase]──> Citrate
[Tricarboxylate transporter]
↓
Cytosol:
Citrate ──[ATP-citrate lyase (ACL)]──> Acetyl-CoA + OAA + ADP + Pi
STEP 2: COMMITMENT STEP - ACETYL-CoA CARBOXYLASE (ACC) [RATE-LIMITING]
Acetyl-CoA + HCO₃⁻ + ATP ──[ACC, Biotin, Mg²⁺]──> Malonyl-CoA + ADP + Pi
| Feature | Detail |
|---|---|
| Enzyme | Acetyl-CoA Carboxylase (ACC) |
| Cofactor | Biotin (covalently bound to Lys residue; carries activated CO₂) |
| Energy | ATP required |
| Significance | Rate-limiting step; committed step of fatty acid synthesis |
| Product | Malonyl-CoA (3-carbon compound; the carbon donor for chain elongation) |
The extra CO₂ (from bicarbonate) added to acetyl-CoA in malonyl-CoA is released during condensation - this is what drives the reaction forward (irreversible) via the thermodynamic favorability of decarboxylation. The malonyl-CoA CO₂ never appears in the final product.
REGULATION OF ACETYL-CoA CARBOXYLASE
A. SHORT-TERM REGULATION
(i) Allosteric Regulation:
| Effector | Effect | Mechanism |
|---|---|---|
| Citrate | Activates | Causes protomers to polymerize → active filamentous polymer form |
| Palmitoyl-CoA (end product) | Inhibits (product inhibition) | Causes depolymerization → inactive protomer form |
| AMP | Indirect inhibition via AMPK |
(ii) Covalent Regulation (Phosphorylation/Dephosphorylation):
GLUCAGON/EPINEPHRINE → ↑cAMP → PKA activated
↓
AMPK also activated (PKA phosphorylates an AMPK kinase)
↓
AMPK phosphorylates ACC → INACTIVE (ACC-P)
↓↓ Fatty acid synthesis suppressed
INSULIN → Protein Phosphatase 1 → Dephosphorylates ACC → ACTIVE
↑↑ Fatty acid synthesis stimulated
- Activated by: ↑ AMP (energy deficit), exercise, metformin
- Inhibited by: ↑ ATP (energy surplus)
- Phosphorylates and inactivates ACC → ↓ malonyl-CoA → relieves CPT-I inhibition → ↑ β-oxidation
Important: Malonyl-CoA itself inhibits CPT-I (carnitine palmitoyltransferase I) - so when synthesis is on, β-oxidation is off. This prevents futile cycling.
B. LONG-TERM REGULATION (Gene Expression)
| State | Effect on ACC and FAS | Transcription Factors Involved |
|---|---|---|
| High-carbohydrate, high-calorie diet | ↑↑ ACC and FAS gene expression (induction) | ChREBP (glucose signal), SREBP-1c (insulin signal) |
| High-fat, low-carbohydrate diet | ↓ ACC and FAS expression (repression) | |
| Insulin | ↑ ACC and FAS expression | SREBP-1c activation |
| Glucagon | ↓ ACC and FAS expression | |
| Starvation/diabetes | ↓↓ ACC and FAS expression | |
| Metformin | ↓ ACC activity (phosphorylation via AMPK) AND ↓ ACC/FAS expression (↓ SREBP-1c) | AMPK-mediated |
STEP 3: THE FATTY ACID SYNTHASE (FAS) COMPLEX
| Domain | Enzyme Activity | Function |
|---|---|---|
| KS | β-Ketoacyl-ACP synthase (condensing enzyme) | Condenses acyl group + malonyl group |
| AT | Malonyl-acetyl transacylase | Loads acetyl and malonyl groups onto ACP |
| DH | β-Hydroxyacyl-ACP dehydratase | Dehydration step |
| ER | Enoyl-ACP reductase | NADPH-dependent reduction |
| KR | β-Ketoacyl-ACP reductase | NADPH-dependent reduction |
| TE | Thioesterase | Releases palmitate (16:0) |
| ACP | Acyl carrier protein (4'-phosphopantetheine) | Carries growing acyl chain via -SH (thiol) group |
The ACP domain contains a 4'-phosphopantetheine prosthetic group (derived from pantothenic acid/Vitamin B5) with a reactive -SH group that carries the growing fatty acid chain during synthesis. CoA also contains this same group.
SEVEN REACTIONS OF FAS PER ELONGATION CYCLE

| Step | Reaction | Enzyme Domain | Cofactor |
|---|---|---|---|
| [1] Loading | Acetyl-CoA → Acetyl-ACP (priming) | AT domain | - |
| [2] Transfer | Acetyl-ACP → Cysteine-SH (temporary holding site) | KS domain | - |
| [3] Malonyl loading | Malonyl-CoA → Malonyl-ACP | AT domain | - |
| [4] Condensation | Acetyl (from Cys) + Malonyl-ACP → 3-ketoacyl-ACP + CO₂ | KS domain | - |
| [5] 1st Reduction | 3-ketoacyl-ACP → 3-hydroxyacyl-ACP | KR domain | NADPH |
| [6] Dehydration | 3-hydroxyacyl-ACP → 2,3-trans-enoyl-ACP + H₂O | DH domain | - |
| [7] 2nd Reduction | 2,3-enoyl-ACP → acyl-ACP (saturated, 2 carbons longer) | ER domain | NADPH |
- Thioesterase (TE) cleaves the thioester bond → free palmitate (16:0) released
OVERALL EQUATION FOR PALMITATE SYNTHESIS
Acetyl-CoA + 7 Malonyl-CoA + 14 NADPH + 14 H⁺
→ Palmitate + 7 CO₂ + 8 CoA + 14 NADP⁺ + 6 H₂O
8 Acetyl-CoA + 7 ATP + 14 NADPH
→ Palmitate + 8 CoA + 7 ADP + 7 Pi + 14 NADP⁺
| Resource | Amount Used (per palmitate) |
|---|---|
| Acetyl-CoA | 8 (1 as primer + 7 as malonyl-CoA) |
| ATP | 7 (for malonyl-CoA formation by ACC) |
| NADPH | 14 (2 per cycle × 7 cycles) |
| CO₂ | 7 added (as malonyl) then 7 released (during condensation) |
- ~8 from pentose phosphate pathway (HMP) (2 NADPH per G6P)
- ~6 from malic enzyme (OAA → pyruvate)
FATE OF PALMITATE
| Process | Enzyme | Product |
|---|---|---|
| Chain elongation | Elongases (SER) | C18, C20, C22 fatty acids |
| Desaturation | Fatty acyl-CoA desaturases (SER; require O₂, NADH, cytochrome b5, FAD) | Oleic acid 18:1(Δ9) from stearic acid 18:0 |
| Esterification | Acyltransferases | Phospholipids, triglycerides |
- Linoleic acid (18:2, ω-6) - ESSENTIAL
- α-Linolenic acid (18:3, ω-3) - ESSENTIAL
COMPARISON: SYNTHESIS VS. β-OXIDATION
| Feature | Synthesis | β-Oxidation |
|---|---|---|
| Location | Cytosol | Mitochondrial matrix |
| Carrier | Citrate (acetyl-CoA out of mito) | Carnitine (acyl-CoA into mito) |
| Acyl carrier | ACP-SH | CoA-SH |
| Coenzymes | NADPH (reduction) | NAD⁺, FAD (oxidation) |
| 4-Step process | Condensation → reduction → dehydration → reduction | Dehydrogenation → hydration → dehydrogenation → thiolysis |
| Key inhibitor | Palmitoyl-CoA (inhibits ACC) | Malonyl-CoA (inhibits CPT-I) |
| Hormonal trigger | Insulin (fed state) | Glucagon/Epinephrine (fasting) |
TOPIC 2: β-OXIDATION OF FATTY ACIDS
OVERVIEW
| Feature | Detail |
|---|---|
| Location | Mitochondrial matrix (LCFA, MCFA, SCFA); Peroxisomes (VLCFA >C22) |
| Substrate | Fatty acyl-CoA |
| Products | Acetyl-CoA + FADH₂ + NADH |
| Linked to | TCA cycle (acetyl-CoA entry), ETC (NADH/FADH₂ reoxidation), Ketogenesis (in liver) |
| State | Fasting, starvation, exercise, diabetes (high glucagon, low insulin) |
PHASE 1: ACTIVATION (CYTOPLASM)
Fatty acid + CoA + ATP ──[Fatty acyl-CoA synthetase/thiokinase]──> Acyl-CoA + AMP + PPi
PPi ──[Pyrophosphatase]──> 2 Pi (drives reaction forward - irreversible)
PHASE 2: THE CARNITINE SHUTTLE (RATE-LIMITING FOR LCFA)
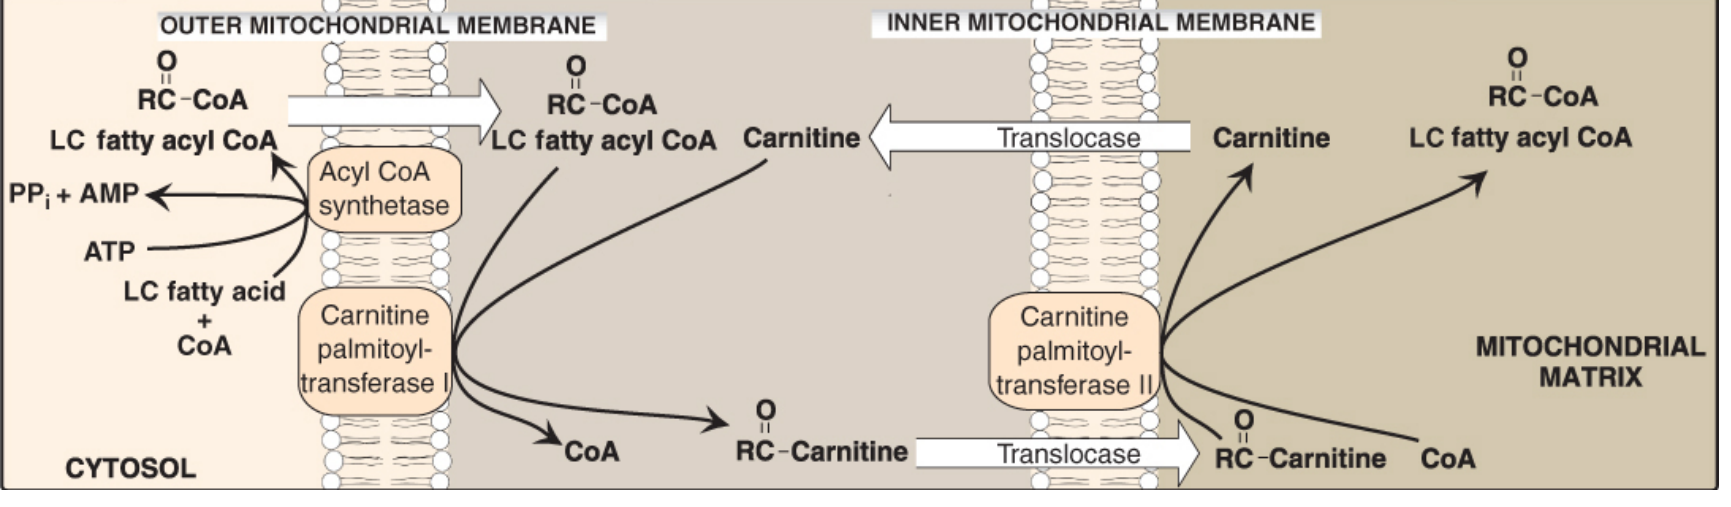
| Step | Location | Enzyme | Reaction |
|---|---|---|---|
| Step 1 | Outer mitochondrial membrane | CPT-I (Carnitine Palmitoyltransferase I) | Acyl-CoA + Carnitine → Acylcarnitine + CoA |
| Step 2 | Inner mitochondrial membrane | Carnitine-acylcarnitine translocase | Acylcarnitine (in) → Carnitine (out) exchange |
| Step 3 | Inner face of inner membrane | CPT-II (Carnitine Palmitoyltransferase II) | Acylcarnitine + CoA → Acyl-CoA + Carnitine |
Short-chain and medium-chain fatty acids (SCFA <C8, MCFA C8-C12) can cross the inner mitochondrial membrane as free acids without carnitine - they are activated to acyl-CoA inside the mitochondria.
PHASE 3: FOUR REACTIONS OF β-OXIDATION
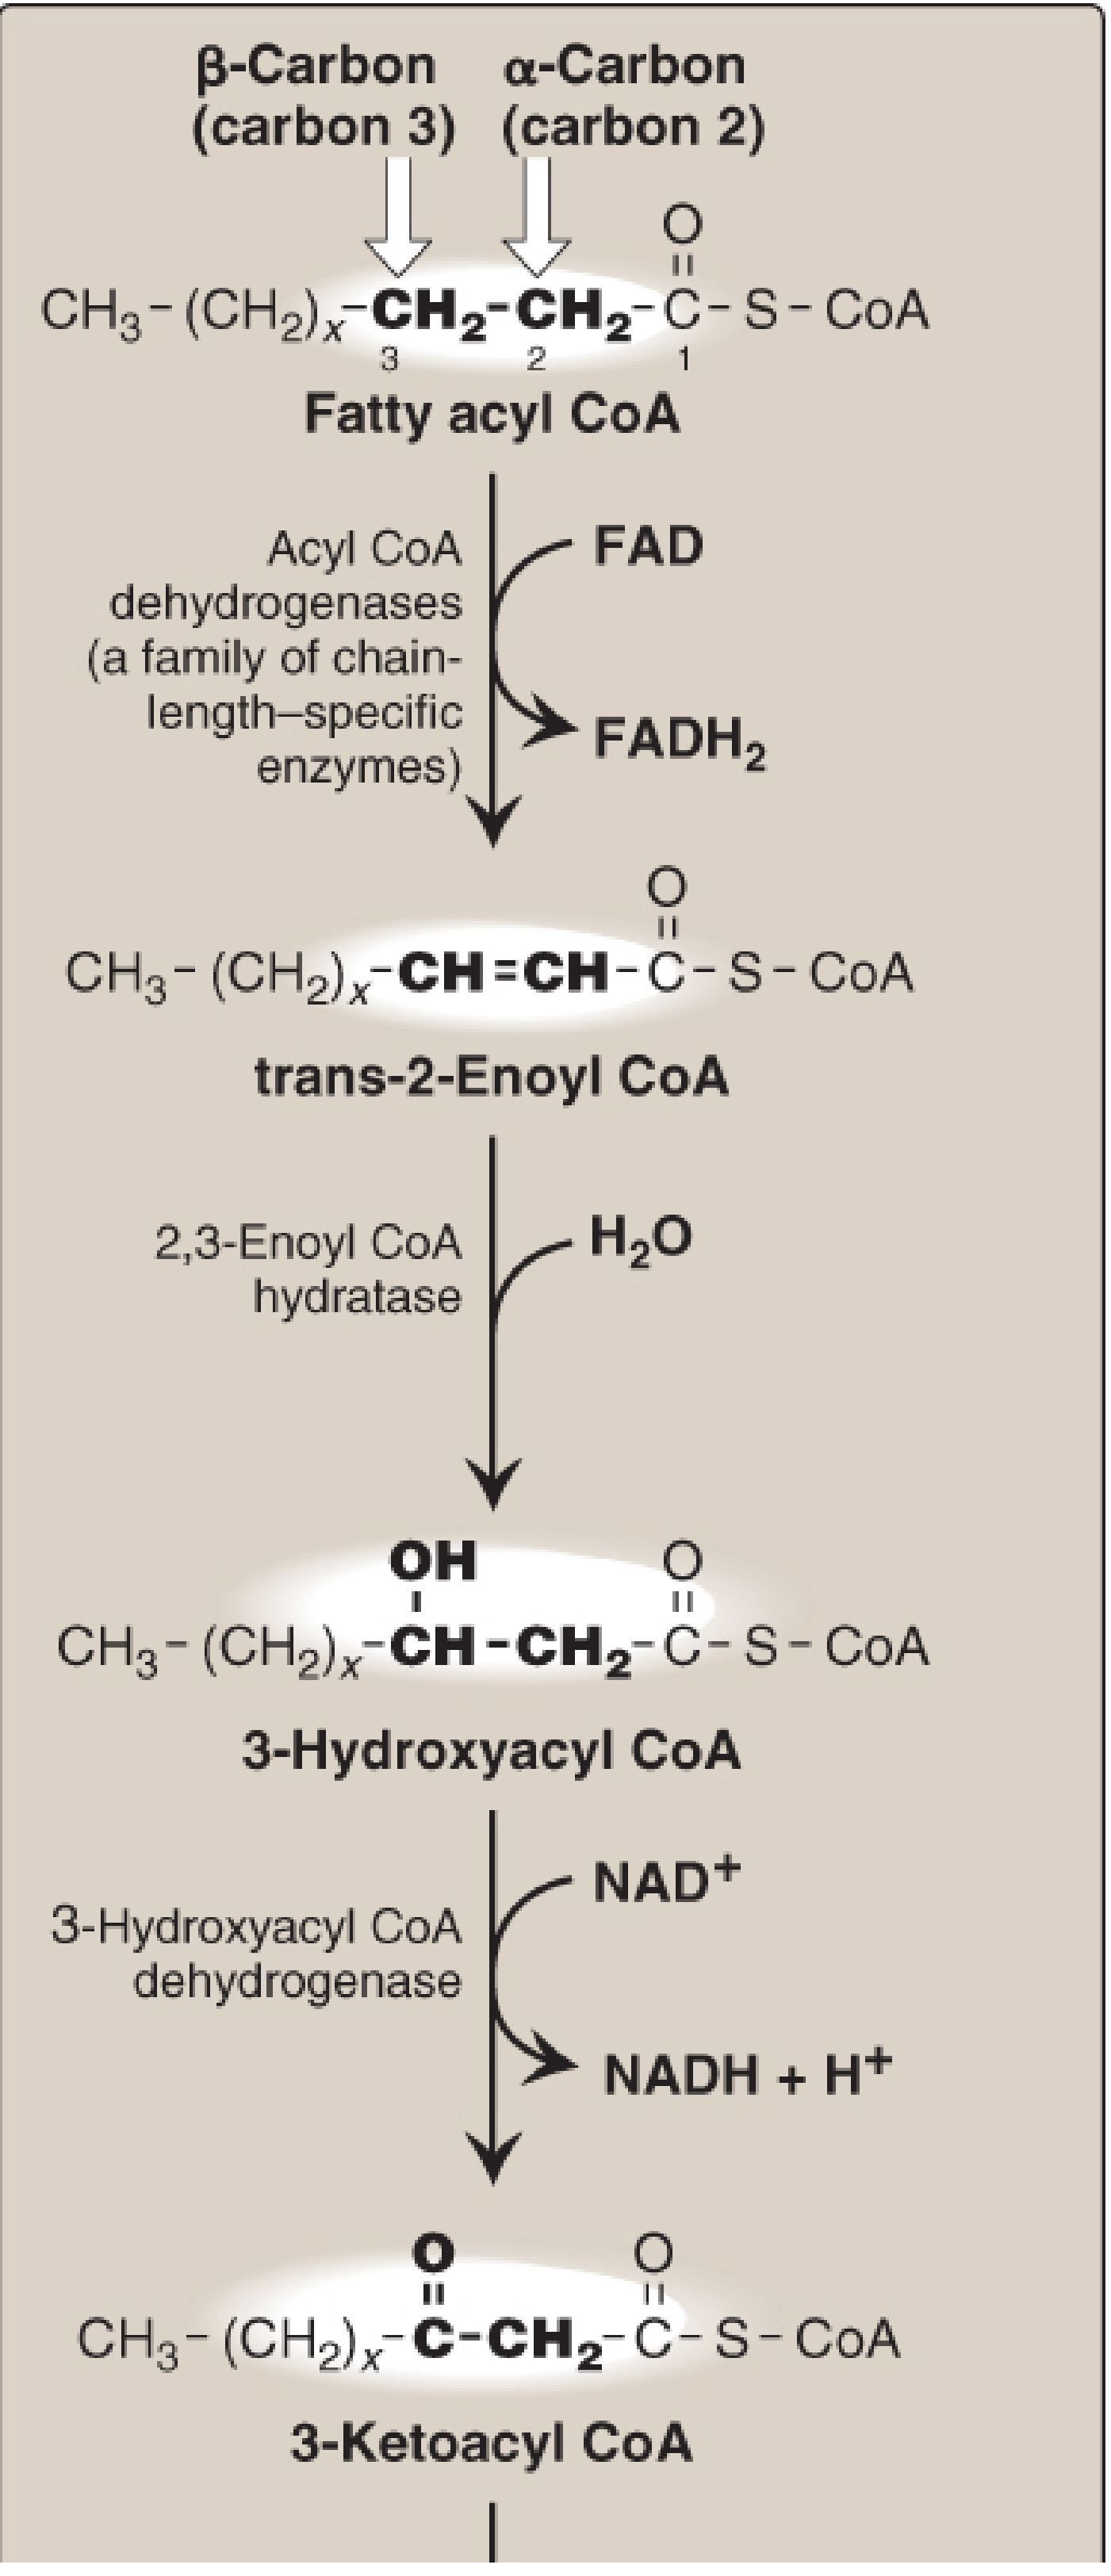
| Step | Reaction | Enzyme | Cofactor | Product |
|---|---|---|---|---|
| Step 1: Oxidation (Dehydrogenation) | Acyl-CoA → trans-Δ²-Enoyl-CoA (double bond between C2-C3) | Acyl-CoA Dehydrogenase (ACD) (4 isoforms: SCAD, MCAD, LCAD, VLCAD) | FAD → FADH₂ | FADH₂ + trans-Δ²-enoyl-CoA |
| Step 2: Hydration | trans-Δ²-Enoyl-CoA + H₂O → L-3-Hydroxyacyl-CoA | Enoyl-CoA Hydratase (requires trans double bond) | Water | L-3-hydroxyacyl-CoA |
| Step 3: Oxidation (Dehydrogenation) | L-3-Hydroxyacyl-CoA → 3-Ketoacyl-CoA | 3-Hydroxyacyl-CoA Dehydrogenase (HAD) | NAD⁺ → NADH | NADH + 3-ketoacyl-CoA |
| Step 4: Thiolysis (Cleavage) | 3-Ketoacyl-CoA + CoA → Acetyl-CoA + (acyl-CoA shortened by 2C) | Thiolase (β-ketothiolase) | CoA | Acetyl-CoA + shortened acyl-CoA |
Memory aid for β-oxidation: "OHAT" - Oxidation → Hydration → Oxidation (Alternate: second oxidation) → Thiolysis Or compare with synthesis (mirror image): Synthesis = Condensation-Reduction-Dehydration-Reduction; β-oxidation = Dehydrogenation-Hydration-Dehydrogenation-Thiolysis
ENERGETICS OF β-OXIDATION
Palmitate (16:0) - The Standard Example
| Yield Source | Amount | ATP yield (using P/O ratios: NADH = 2.5 ATP; FADH₂ = 1.5 ATP; acetyl-CoA via TCA = 10 ATP) |
|---|---|---|
| NADH (from β-oxidation) | 7 | 7 × 2.5 = 17.5 ATP |
| FADH₂ (from β-oxidation) | 7 | 7 × 1.5 = 10.5 ATP |
| Acetyl-CoA → TCA cycle | 8 × 10 ATP | 80 ATP |
| Subtotal | 108 ATP | |
| Activation cost | -2 ATP equivalents (ATP → AMP + PPi) | -2 ATP |
| NET YIELD | ~106 ATP |
Classic textbook values (using older P/O ratios NADH=2.5, FADH₂=1.5): Net = 106 ATP Using older integer ratios (NADH=3, FADH₂=2): 7×3 + 7×2 + 8×12 = 21 + 14 + 96 = 131 - 2 = 129 ATP (older textbooks may use this)
REGULATION OF β-OXIDATION
1. Substrate Availability (Primary Regulation)
- Free fatty acid (FFA) supply from adipose tissue (lipolysis by HSL) determines rate of β-oxidation
- Fasting/glucagon/epinephrine: ↑ lipolysis → ↑ FFA delivery to liver and muscle
- Insulin: ↓ lipolysis → ↓ FFA delivery → ↓ β-oxidation; also ↑ ACC → ↑ malonyl-CoA → CPT-I inhibited
2. Malonyl-CoA / CPT-I (Key Regulatory Switch)
FED STATE (high insulin):
↑ Acetyl-CoA → ↑ ACC activity → ↑ Malonyl-CoA
↓
Malonyl-CoA inhibits CPT-I
↓
Acyl-CoA CANNOT enter mitochondria
↓
β-Oxidation suppressed
(Prevents futile cycle with fatty acid synthesis)
FASTING STATE (low insulin, high glucagon):
↓ Insulin → ↓ ACC activity (phosphorylation by AMPK/PKA) → ↓ Malonyl-CoA
↓
CPT-I active → Acyl-CoA enters mitochondria
↓
β-Oxidation active
3. NADH/NAD⁺ and Acetyl-CoA Ratio
- High NADH (step 3 requires NAD⁺) → inhibits 3-hydroxyacyl-CoA DH
- High acetyl-CoA (if TCA is saturated) → acetyl-CoA diverts to ketogenesis in liver
4. Carnitine Availability
- Carnitine deficiency (primary or secondary) → impairs LCFA transport → impaired β-oxidation
REGULATION SUMMARY TABLE
| Regulator | Mechanism | Effect on β-Oxidation |
|---|---|---|
| Malonyl-CoA | Inhibits CPT-I (allosteric) | ↓↓ (blocks entry of LCFA) |
| High NADH | Inhibits HAD (step 3) | ↓ |
| High acetyl-CoA | Inhibits thiolase (step 4) and TCA; shunts to ketogenesis | ↓ at β-oxidation level; continues via ketone body synthesis in liver |
| ↑ Free fatty acids | More substrate for activation and CPT-I | ↑ |
| Glucagon/Epinephrine | ↑ lipolysis, ↓ malonyl-CoA (via AMPK/PKA → ↓ ACC) | ↑↑ |
| Insulin | ↓ lipolysis, ↑ malonyl-CoA (ACC active) | ↓↓ |
| AMP/AMPK | Activates AMPK → phosphorylates/inactivates ACC → ↓ malonyl-CoA | ↑ |
| Carnitine | Substrate for CPT-I | ↑ when carnitine available |
OXIDATION OF ODD-CHAIN FATTY ACIDS
Propionyl-CoA Metabolism (3-Step Pathway):
ODD-CHAIN FATTY ACID
↓ [β-oxidation cycles]
PROPIONYL-CoA (C3)
↓ [Step 1]
D-METHYLMALONYL-CoA
↓ [Step 2]
L-METHYLMALONYL-CoA
↓ [Step 3]
SUCCINYL-CoA → TCA Cycle
| Step | Enzyme | Cofactor | Reaction |
|---|---|---|---|
| Step 1 | Propionyl-CoA Carboxylase | Biotin + ATP | Propionyl-CoA + CO₂ → D-methylmalonyl-CoA |
| Step 2 | Methylmalonyl-CoA Epimerase (racemase) | - | D-methylmalonyl-CoA → L-methylmalonyl-CoA |
| Step 3 | Methylmalonyl-CoA Mutase | Vitamin B₁₂ (adenosylcobalamin/cobalamin) | L-methylmalonyl-CoA → Succinyl-CoA |
Clinical Significance:
| Condition | Enzyme Deficient | Consequence |
|---|---|---|
| Methylmalonic acidemia (MMA) | Methylmalonyl-CoA mutase (OR B₁₂ deficiency/transport defects) | ↑↑ Methylmalonic acid in blood and urine; metabolic acidosis, hypoglycemia, developmental delay, failure to thrive |
| Propionic acidemia | Propionyl-CoA carboxylase | ↑↑ Propionate + its metabolites; metabolic acidosis, hyperammonemia, cardiomyopathy |
| Vitamin B₁₂ deficiency | ↓ Adenosylcobalamin (cofactor for mutase) | Accumulation of methylmalonyl-CoA AND methylmalonic acid (urinary methylmalonic acid is an early/sensitive biomarker of B₁₂ deficiency) |
Important exam pearl: Biotin is needed for propionyl-CoA carboxylase AND pyruvate carboxylase AND acetyl-CoA carboxylase - all biotin-dependent carboxylases! Vitamin B₁₂ is needed for methylmalonyl-CoA mutase - explains methylmalonic aciduria in B₁₂ deficiency.
CLINICAL DISORDERS OF β-OXIDATION
| Disorder | Deficient Enzyme | Key Features |
|---|---|---|
| MCAD deficiency (most common) | Medium-chain acyl-CoA DH | Autosomal recessive; C6-C10 oxidation defect; hypoketotic hypoglycemia during fasting; ↑ octanoylcarnitine (C8); Newborn screen positive; treat: avoid fasting |
| LCAD/VLCAD deficiency | Long/very-long-chain ACD | Cardiomyopathy, rhabdomyolysis, hypoglycemia |
| CPT-I deficiency | CPT-I | ↓ LCFA oxidation; normal SCFA oxidation; hypoketotic hypoglycemia; hepatomegaly |
| CPT-II deficiency | CPT-II | Exercise-induced rhabdomyolysis in adults (muscle form); neonatal lethal form |
| Primary carnitine deficiency | Carnitine transporter (OCTN2) | ↓ Carnitine uptake; LCFA cannot enter mito; cardiomyopathy, myopathy; treat with carnitine |
| Zellweger syndrome | Peroxisome biogenesis | ↑ VLCFA (normally oxidized in peroxisomes); severe neurological defects |
FINAL SUMMARY TABLE
| Feature | de Novo Synthesis | β-Oxidation |
|---|---|---|
| Location | Cytosol | Mitochondria (+ peroxisomes for VLCFA) |
| State | Fed (high insulin) | Fasted (high glucagon) |
| Rate-limiting step | Acetyl-CoA Carboxylase (→malonyl-CoA) | Carnitine shuttle (CPT-I) |
| Key cofactors | Biotin (ACC), 4'-phosphopantetheine/B5 (ACP) | FAD (ACAD), NAD⁺ (HAD), B₁₂ (mutase), Biotin (propionyl-CoA carboxylase) |
| Coenzymes | NADPH consumed | FADH₂, NADH produced |
| Activator of rate-limiting step | Citrate activates ACC | ↑ FFA, ↓ malonyl-CoA activates CPT-I |
| Inhibitor of rate-limiting step | Palmitoyl-CoA, AMP, AMPK | Malonyl-CoA inhibits CPT-I |
| Hormonal activation | Insulin | Glucagon, epinephrine |
| Main product | Palmitate | Acetyl-CoA + NADH + FADH₂ |
| Net ATP | Costs 7 ATP + 14 NADPH per palmitate | Yields ~106 net ATP per palmitate |
Lipoprotein metabolism and classification
lipoprotein metabolism chylomicron VLDL LDL HDL pathway diagram
LIPOPROTEIN METABOLISM AND CLASSIFICATION
PART I: INTRODUCTION - WHY LIPOPROTEINS EXIST
| Lipid | % of total plasma lipids |
|---|---|
| Cholesteryl esters | 36% |
| Phospholipids | 30% |
| Triglycerides | 16% |
| Free cholesterol | 14% |
| Free fatty acids (on albumin) | 4% (most metabolically active) |
PART II: STRUCTURE OF A LIPOPROTEIN PARTICLE
┌──────────────────────────────────────┐
│ SURFACE (hydrophilic shell) │
│ - Phospholipids (outer leaflet) │
│ - Free (unesterified) cholesterol │
│ - Apolipoproteins │
│ │
│ CORE (hydrophobic) │
│ - Triglycerides (TAGs) │
│ - Cholesterol esters (CEs) │
└──────────────────────────────────────┘
PART III: CLASSIFICATION OF LIPOPROTEINS
A. BY DENSITY (Ultracentrifugation - the Gold Standard)
| Lipoprotein | Density (g/mL) | Size (nm) | % Protein | % Lipid | Major Lipid | Synthesized in |
|---|---|---|---|---|---|---|
| Chylomicrons (CM) | <0.95 | 75-1200 | 1-2% | 98-99% | TAG (86%) | Small intestine |
| VLDL | 0.95-1.006 | 30-80 | 10% | 90% | TAG (55%) | Liver |
| IDL (intermediate) | 1.006-1.019 | 25-35 | 18% | 82% | TAG+CE (equal) | From VLDL |
| LDL | 1.019-1.063 | 18-25 | 25% | 75% | CE (45%) | From IDL |
| HDL | 1.063-1.21 | 5-12 | 50% | 50% | PL+CE | Liver + intestine |
| Lp(a) | 1.04-1.09 | 25-30 | ~30% | ~70% | CE | Liver |
B. BY ELECTROPHORETIC MOBILITY
| Electrophoretic Band | Corresponds to | Migration |
|---|---|---|
| Origin (stays at origin) | Chylomicrons | No migration (largest) |
| Pre-β (pre-beta) | VLDL | Fastest migration after α |
| Broad-β | IDL (β-VLDL in Type III HLP) | Between pre-β and β |
| β (beta) | LDL | Moderate migration |
| α (alpha) | HDL | Fastest migration (smallest, most protein) |
PART IV: APOLIPOPROTEINS (APOS)
- Structural - maintain particle integrity
- Enzyme cofactors - activate or inhibit lipolytic enzymes
- Receptor ligands - direct uptake by target cells
Complete Apolipoprotein Table:
| Apolipoprotein | Source | Found In | Molecular Mass | Key Function |
|---|---|---|---|---|
| ApoA-I | Liver + Intestine | HDL, CM | 28 kDa | Activates LCAT (esterifies free cholesterol); structural component of HDL; ligand for ABCA1 receptor |
| ApoA-II | Liver | HDL, CM | 17 kDa | Structural for HDL; activates hepatic lipase |
| ApoA-IV | Intestine | HDL, CM | 46 kDa | Role in CM assembly; regulates satiety and glucose homeostasis |
| ApoA-V | Liver | VLDL, CM, HDL | 39 kDa | Promotes LPL-mediated TG hydrolysis |
| ApoB-48 | Intestine only | Chylomicrons | 241 kDa | Assembly + secretion of chylomicrons; does NOT bind LDL receptor |
| ApoB-100 | Liver | VLDL, IDL, LDL, Lp(a) | 512 kDa | Assembly + secretion of VLDL; ligand for LDL receptor (longest single polypeptide known: 4500+ AA) |
| ApoC-I | Liver | CM, VLDL, HDL | 6.6 kDa | Activates LCAT; inhibits CETP |
| ApoC-II | Liver | CM, VLDL, HDL | 8.8 kDa | Essential cofactor for Lipoprotein Lipase (LPL) |
| ApoC-III | Liver | CM, VLDL, HDL | 8.8 kDa | Inhibits LPL; inhibits hepatic uptake of CM remnants and VLDL remnants |
| ApoE | Liver | CM remnants, IDL, HDL | 34 kDa | Ligand for LDL receptor AND LRP-1 (mediates remnant uptake by liver); 3 alleles: E2 (↑TG), E3 (normal), E4 (↑LDL, ↑Alzheimer risk) |
| Apo(a) | Liver | Lp(a) only | 250-800 kDa | Linked to ApoB-100 by disulfide bond in Lp(a); homologous to plasminogen; interferes with fibrinolysis |
ApoB-48 vs ApoB-100 origin: Both are encoded by the same gene (on chromosome 2). ApoB-48 is created by RNA editing in the intestine: a cytidine deaminase converts codon 2153 (CAA=Gln) → stop codon (UAA) → truncated 48% of B-100. This is why chylomicrons cannot bind LDL receptor (the receptor-binding domain is in the C-terminal 52% that's absent in B-48).
PART V: KEY ENZYMES AND PROTEINS IN LIPOPROTEIN METABOLISM
| Enzyme/Protein | Location | Function | Activators / Inhibitors |
|---|---|---|---|
| Lipoprotein Lipase (LPL) | Capillary endothelium (heart, adipose, muscle, mammary gland) | Hydrolyzes TG in CM and VLDL → FFAs + glycerol; "gate" into peripheral tissues | Activated by ApoC-II; inhibited by ApoC-III; inhibited by NaCl (heparin releases LPL from proteoglycans) |
| Hepatic Lipase (HL) | Hepatic sinusoidal endothelium | Converts IDL → LDL (removes remaining TG from IDL); converts HDL2 → HDL3; hydrolyzes CM remnant phospholipids | Activated by ApoA-II |
| LCAT (Lecithin:Cholesterol Acyltransferase) | Plasma (secreted by liver) | Esterifies free cholesterol in HDL shell → cholesterol ester (migrates to HDL core → traps cholesterol in HDL) | Activated by ApoA-I (major activator), ApoC-I; inhibited by ApoA-II |
| CETP (Cholesterol Ester Transfer Protein) | Plasma | Transfers cholesterol esters from HDL → VLDL/LDL in exchange for TG; "transfers" CEs from HDL to atherogenic lipoproteins | Inhibited by ApoC-I |
| MTP (Microsomal TG Transfer Protein) | ER of hepatocytes + enterocytes | Lipidates ApoB-100 during VLDL assembly; lipidates ApoB-48 during CM assembly; essential for both | Inhibited by lomitapide (drug for homozygous FH) |
| PCSK9 | Liver (secreted) | Binds LDL receptor → directs it to lysosomal degradation instead of recycling → ↓ LDL receptor expression → ↑ plasma LDL | Inhibitors: evolocumab, alirocumab (monoclonal Ab drugs) - dramatically ↓ LDL |
PART VI: METABOLIC PATHWAYS
PATHWAY 1: EXOGENOUS PATHWAY (Dietary fat → Chylomicrons)
DIETARY FAT (intestinal lumen)
↓ [Pancreatic lipase, bile salts → micelles]
Fatty acids + Monoglycerides absorbed by enterocytes
↓ [Re-esterification in SER → TAG, CE]
ApoB-48 + MTP + phospholipids → NASCENT CHYLOMICRON
↓ [Packaged in Golgi; secreted via exocytosis]
→ LYMPH (thoracic duct) → BLOOD
↓
CM acquires ApoC-II and ApoE from circulating HDL
↓ [MATURE CHYLOMICRON in circulation]
↓ [ApoC-II activates LPL on capillary endothelium]
TG hydrolyzed → FFA + glycerol
FFAs → adipose (storage), heart/muscle (oxidation)
↓
CHYLOMICRON REMNANT (depleted of TG; enriched in CE + ApoE)
[ApoC-II transferred back to HDL; ApoE retained]
↓ [ApoE binds LDL receptor and LRP-1 on liver]
LIVER UPTAKE → endocytosis → CE + TG hydrolyzed
↓ [Cholesterol used for bile acids, VLDL, membranes]
- Half-life: <1 hour (rapidly cleared)
- Large particles → turbid plasma after fatty meal (lactescence)
- ApoB-48 is the structural apolipoprotein (always present, non-exchangeable)
- Remnants taken up by liver via ApoE → LDL receptor + LRP-1
- Chylomicrons themselves do NOT enter liver - only remnants do
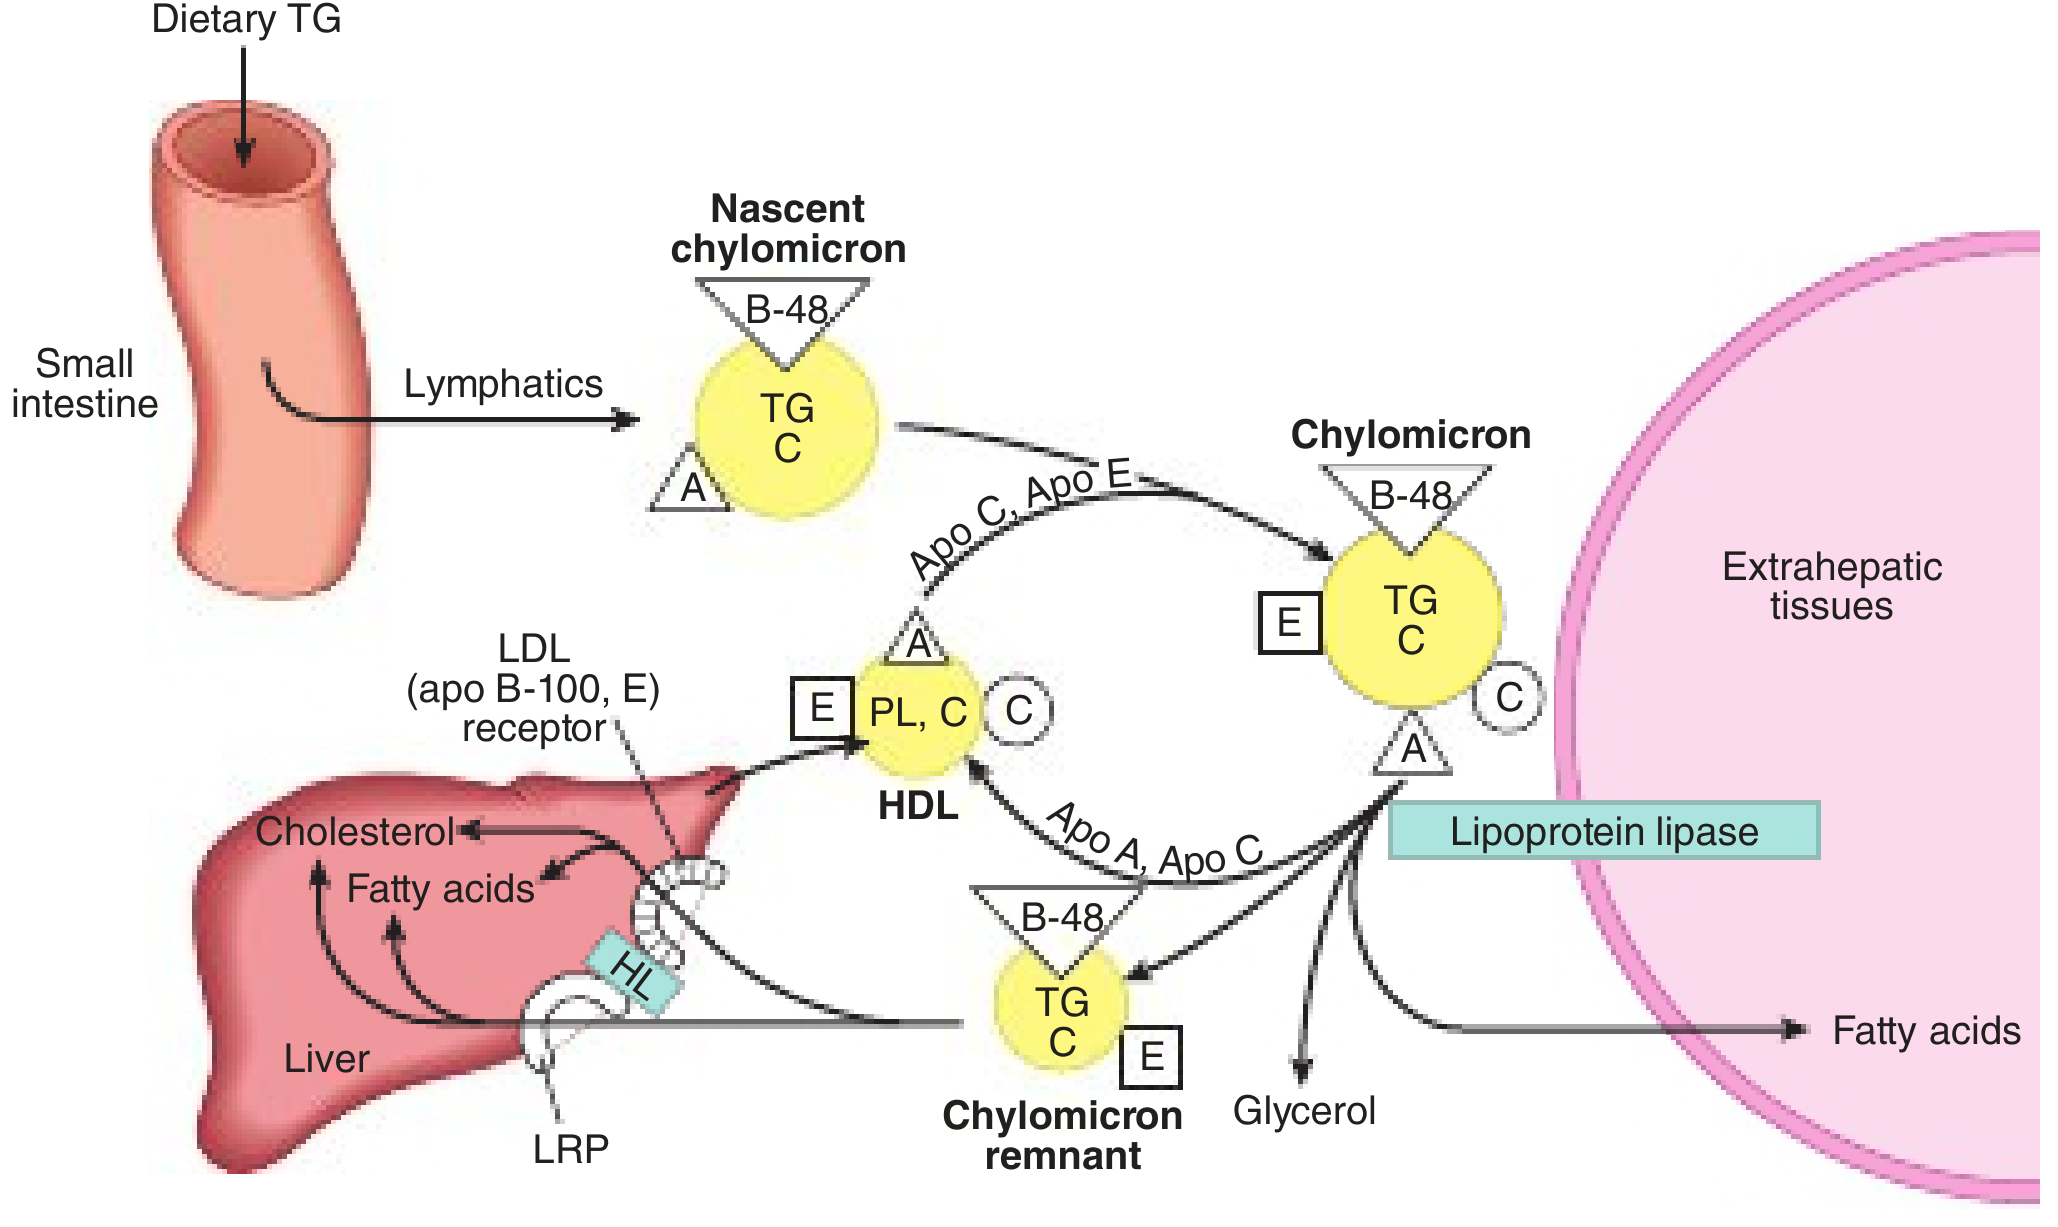
PATHWAY 2: ENDOGENOUS PATHWAY (Liver → VLDL → IDL → LDL)
LIVER (hepatocyte)
↓ [ApoB-100 synthesis on rough ER; lipidated by MTP]
↓ [TG from fatty acid synthesis or FFAs; CE from ACAT]
NASCENT VLDL (ApoB-100 + ApoC-I + ApoC-III + ApoE)
↓ [Golgi → exocytosis into sinusoids → bloodstream]
↓ [Acquires ApoC-II from HDL in circulation]
MATURE VLDL
↓ [ApoC-II activates LPL at capillary walls]
↓ [TG hydrolyzed → FFAs to peripheral tissues]
↓ [Loses ApoC-II and ApoC-III back to HDL]
IDL (Intermediate-Density Lipoprotein)
↓ Two possible fates:
├── [~50%] Direct uptake by liver via LDL receptor (ApoE ligand)
└── [~50%] Further TG hydrolysis by Hepatic Lipase (HL)
↓ [Loses ApoE; only ApoB-100 remains]
LDL (Low-Density Lipoprotein)
↓ [ApoB-100 binds LDL receptor on liver (70%) + peripheral cells (30%)]
↓ [Receptor-mediated endocytosis → lysosome]
↓ [CE hydrolyzed → free cholesterol for membranes, steroid hormones, bile acids]
↓ [ApoB-100 degraded; LDL receptor recycled to surface]
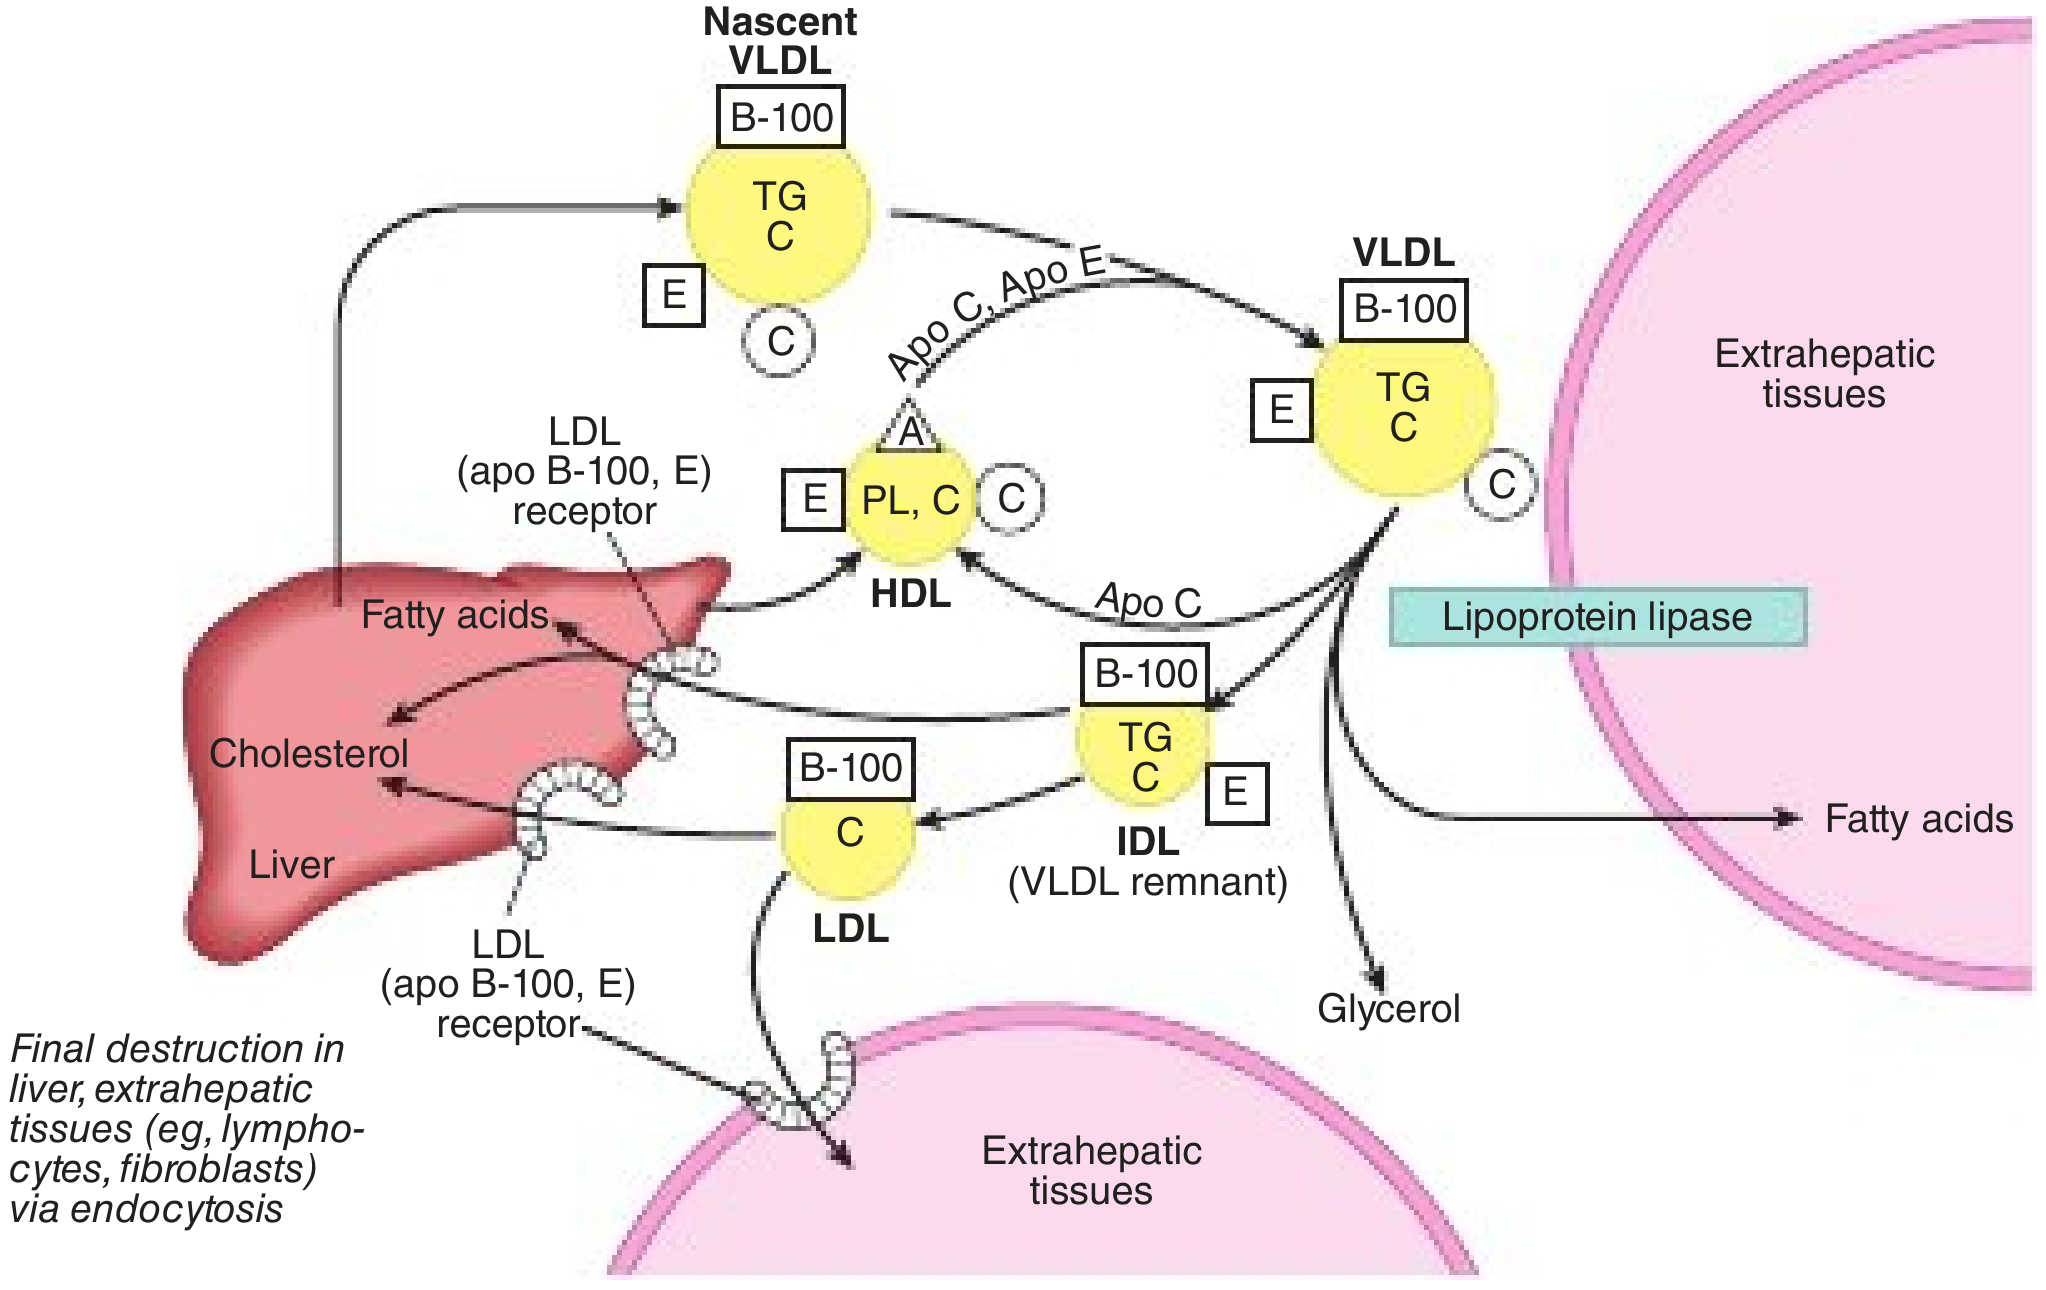
- VLDL assembly requires ApoB-100 + MTP (essential; abetalipoproteinemia = MTP defect)
- Insulin inhibits VLDL secretion (inhibits ApoB-100 synthesis and VLDL1 formation)
- Hypertriglyceridemia → ↑ VLDL → ↑ small dense LDL (atherogenic)
- Each VLDL particle carries ONE ApoB-100 → one LDL particle per VLDL (1:1 relationship)
- ~70% cleared by liver LDL receptors (LDLR)
- LDL receptor recognizes: ApoB-100 (and also ApoE)
- After LDL binds → clathrin-coated pit → endosome → lysosome
- Free cholesterol released → suppresses HMG-CoA reductase (↓ endogenous synthesis), downregulates LDLR expression, activates ACAT (esterification for storage)
- PCSK9 (proprotein convertase) secreted by liver → binds LDLR → prevents receptor recycling → ↓ LDLR on surface → ↑ LDL in blood
- PCSK9 inhibitors (evolocumab, alirocumab) can reduce LDL by 50-70% on top of statins
PATHWAY 3: REVERSE CHOLESTEROL TRANSPORT (HDL Pathway)
LIVER + INTESTINE
↓ [Synthesize and secrete NASCENT HDL]
↓ [Disc-shaped bilayer; contains ApoA-I, ApoA-II, phospholipid, free cholesterol]
↓ [Also: "budded off" surface material from CM/VLDL during LPL action]
PRE-β HDL / NASCENT HDL (HDL3 - small, dense, protein-rich)
↓ [ApoA-I on HDL surface binds ABCA1 on peripheral cells]
↓ [ABCA1 flips cholesterol from inner → outer membrane leaflet]
↓ [Free cholesterol + phospholipids transfer from cell to HDL]
↓ [LCAT (activated by ApoA-I) esterifies free cholesterol → CE]
↓ [CE moves to hydrophobic core → particle grows spherical]
↓ [HDL3 → HDL2 (larger, lipid-rich)]
MATURE HDL2 (cholesterol-loaded)
↓ Two paths back to liver:
├── Direct: SR-BI receptor on liver → selective CE uptake (ApoA-I stays in plasma → recycled)
└── Indirect: CETP transfers CE from HDL → VLDL/LDL (in exchange for TG)
→ LDL then cleared by liver via LDLR
↓ [Liver: cholesterol → bile acids or biliary cholesterol → excreted in feces]
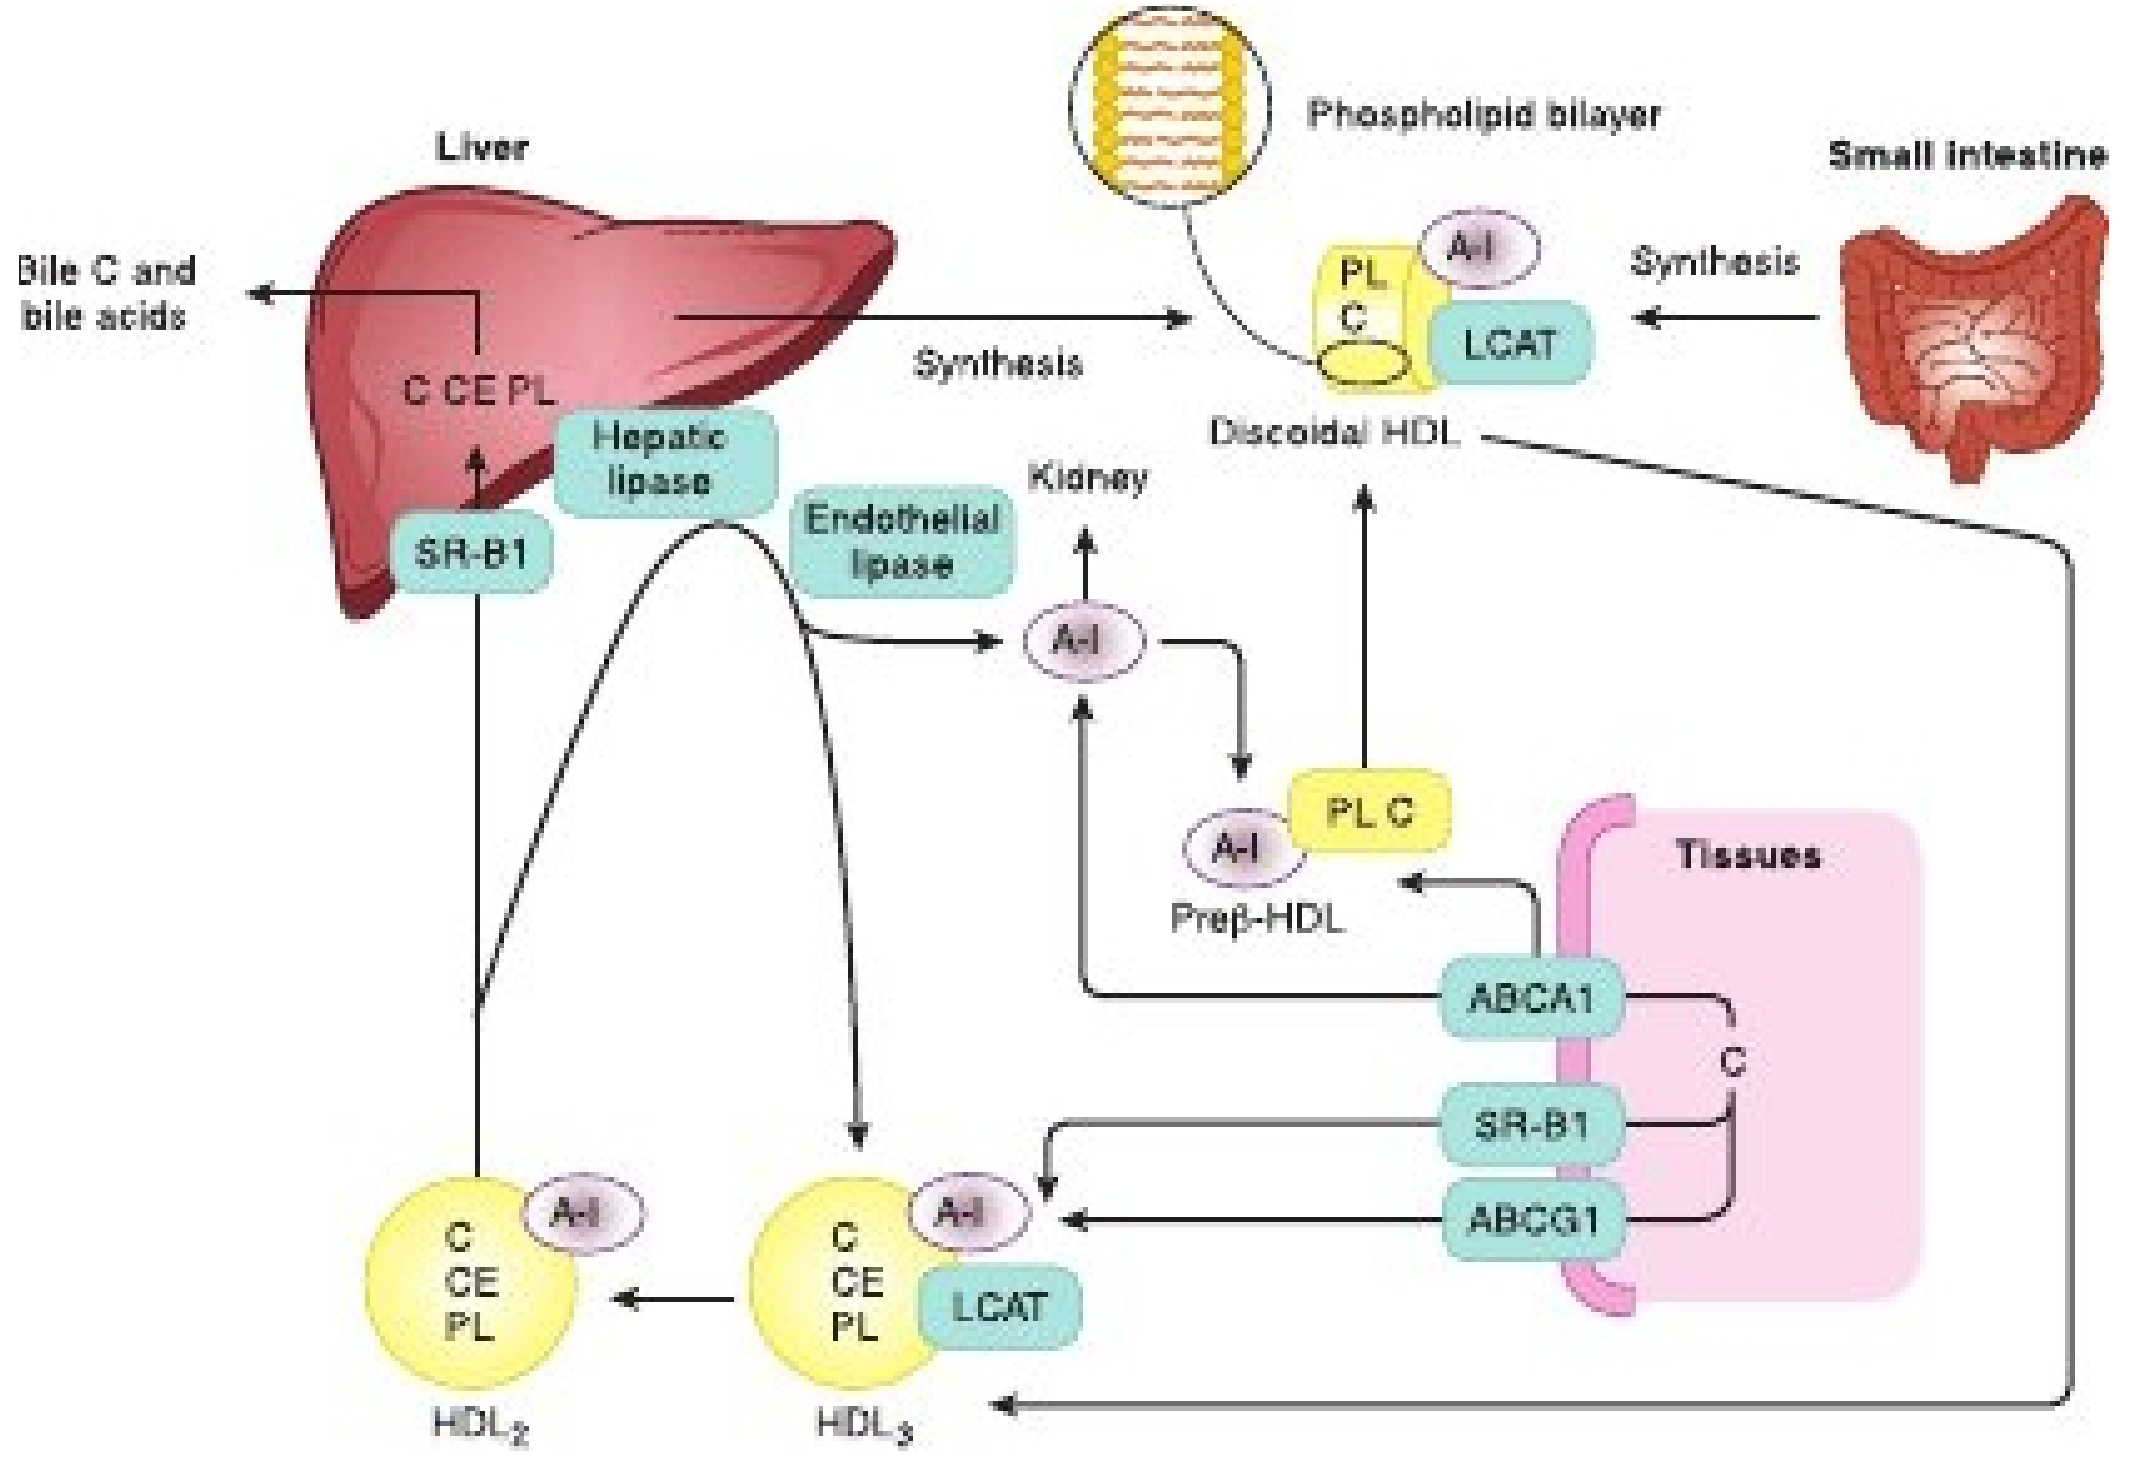
- HDL2 (large, buoyant) ↔ HDL3 (small, dense) - LCAT converts HDL3 → HDL2
- Hepatic lipase converts HDL2 → HDL3 (regenerates small HDL for another cycle)
- ABCA1 - primary efflux pathway (mediates cholesterol efflux from cells to pre-β/nascent HDL); defect in Tangier disease → near-absent HDL, cholesterol accumulates in RES
- ABCG1 - secondary efflux pathway (efflux to mature HDL)
- SR-BI (Scavenger Receptor B1) - hepatic receptor; accepts CE from HDL selectively (without whole particle uptake); HDL particle returned to circulation
- CETP - transfers CE from HDL → VLDL/LDL and TG from VLDL/LDL → HDL; high CETP activity → ↓ HDL (reason why high TG → low HDL often seen together)
PART VII: LIPOPROTEIN(a) [Lp(a)]
- Lp(a) = LDL-like particle with an additional protein Apo(a) linked to ApoB-100 by a disulfide bond
- Apo(a) is structurally homologous to plasminogen → interferes with fibrinolysis → prothrombotic
- Highly atherogenic and thrombogenic
- Levels are genetically determined (90% genetic variance; number of kringle IV repeats in Apo(a) gene)
- Does not respond to statins or diet (unlike LDL)
- Target: Lp(a) < 30 mg/dL (some guidelines <50 nmol/L)
- Emerging therapies: pelacarsen (antisense oligonucleotide targeting Apo(a) mRNA), SLN360
PART VIII: FREDRICKSON-WHO CLASSIFICATION OF HYPERLIPOPROTEINEMIAS
| Type | Popular Name | Elevated Lipoprotein | Elevated Lipids | Defect | Key Clinical Features |
|---|---|---|---|---|---|
| Type I | Familial LPL deficiency / Hyperchylomicronemia | Chylomicrons | TG↑↑↑ (TG >1000 mg/dL) | LPL deficiency OR ApoC-II deficiency | Eruptive xanthomas, acute pancreatitis, lipemia retinalis, hepatosplenomegaly; NO increased CVD risk |
| Type IIa | Familial Hypercholesterolemia (FH) | LDL | Cholesterol↑↑ | LDL receptor defect (FH); ApoB-100 defect (FDB); PCSK9 gain-of-function | Tendon xanthomas (Achilles, extensor), xanthelasma, arcus corneae, premature CAD; autosomal codominant |
| Type IIb | Combined hyperlipidemia | LDL + VLDL | Cholesterol↑ + TG↑ | ↑ ApoB-100 synthesis (↑ VLDL) + ↓ LDL clearance | Tuberous and tendinous xanthomas; increased CVD risk |
| Type III | Familial Dysbetalipoproteinemia / Broad-β disease | IDL (β-VLDL) | Cholesterol↑ + TG↑ (equal) | ApoE2/E2 genotype → impaired remnant clearance (IDL accumulates) | Palmar (xanthoma striata palmaris - PATHOGNOMONIC), tuberous xanthomas; premature PVD + CAD |
| Type IV | Familial Hypertriglyceridemia | VLDL | TG↑↑ | ↑ VLDL synthesis or ↓ clearance | Eruptive xanthomas (sometimes), pancreatitis (if TG very high), no tendon xanthomas; may be secondary to DM, obesity, alcohol |
| Type V | Mixed hypertriglyceridemia | VLDL + Chylomicrons | TG↑↑↑ | Combination defect | Similar to Type I (pancreatitis); eruptive xanthomas; lipemia retinalis |
Key xanthoma-lipoprotein associations:
- Tendon xanthomas (Achilles, extensor tendons, knuckles) = Type IIa (FH)
- Xanthoma striata palmaris (yellowish streaks in palm creases) = Type III (pathognomonic)
- Eruptive xanthomas (crops of small yellow papules on buttocks/back) = Types I, IV, V (very high TG)
- Tuberous/tuberoeruptive (elbows, knees) = Types II, III
- Xanthelasma (periorbital, flat) = Type IIa (but also seen in normolipidemic patients)
- Arcus corneae = normal in elderly; premature (<45 years) suggests FH
PART IX: KEY ENZYMES AND THEIR CLINICAL RELEVANCE
| Condition | Deficient Enzyme/Protein | Accumulated Lipoprotein | Type |
|---|---|---|---|
| Familial LPL deficiency | LPL | Chylomicrons | Type I |
| ApoC-II deficiency | ApoC-II (LPL activator missing) | Chylomicrons | Type I |
| Familial hypercholesterolemia | LDL receptor (heterozygous 1:500; homozygous 1:1,000,000) | LDL | Type IIa |
| Familial defective ApoB-100 | ApoB-100 (Arg3500Gln mutation) | LDL | Type IIa |
| Familial dysbetalipoproteinemia | ApoE2/E2 (poor receptor binding) | IDL/VLDL remnants | Type III |
| Abetalipoproteinemia | MTP (microsomal TG transfer protein) | Cannot form CM or VLDL | Special - no ApoB lipoproteins |
| Tangier disease | ABCA1 transporter | Near-absent HDL; cholesterol in RES | Very low HDL |
| LCAT deficiency | LCAT | Unesterified cholesterol in plasma; corneal opacities, hemolytic anemia | Low HDL |
PART X: MASTER COMPARISON TABLE
| Feature | Chylomicron | VLDL | IDL | LDL | HDL |
|---|---|---|---|---|---|
| Origin | Intestine | Liver | From VLDL | From IDL | Liver + Intestine |
| Structural Apo | ApoB-48 | ApoB-100 | ApoB-100 | ApoB-100 | ApoA-I |
| Density | Lowest | Very low | Intermediate | Low | High |
| TG content | 86% (highest) | 55% | 31% | 10% | 5% |
| Cholesterol+CE | 5% | 19% | 40% | 45% | 30% |
| Protein | 1-2% | 10% | 18% | 25% | 50% (highest) |
| Receptor for clearance | ApoE → LDL-R, LRP-1 (remnant only) | ApoE → LDL-R (IDL direct) | ApoE → LDL-R | ApoB-100 → LDL-R | SR-BI (liver) |
| Key enzyme | LPL (ApoC-II) | LPL (ApoC-II) | Hepatic Lipase | LDL-R, PCSK9 | LCAT (ApoA-I), SR-BI, CETP |
| Function | Transport dietary fat | Transport endogenous TG | Transitional | Deliver cholesterol to cells | Reverse cholesterol transport |
| Atherogenic? | No (too large) | Mildly (small dense VLDL) | Yes (moderately) | YES (major) | ANTI-atherogenic |
| Electrophoresis | Origin | Pre-β | Broad-β | β | α |
PART XI: SUMMARY OF IMPORTANT SIGNALING RELATIONSHIPS
INSULIN (fed state):
↑ LPL activity in adipose → ↑ CM + VLDL clearance → ↓ plasma TG
↑ LDL receptor expression → ↑ LDL clearance
↓ VLDL secretion from liver (inhibits ApoB-100 synthesis)
↑ Fatty acid synthesis → more TG available for VLDL in long run
GLUCAGON / FASTING:
↓ LPL activity in adipose → ↑ plasma TG
↓ LDL receptor → ↑ plasma LDL
↑ VLDL secretion (more FFAs from lipolysis reach liver)
STATINS (HMG-CoA reductase inhibitors):
↓ Liver cholesterol synthesis → ↑ LDL receptor upregulation → ↑ LDL clearance → ↓ plasma LDL
Also ↓ VLDL secretion modestly → ↓ TG modestly
PCSK9 inhibitors (evolocumab, alirocumab):
↑ LDL receptor recycling → ↑ LDL clearance → ↓ LDL 50-70%
FIBRATES (PPARα agonists):
↑ LPL expression → ↑ VLDL hydrolysis → ↓ TG, ↑ HDL
↓ ApoC-III → removes LPL inhibition
NIACIN (nicotinic acid):
↓ VLDL secretion from liver → ↓ TG, ↓ LDL
↑ HDL (↓ ApoA-I catabolism) - most effective drug for ↑ HDL
Describe the structure of DNA Salient features of dna Watson and crick Chargaff rule Types of DNA long answer
DNA double helix structure base pairs Watson Crick diagram
nucleotide structure DNA purine pyrimidine adenine guanine thymine cytosine
STRUCTURE OF DNA, WATSON-CRICK MODEL, CHARGAFF'S RULES, AND TYPES OF DNA
PART I: CHEMICAL COMPOSITION OF DNA
1. The Nucleotide - Basic Unit
NUCLEOTIDE = Nitrogenous Base + Pentose Sugar + Phosphate Group
| Component | Details |
|---|---|
| Nitrogenous Base | 4 types: Adenine, Guanine, Cytosine, Thymine |
| Pentose Sugar | 2'-Deoxyribose (lacks -OH at C2'; distinguishes DNA from RNA) |
| Phosphate Group | One or more phosphate groups; negatively charged at physiological pH |
- Base is attached to C1' of deoxyribose via an N-glycosidic bond (β-N-glycosidic bond; N9 of purines, N1 of pyrimidines)
- Phosphate group attaches to C5' of sugar
- Nucleotides link via 3',5'-phosphodiester bonds to form the backbone
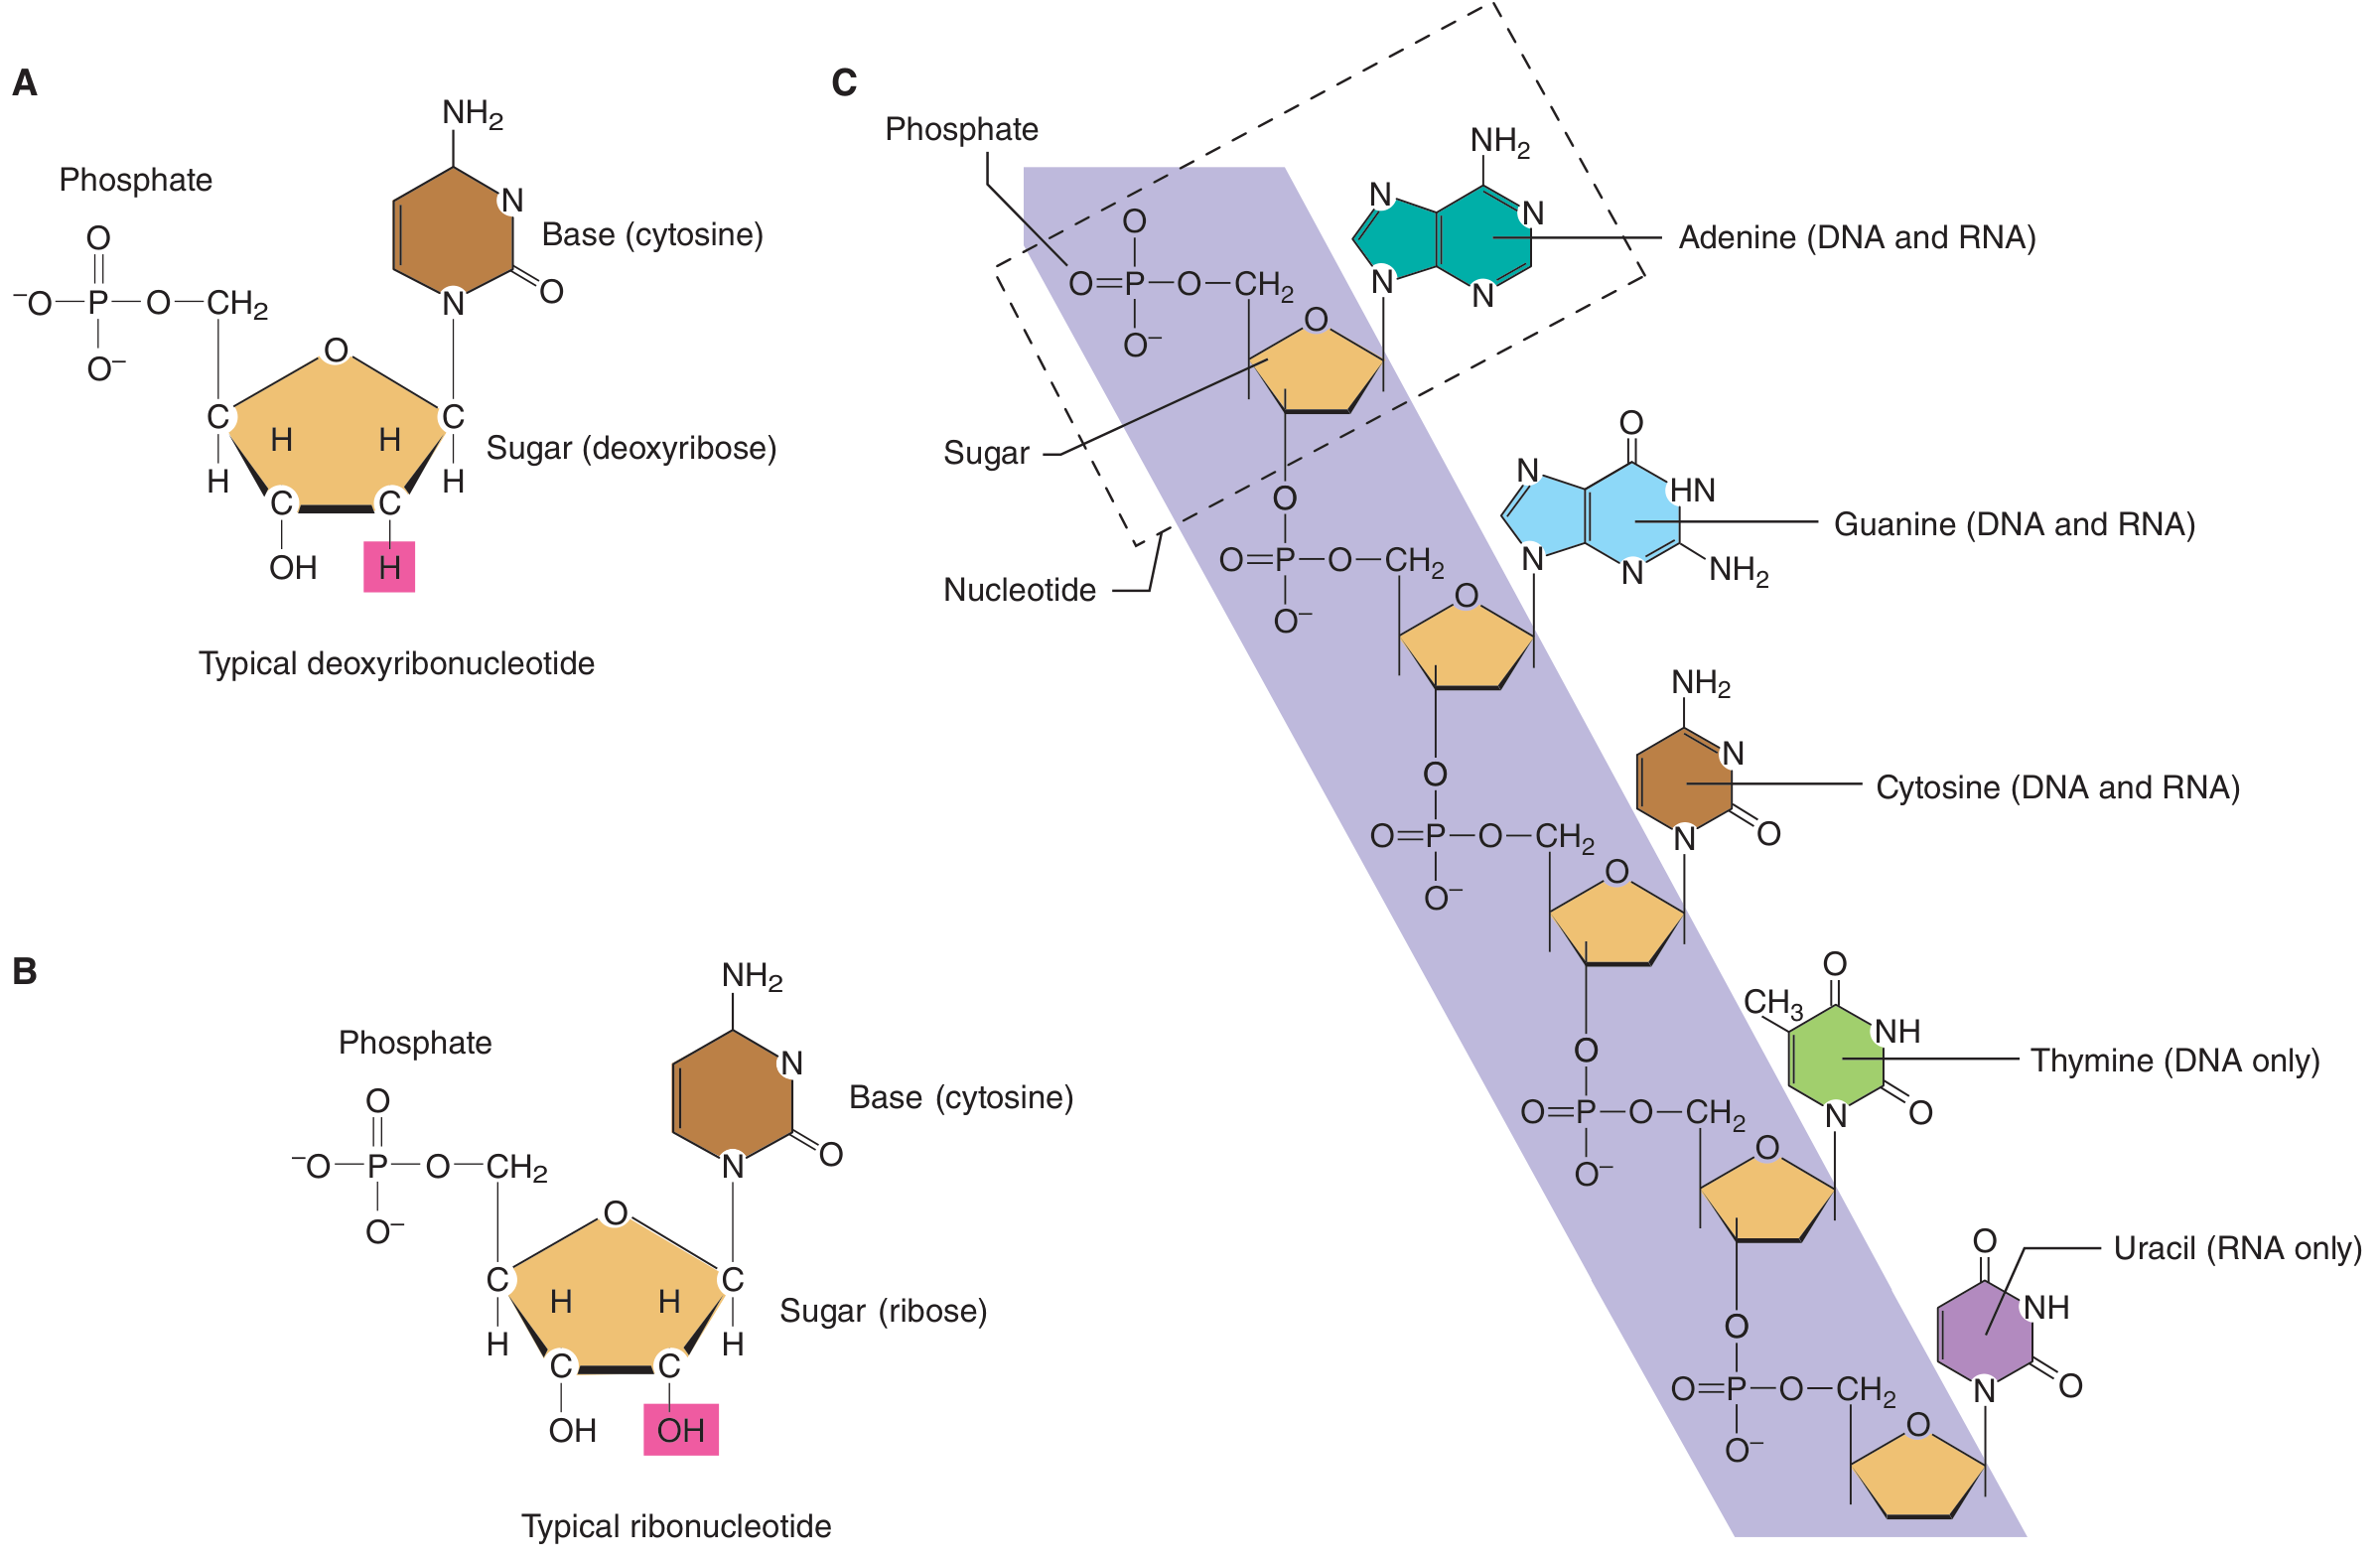
2. Nitrogenous Bases
PURINES (Double ring: pyrimidine fused to imidazole ring)
| Purine | Single Letter | H-bond donor/acceptor | Pairs with |
|---|---|---|---|
| Adenine (A) | A | 2 H-bonds | Thymine (T) |
| Guanine (G) | G | 3 H-bonds | Cytosine (C) |
PYRIMIDINES (Single ring: 6-membered only)
| Pyrimidine | Single Letter | H-bonds | Pairs with |
|---|---|---|---|
| Cytosine (C) | C | 3 H-bonds | Guanine (G) |
| Thymine (T) | T | 2 H-bonds | Adenine (A) |
| Uracil (U) | U | 2 H-bonds | RNA only; replaces thymine |
- PURine = PURine contains 2 rings (like the 2 syllables in "PURine")
- CUT the PY: Pyrimidines = Cytosine, Uracil, Thymine
- A-T 2 bonds; G-C 3 bonds (G-C stronger; ↑ G-C content → higher melting temperature Tm)
3. The DNA Backbone
5' ─── [Phosphate]─[Sugar]─[Base]
|
3'-5' phosphodiester bond
|
[Phosphate]─[Sugar]─[Base]
|
[Phosphate]─[Sugar]─[Base] ─── 3'
- A free 5'-phosphate end (5' end)
- A free 3'-hydroxyl end (3' end)
- This gives the strand directionality (polarity)
PART II: WATSON-CRICK MODEL (1953)
Historical Context
- Chargaff's rules (1950) - base equivalences
- X-ray diffraction data by Rosalind Franklin and Maurice Wilkins - revealed helical nature, pitch, and dimensions
- Pauling and Corey's α-helix and β-sheet models - showed how to model complex molecules
- Astbury's early X-ray data - initial evidence of repeating units
SALIENT FEATURES OF THE WATSON-CRICK MODEL (B-DNA)
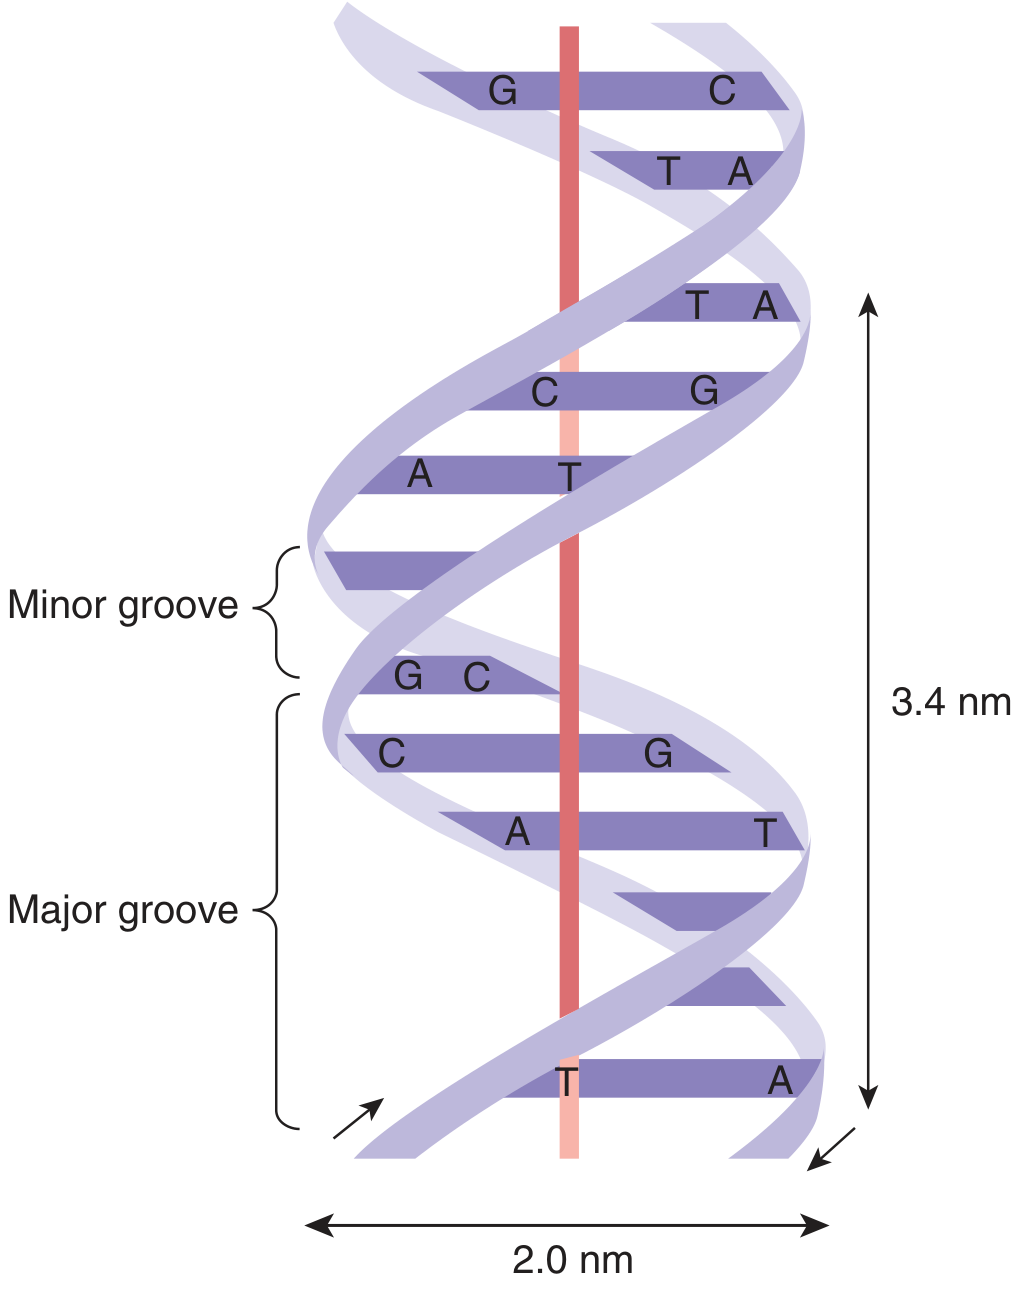
1. DOUBLE-STRANDED POLYNUCLEOTIDE CHAIN
- DNA consists of two polynucleotide chains (strands) wound around each other
- Each strand is a polymer of deoxyribonucleotides linked by 3',5'-phosphodiester bonds
- Both strands together form the double helix
2. ANTIPARALLEL ORIENTATION (Antiparallel Complementarity)
- The two strands run in opposite (antiparallel) directions
- If one strand runs 5'→3' (left to right), the complementary strand runs 3'→5' (left to right)
- This is essential for DNA polymerase function (all polymerases add nucleotides 5'→3')
5' ─── A–T–G–C–G–A ─── 3' (strand 1)
| | | | | |
3' ─── T–A–C–G–C–T ─── 5' (strand 2, antiparallel)
3. RIGHT-HANDED HELIX
- The helix coils in the clockwise (right-handed) direction when viewed from either end
- Like a standard right-handed screw
- Exception: Z-DNA is left-handed
4. BASE PAIRING (Complementarity) - Chargaff's Rules Applied
- Purines pair only with pyrimidines (prevents structural distortion)
- A pairs with T via 2 hydrogen bonds
- G pairs with C via 3 hydrogen bonds
- These are called Watson-Crick base pairs
- Base pairing is specific - enforces the complementarity rule (template for replication)
5. HELIX DIMENSIONS (B-DNA)
| Parameter | Value | Significance |
|---|---|---|
| Diameter | 2.0 nm (20 Å) | Constant throughout; allows electron microscopy |
| Pitch (rise per turn) | 3.4 nm (34 Å) | Distance along axis per complete turn |
| Base pairs per turn | 10 bp per turn (actually 10.5 in solution) | Key structural parameter |
| Rise per base pair | 0.34 nm (3.4 Å) | Consistent stacking distance |
| Angle of rotation per base pair | 36° | 10 bp × 36° = 360° = 1 full turn |
6. MAJOR AND MINOR GROOVES
- The two strands do not divide the helix into equal halves → creates two spiral grooves:
- Major groove (wider, deeper): ~2.2 nm wide; most protein-DNA interactions occur here; DNA-binding proteins, transcription factors, and restriction enzymes read the sequence from the major groove
- Minor groove (narrower, shallower): ~1.2 nm wide; some drugs (e.g., netropsin, distamycin) bind here; also TATA-box binding protein (TBP) binds minor groove
7. BASES INSIDE, BACKBONE OUTSIDE
- Nitrogenous bases are located on the inside of the helix (face inward)
- Sugar-phosphate backbone is on the outside (faces the aqueous environment; negatively charged phosphates interact with water and cations)
- This arrangement protects the genetic information from chemical attack
8. BASE STACKING FORCES
- In addition to hydrogen bonds, the bases are stacked perpendicular to the helix axis
- Hydrophobic stacking interactions (van der Waals + hydrophobic) between adjacent base pairs are a major stabilizing force (more important than H-bonds alone)
- Bases are planar and aromatic → π-π stacking interactions
- This is why denatured DNA (separated strands) has higher UV absorbance (hyperchromic effect) - base stacking quenches UV absorption
9. COMPLEMENTARITY AS BASIS FOR REPLICATION
- The sequence of one strand completely determines the sequence of the other
- This was the key insight: "It has not escaped our notice that the specific pairing we have postulated immediately suggests a possible copying mechanism for the genetic material." - Watson and Crick, 1953
- Each strand serves as a template for synthesis of a new complementary strand → semi-conservative replication (Meselson-Stahl experiment, 1958)
10. STABILITY FACTORS
| Force | Role |
|---|---|
| Hydrogen bonds (A-T: 2; G-C: 3) | Specific pairing; contributes to stability |
| Base stacking (hydrophobic + van der Waals) | Major stabilizing force; perpendicular to helix axis |
| Ionic interactions | Cations (Mg²⁺, polyamines like spermine/spermidine) neutralize negative phosphate backbone charges |
| Hydration shell | Ordered water molecules around backbone |
PART III: CHARGAFF'S RULES
Background
Chargaff's First Rule (Quantitative / Molar Equivalence Rule)
- [A] = [T] (moles of Adenine = moles of Thymine)
- [G] = [C] (moles of Guanine = moles of Cytosine)
- [Purines] = [Pyrimidines] (i.e., [A + G] = [T + C])
- The ratio (A+T)/(G+C) is constant for a given species but varies between species
| Species | %A | %T | %G | %C | A/T ratio | G/C ratio |
|---|---|---|---|---|---|---|
| E. coli | 24.7 | 23.6 | 26.0 | 25.7 | 1.04 | 1.01 |
| Yeast | 31.3 | 32.9 | 18.7 | 17.1 | 0.95 | 1.09 |
| Human liver | 30.3 | 30.3 | 19.5 | 19.9 | 1.00 | 0.98 |
| Sea urchin | 32.8 | 32.1 | 17.7 | 18.4 | 1.02 | 0.96 |
Chargaff's Derived Formula
A + G + T + C = 100% (total)
Since A = T and G = C:
2A + 2G = 100%
A + G = 50% → Purines = 50% always
Also: (A + T) / (G + C) = varies by species
If A% is known:
T = A
G = C = (100 - 2A) / 2 = 50 - A
If A = 30%, then T = 30%, G = 20%, C = 20% A + T = 60%; G + C = 40% (A+T)/(G+C) = 60/40 = 1.5 (AT-rich DNA)
Chargaff's Second Rule (Strand Symmetry)
Significance of Chargaff's Rules
| Significance | Detail |
|---|---|
| Proved specific base pairing | A:T and G:C pairing is not random; led directly to Watson-Crick model |
| Disproved tetranucleotide hypothesis | (A+G+C+T) are NOT necessarily equal to each other; different species have different compositions |
| Basis of species identification | (A+T)/(G+C) ratio is characteristic of each species ("G+C content" is a taxonomic marker) |
| G+C content and Tm | ↑ G-C content → ↑ Tm (melting temperature) because G-C has 3 H-bonds vs A-T's 2 |
| Antiparallel complementarity | The two strands are complementary, not identical; A on one strand across from T on the other |
Calculation of Tm from G+C Content:
Tm (°C) = 69.3 + 0.41 × (% G + C content)
PART IV: TYPES OF DNA
A. BASED ON CONFORMATIONAL FORMS (Watson-Crick Forms)
| Parameter | B-DNA | A-DNA | Z-DNA |
|---|---|---|---|
| Handedness | Right-handed | Right-handed | Left-handed |
| Helix diameter | 2.0 nm | 2.3 nm | 1.8 nm |
| Base pairs/turn | 10 | 11 | 12 |
| Rise per bp | 3.4 Å | 2.6 Å | 3.7 Å |
| Pitch (per turn) | 34 Å | 28 Å | 45 Å |
| Major groove | Wide, deep | Narrow, deep | Flat (nearly absent) |
| Minor groove | Narrow, shallow | Wide, shallow | Narrow, deep |
| Conditions | Physiological (92% humidity) | Dehydrated (75% humidity); double-stranded RNA; RNA-DNA hybrid | Alternating GC sequences; high ionic strength; negative supercoiling |
| Sugar conformation | C2'-endo | C3'-endo | Alternates C3'-endo (G) and C2'-endo (C) |
| Glycosidic bond | Anti | Anti | Alternates anti (C) and syn (G) |
| Biological relevance | Most common physiological form; basis of Watson-Crick model | Active form of double-stranded RNA; RNA-DNA hybrids during transcription | May be transiently formed after transcription; role in gene regulation; Z-DNA binding proteins (ADAR1); potential immune sensing |
- B = Biological / most common / in vivo
- A = Alternative / found in dehydrating conditions, RNA
- Z = Zig-zag backbone / left-handed / forms in GC repeats
B. BASED ON LOCATION IN CELL
| Type | Location | Properties |
|---|---|---|
| Nuclear DNA (nDNA) | Cell nucleus | Linear; 3 × 10⁹ bp (haploid human genome); associated with histones; organized into 23 pairs of chromosomes (diploid = 46) |
| Mitochondrial DNA (mtDNA) | Mitochondrial matrix | Circular, double-stranded, naked (no histones); 16,569 bp; 37 genes (13 proteins, 22 tRNA, 2 rRNA); maternally inherited; multiple copies per mitochondrion (2-10); higher mutation rate (10× nuclear DNA); D-loop region for replication/transcription |
| Chloroplast DNA (cpDNA) | Chloroplasts (plants) | Circular; ~120-160 kb; also called plastome |
C. BASED ON TOPOLOGY / SUPERCOILING
| Type | Description | Relevance |
|---|---|---|
| Relaxed (open circular) DNA | No supercoiling; all turns as expected | Intermediate during replication/repair |
| Negatively supercoiled DNA | Underwound (fewer turns than relaxed B-DNA) | Most DNA in vivo is negatively supercoiled (bacteria, eukaryotic) → facilitates strand separation for replication and transcription |
| Positively supercoiled DNA | Overwound (more turns than relaxed) | Forms ahead of replication fork; must be relieved |
| Covalently closed circular (CCC) DNA | Bacterial chromosomes; plasmids; mitochondrial DNA; no free ends | Supercoiling is topologically constrained |
| Linear DNA | Eukaryotic nuclear chromosomes; ends capped by telomeres | Free ends; supercoiling not topologically constrained |
| Enzyme | Class | Action | Inhibitor (clinically relevant) |
|---|---|---|---|
| Topoisomerase I | Type I | Cuts one strand; relieves torsional stress; re-ligates; changes Lk by ±1 | Camptothecin, irinotecan, topotecan (anticancer) |
| DNA gyrase (Topoisomerase II in bacteria) | Type II | Cuts both strands; introduces negative supercoils (ATP-dependent); decatenates replicated chromosomes | Fluoroquinolones (ciprofloxacin, norfloxacin) → bacterial gyrase; anticancer topoisomerase II inhibitors (etoposide, doxorubicin) |
| Topoisomerase II (eukaryotic) | Type II | Relaxes supercoils, decatenates | Etoposide, doxorubicin (anticancer) |
D. BASED ON SEQUENCE COMPLEXITY (Reassociation Kinetics - C₀t Analysis)
| Class | % of Human Genome | Characteristics | Examples |
|---|---|---|---|
| Highly repetitive (satellite) DNA | ~10-15% | Reassociates fastest (low C₀t); short sequences (5-200 bp) repeated millions of times; mostly NOT transcribed; found at centromeres, telomeres | Satellite DNA, α-satellite (centromeres), telomeric repeats (TTAGGG)n |
| Moderately repetitive DNA | ~25-40% | Intermediate C₀t; 100-100,000 copies per genome | rRNA genes, tRNA genes, histone genes; SINEs (Alu, ~300 bp, ~1 million copies); LINEs (L1, ~6 kb, ~500,000 copies) |
| Single-copy (unique sequence) DNA | ~40-70% | Reassociates slowest (high C₀t); most protein-coding genes | Structural genes, most exons |
E. BASED ON STRUCTURE IN EUKARYOTES (Chromatin Organization)
DNA double helix (2 nm)
↓ [wrapping around histone octamer]
Nucleosome + linker DNA = "beads on a string" (10 nm fiber)
↓ [folding, histone H1 binding]
Solenoid (30 nm fiber) = 6 nucleosomes per turn
↓ [looped domains attached to nuclear scaffold]
Chromatin loops / rosettes (300 nm)
↓ [further coiling/condensation]
Metaphase chromosome (700-1400 nm)
- Core particle: 146 bp of DNA wound 1.75 times around a histone octamer (2 copies each of H2A, H2B, H3, H4)
- Linker DNA: ~20-80 bp connecting adjacent nucleosomes (associated with histone H1)
- Nucleosome = core particle + linker DNA + linker histone H1 = ~200 bp total
- Histones are basic proteins (rich in Lys and Arg → positively charged) → bind negatively charged DNA backbone
| Type | State | Location | Transcription |
|---|---|---|---|
| Euchromatin | Loosely packed; less condensed | Dispersed in nucleus | Transcriptionally active |
| Heterochromatin | Tightly packed; condensed | Near nuclear envelope, centromeres | Transcriptionally inactive |
| Constitutive heterochromatin | Permanently condensed | Centromeres, telomeres, pericentromeric regions | Never transcribed (structural DNA) |
| Facultative heterochromatin | Can be either form | e.g., inactive X chromosome (Barr body) | Inactivated conditionally (e.g., X-inactivation by XIST RNA) |
F. OTHER SPECIAL DNA TYPES
| Type | Description |
|---|---|
| Palindromic DNA | Sequence reads the same 5'→3' on both strands; recognized by restriction endonucleases; forms hairpin/cruciform structures |
| Telomeric DNA | TTAGGG repeats (humans); caps chromosome ends; maintained by telomerase (reverse transcriptase with RNA template); erodes with cell division → cellular aging (Hayflick limit) |
| cDNA (complementary DNA) | Synthesized from mRNA using reverse transcriptase; used in recombinant DNA technology |
| G-quadruplex DNA | Four-stranded structure formed by G-rich sequences (telomeres, oncogene promoters); G-tetrads linked by Hoogsteen bonding; potential anticancer target |
| Triplex DNA (H-DNA) | Third strand in major groove via Hoogsteen H-bonds; forms at polypurine-polypyrimidine tracts; potential role in gene regulation |
| Cruciform DNA | Cross-shaped structure formed at inverted palindromic sequences under torsional stress |
PART V: DENATURATION AND RENATURATION OF DNA
| Process | Definition | Mechanism |
|---|---|---|
| Denaturation (melting) | Separation of two strands into single strands by disrupting H-bonds and base stacking | Heat, alkali (NaOH), organic solvents (formamide), extremes of pH |
| Tm (Melting Temperature) | Temperature at which 50% of DNA is denatured | Depends on G+C content (G-C has 3 H-bonds): ↑ G+C → ↑ Tm |
| Hyperchromic effect | ↑ UV absorbance at 260 nm upon denaturation | Base stacking quenches absorbance in dsDNA; single strands absorb more |
| Renaturation (annealing) | Re-association of complementary strands when temperature lowered slowly | Requires complementary sequences; basis of Southern blotting, FISH, PCR |
| Hybridization | Annealing of complementary sequences from different sources | Cross-species hybridization; DNA-RNA hybrid; basis of Northern/Southern blotting |
MASTER SUMMARY TABLES
Comparison of DNA Types (Conformational Forms)
| Feature | B-DNA | A-DNA | Z-DNA |
|---|---|---|---|
| Handedness | Right | Right | Left |
| bp/turn | 10 | 11 | 12 |
| Rise/bp | 3.4 Å | 2.6 Å | 3.7 Å |
| Diameter | 20 Å | 23 Å | 18 Å |
| Major groove | Wide, deep | Narrow, deep | Flat |
| Minor groove | Narrow, shallow | Wide, shallow | Narrow, deep |
| Sugar pucker | C2'-endo | C3'-endo | Alternating |
| Glycosidic | Anti | Anti | Alternating syn/anti |
Watson-Crick B-DNA - Key Numbers for Exams
| Parameter | Value |
|---|---|
| Diameter | 2 nm (20 Å) |
| Pitch per turn | 3.4 nm (34 Å) |
| Base pairs per turn | 10 bp |
| Rise per base pair | 3.4 Å |
| A-T hydrogen bonds | 2 |
| G-C hydrogen bonds | 3 |
| Rotation per base pair | 36° |
| Human haploid genome | 3 × 10⁹ bp |
| Total DNA length (diploid human cell) | ~2 meters (6 × 10⁹ bp) |
| Chromosomes (diploid) | 46 |
| Protein-coding genes | ~20,000-25,000 |
Chargaff's Rules - Summary
A = T | G = C | (A + G) = (T + C) = 50%
A/T = 1 | G/C = 1 | Purines = Pyrimidines
(A+T)/(G+C) = species-specific AT:GC ratio
Enumerate types of rna write about mRNA +-rna rRNA (3+3+3+3)
TYPES OF RNA
PART I: ENUMERATION OF RNA TYPES
- Single-stranded (mostly), though it forms extensive intramolecular secondary structures
- Contains ribose (C2'-OH present, unlike deoxyribose)
- Contains Uracil instead of Thymine (no methyl group at C5 of pyrimidine)
MAJOR / CLASSICAL TYPES:
| # | Type | Full Name | % of total cell RNA | Function |
|---|---|---|---|---|
| 1 | rRNA | Ribosomal RNA | ~80-85% | Structural + catalytic component of ribosomes |
| 2 | tRNA | Transfer RNA | ~10-15% | Amino acid carrier; decodes mRNA codons |
| 3 | mRNA | Messenger RNA | ~1-5% | Carries genetic info from DNA to ribosome; template for protein synthesis |
| 4 | hnRNA | Heterogeneous nuclear RNA | Variable | Pre-mRNA; primary transcript before processing |
SMALL NUCLEAR AND REGULATORY RNA TYPES:
| # | Type | Full Name | Size | Function |
|---|---|---|---|---|
| 5 | snRNA | Small nuclear RNA | ~100-300 nt | Component of spliceosome (U1, U2, U4, U5, U6); pre-mRNA splicing |
| 6 | snoRNA | Small nucleolar RNA | ~60-300 nt | Guides rRNA modifications (methylation, pseudouridylation) in nucleolus |
| 7 | miRNA | MicroRNA | ~22 nt | Post-transcriptional gene silencing (binds 3'-UTR of mRNA) |
| 8 | siRNA | Small interfering RNA | ~21-23 nt | RNA interference (RNAi); sequence-specific mRNA degradation |
| 9 | lncRNA | Long non-coding RNA | >200 nt | Gene regulation; X-inactivation (XIST), imprinting, chromatin remodeling |
| 10 | piRNA | PIWI-interacting RNA | ~26-31 nt | Silences transposons in germline |
| 11 | scRNA | Small cytoplasmic RNA | Variable | SRP (7SL RNA): protein targeting to ER |
| 12 | Ribozyme | Catalytic RNA | Variable | Self-splicing introns (Group I, II); RNA as enzyme; e.g., ribonuclease P, ribosomal peptidyl transferase (23S/28S rRNA) |
PART II: mRNA (MESSENGER RNA)
1. STRUCTURE OF mRNA
A. Prokaryotic mRNA Structure
5'───[5'-triphosphate]──[Shine-Dalgarno sequence]──[AUG]──[Coding region]──[Stop codon]──[3'-OH]───3'
| Component | Details |
|---|---|
| 5'-triphosphate end | Free 5'-triphosphate (no cap); can be cleaved by RNase |
| Shine-Dalgarno (SD) sequence | Purine-rich sequence ~5-10 nt upstream of AUG; base-pairs with 16S rRNA of 30S subunit; positions ribosome for translation initiation |
| AUG start codon | Initiator codon; codes for formyl-methionine (fMet) in prokaryotes |
| Coding region | Sequence of codons (triplets) encoding the polypeptide |
| Stop codons | UAA ("ochre"), UAG ("amber"), UGA ("opal/umber") |
| 3'-OH end | Free 3'-hydroxyl |
| Polycistronic | One mRNA may contain coding sequences for multiple proteins |
B. Eukaryotic mRNA Structure (Mature/Processed)
5'─[7-methylguanosine CAP]─[5'-UTR]─[AUG]─[Coding sequence / ORF]─[Stop codon]─[3'-UTR]─[AAAAAAA(n) Poly-A tail]─3'
| Component | Details |
|---|---|
| 5' Cap (7-methylguanosine) | m7GpppN; added to 5' end via unusual 5'→5' triphosphate linkage; added by guanylyltransferase; methylated by guanine-7-methyltransferase using SAM as methyl donor |
| 5'-UTR (Untranslated Region) | Upstream of AUG; contains Kozak consensus sequence (GCC(A/G)CCAUGG); involved in ribosome binding |
| AUG Start codon | Initiates translation; codes for methionine (Met) in eukaryotes |
| Coding sequence (ORF) | Open Reading Frame; codons from AUG to stop codon |
| Stop codon | UAA, UAG, or UGA |
| 3'-UTR | Downstream of stop codon; contains regulatory elements; miRNA binding sites; AUUUA destabilizing sequences (Shaw-Kamen sequence) |
| Poly-A tail | 100-250 adenine residues added post-transcriptionally by poly-A polymerase after cleavage signal (AAUAAA); not encoded in DNA; added in nucleus |
| Element | Functions |
|---|---|
| 5' Cap | (1) Protects from 5'→3' exonuclease degradation; (2) Recognized by eIF-4E (cap-binding initiation factor) → promotes ribosome recruitment; (3) Facilitates nuclear export; (4) Promotes mRNA circularization (interacts with poly-A binding protein) |
| Poly-A tail | (1) Protects from 3'→5' exonuclease; (2) Stabilizes mRNA; (3) Facilitates nuclear export; (4) Stimulates translation; (5) PABP (poly-A binding protein) recruits eIF-4G → circularization |
| 5'-UTR / Kozak | Ribosome scanning and AUG recognition |
| 3'-UTR | mRNA stability regulation; miRNA binding; localization signals |
2. PROCESSING OF mRNA (Eukaryotic: hnRNA → Mature mRNA)
Step 1: 5'-Capping (Co-transcriptional; earliest event)
Pre-mRNA: 5'-pppN...
↓ [Remove γ-phosphate → 5'-ppN]
↓ [Guanylyltransferase: add GMP via 5'→5' bond → GpppN-mRNA]
↓ [Guanine-7-methyltransferase (SAM donor): add methyl to N7 of G]
→ 7-methylguanosine cap: m7GpppN-mRNA
- Occurs when transcript is ~25-30 nt long
- All 3 steps occur co-transcriptionally in the nucleus
Step 2: 3'-Polyadenylation
Pre-mRNA: ...coding region...3'-UTR...AAUAAA...GU-rich region...3'
↓ [Endonuclease cleaves ~10-30 nt downstream of AAUAAA]
↓ [Poly-A polymerase (PAP) adds ~200-250 A residues to 3'-OH]
→ ...3'-UTR...AAUAAA...AAAAAAA(n) - 3'OH
Step 3: Splicing (Intron Removal)
- Eukaryotic pre-mRNA contains introns (non-coding intervening sequences) and exons (expressed sequences)
- Introns are removed by the spliceosome (U1, U2, U4, U5, U6 snRNP particles)
- Mechanism:
- U1 snRNP binds 5' splice donor site (consensus: GU)
- U2 snRNP binds branch point A (~30 nt upstream of 3' end of intron)
- U4, U5, U6 join → complete spliceosome
- 2'-OH of branch point A attacks 5' splice site → lariat intermediate forms
- Free 3'-OH of exon 1 attacks 3' splice site (consensus: AG) → exons joined; intron released as lariat
- Lariat degraded (or gives rise to ncRNA like snoRNA)
- 5' donor site: GU (always)
- 3' acceptor site: AG (always)
- Branch point: internal A
- Rule: "GU-AG rule" (Chambon's rule)
3. FUNCTIONS OF mRNA
| Function | Details |
|---|---|
| Template for protein synthesis (primary function) | Provides the codon sequence (triplet code) read by ribosomes; each codon specifies one amino acid |
| Carrier of genetic information | Carries information from DNA (in nucleus) to ribosomes (in cytoplasm); the "middleman" in the Central Dogma: DNA → mRNA → Protein |
| Unit of gene expression | Each protein-coding gene is expressed via a specific mRNA; mRNA level determines protein level |
| Alternative splicing | Same pre-mRNA can be spliced differently → multiple protein isoforms from a single gene (e.g., fibronectin, calcitonin/CGRP) |
| RNA editing | Sequence alteration post-transcriptionally (e.g., C→U editing: ApoB-100 → ApoB-48 in intestine; A→I editing by ADAR) |
| Regulation of gene expression | mRNA stability (half-life from minutes to hours) controls protein level; miRNA targets 3'-UTR |
| Non-coding functions | Some mRNAs serve as miRNA "sponges" (competing endogenous RNAs, ceRNA) |
| Property | Details |
|---|---|
| Triplet | 3 nucleotides = 1 codon → 4³ = 64 codons |
| Degenerate (redundant) | Multiple codons can code for same amino acid (e.g., 6 for Leu) |
| Non-overlapping | Each nucleotide belongs to only one codon |
| Commaless | No punctuation between codons; read continuously |
| Universal | Same code in nearly all organisms (with minor exceptions: mitochondria, some protists) |
| Start codon | AUG (Met/fMet) |
| Stop codons | UAA, UAG, UGA (3 stop codons; no amino acid; recognized by release factors) |
PART III: tRNA (TRANSFER RNA)
1. STRUCTURE OF tRNA
A. Primary Structure (Sequence)
- Single-stranded RNA, ~73-93 nucleotides
- Extensively modified bases (more than any other RNA)
- Contains many unusual/modified bases: dihydrouracil (D), pseudouracil (ψ), inosine (I), ribothymidine (T), methylinosine, methylguanosine - give tRNA unique identity
- Always ends in ...CCA-3'-OH at 3' acceptor terminus (added post-transcriptionally by CCA-adding enzyme / nucleotidyltransferase; not encoded in gene)
- Always begins with 5'-G (pG)
B. Secondary Structure: Cloverleaf (2D)
5'-G──────────────────────────────── 3'-CCA
| |
|←── Acceptor stem (7 bp) ──────────|
| (amino acid attaches here)
↓
┌─────────┐
│ D-loop │ ← Contains dihydrouridine (D)
│ (8-12 nt)│ Binds aminoacyl-tRNA synthetase
└─────────┘
|
┌──────────────┐
│ Anticodon loop│ ← 7-nt loop; middle 3 nt = ANTICODON
│ (7 nt) │ Pairs with mRNA codon (antiparallel)
└──────────────┘
|
┌─────────┐
│ T-loop │ ← Contains ribothymidine (T) and pseudouridine (ψ)
│ (TψC loop)│ Binds ribosome (interacts with 5S rRNA)
└─────────┘
|
[Variable loop] ← Size varies (3-21 nt); distinguishes Class I vs Class II tRNA
| Arm/Loop | Nucleotides | Modified Bases | Function |
|---|---|---|---|
| Acceptor stem | 7 bp helix + 4 nt 3' overhang (CCA) | - | Amino acid attachment site; AA attached to 3'-OH of terminal A (CCA-3') |
| D-arm (DHU loop) | 3-4 bp stem + 8-12 nt loop | Dihydrouridine (D) | Recognition site for aminoacyl-tRNA synthetase |
| Anticodon arm | 5 bp stem + 7 nt loop | Inosine (I) at position 34 | Contains anticodon (positions 34, 35, 36); base-pairs with mRNA codon; wobble position = position 34 |
| TψC arm (T-loop) | 5 bp stem + 7 nt loop | Ribothymidine (T), Pseudouridine (ψ), Cytidine | Interacts with 50S/60S ribosomal subunit (5S rRNA); required for ribosome binding |
| Variable loop | 3-21 nt | - | Size distinguishes tRNA classes; Class I (small, 3-5 nt), Class II (large, 13-21 nt) |
C. Tertiary Structure: L-Shaped (3D)
┌─ Acceptor stem (3'-CCA-NH₂ acid)
Amino│
acid│
arm │
└───────────────────┐
│
T-loop │ ← ~7.5 nm arm
│
└────── Anticodon loop ← ~7.5 nm arm
│
A-A-A (anticodon)
- Two arms of ~7.5 nm each form the L
- Acceptor end (3'-CCA) and TψC loop form one arm
- Anticodon loop and D-loop form the other arm
- The corner of the L is formed by D-loop and TψC loop interactions (via conserved G-C pairs)
- The anticodon end and the amino acid attachment end are at opposite poles (~7.5 nm apart)
- This spatial separation allows simultaneous codon reading AND peptide bond formation
2. CHARGING OF tRNA (Aminoacylation)
Step 1: Amino acid activation
Amino acid + ATP ──[aaRS]──> Aminoacyl-AMP + PPi
(enzyme-bound; PPi hydrolyzed by pyrophosphatase → irreversible)
Step 2: Transfer to tRNA
Aminoacyl-AMP + tRNA ──[aaRS]──> Aminoacyl-tRNA + AMP
(AA attached to 2'-OH or 3'-OH of terminal A of CCA via high-energy ester bond)
Net: Amino acid + tRNA + ATP → Aminoacyl-tRNA + AMP + 2Pi
(Costs 2 high-energy bonds = 2 ATP equivalents)
- 20 different aminoacyl-tRNA synthetases (one per amino acid)
- Each aaRS recognizes its specific amino acid AND all cognate tRNAs
- Identity elements (specific bases in D-loop, anticodon, discriminator base N73) allow aaRS to recognize correct tRNA
- aaRS has proofreading (editing) activity - hydrolyzes misaminoacylated tRNAs; ensures ~1 error per 10,000 charging events
- The D-loop is the primary recognition site for aaRS binding
3. FUNCTIONS OF tRNA
| Function | Details |
|---|---|
| Adaptor molecule (primary function) | Bridges mRNA codon and amino acid; translates the nucleotide sequence of mRNA into amino acid sequence of protein |
| Amino acid transport | Carries activated (charged) amino acid to ribosome in the form of aminoacyl-tRNA; delivered to A site (aminoacyl site) |
| Initiator tRNA | Special initiator tRNA (tRNA-i^Met in eukaryotes; tRNA-f^Met in prokaryotes) carries methionine/formylmethionine; recognizes AUG start codon at P site |
| Wobble base pairing | Position 34 of anticodon (wobble position) can pair with multiple 3rd-codon nucleotides (e.g., inosine at position 34 pairs with U, C, or A) → one tRNA can recognize multiple synonymous codons; explains why 61 codons can be read by fewer than 61 tRNAs |
| Peptide bond formation | The peptidyl-tRNA in the P site donates its peptide chain to the aminoacyl-tRNA in the A site → peptide bond formation (catalyzed by 23S/28S rRNA - a ribozyme) |
| Reading frame maintenance | Each tRNA moves exactly 3 nt through the ribosome per elongation cycle |
| Non-translational roles | Some aminoacyl-tRNAs serve as substrates for non-ribosomal peptide synthesis (cell wall, antibiotic synthesis in bacteria); some participate in regulated proteolysis (N-end rule pathway) |
PART IV: rRNA (RIBOSOMAL RNA)
1. STRUCTURE OF rRNA AND RIBOSOMES
Comparison of Prokaryotic vs Eukaryotic Ribosomes:
| Feature | Prokaryotic (70S) | Eukaryotic (80S) |
|---|---|---|
| Overall sedimentation | 70S | 80S |
| Small subunit | 30S | 40S |
| Large subunit | 50S | 60S |
| rRNA in small subunit | 16S rRNA (1542 nt) | 18S rRNA (~1900 nt) |
| rRNA in large subunit | 23S + 5S rRNA | 28S + 5.8S + 5S rRNA |
| Total rRNA species | 3 (5S, 16S, 23S) | 4 (5S, 5.8S, 18S, 28S) |
| Ribosomal proteins (small) | 21 proteins (S1-S21) | 33 proteins |
| Ribosomal proteins (large) | 31 proteins (L1-L31) | 49 proteins |
| Total proteins | ~52 | ~82 |
| Location | Cytoplasm | Cytoplasm (free) + RER (membrane-bound) + Mitochondria (55S) |
Memory for ribosome subunit sizes: "Prokaryote 70S = 30S + 50S; Eukaryote 80S = 40S + 60S" Note: Values are NOT additive because S values (Svedberg units) reflect shape + size, not just mass.
Mitochondrial Ribosomes:
- 55S overall (28S small subunit + 39S large subunit)
- Smaller than cytoplasmic ribosomes; unique set of rRNA (12S and 16S in mitochondria)
- More sensitive to chloramphenicol (like prokaryotes) than to eukaryotic inhibitors
- Synthesize only 13 mitochondrial proteins (all OXPHOS subunits)
Processing of rRNA (from single pre-rRNA):
PROKARYOTE:
Single 30S pre-rRNA transcript
↓ [RNase III + other nucleases]
16S rRNA (→ 30S small subunit)
23S rRNA (→ 50S large subunit)
5S rRNA (→ 50S large subunit)
EUKARYOTE:
Single 45S pre-rRNA transcript (synthesized by RNA Pol I in nucleolus)
↓ [Methylation + pseudouridylation guided by snoRNA]
↓ [Sequential cleavage by ribonucleases]
18S rRNA (→ 40S small subunit)
28S rRNA (→ 60S large subunit)
5.8S rRNA (→ 60S large subunit; base-pairs with 28S)
[5S rRNA synthesized separately by RNA Pol III in nucleoplasm]
2. PROCESSING OF rRNA
| Step | Details |
|---|---|
| Transcription | Prokaryotes: RNA Pol; Eukaryotes: RNA Pol I (45S pre-rRNA for 28S, 18S, 5.8S) + RNA Pol III (5S rRNA separately) |
| Base modification | ~100 sites in eukaryotic rRNA; 2'-O-methylation of ribose and conversion of uridine → pseudouridine (ψ); guided by snoRNA (small nucleolar RNA) via complementary base pairing |
| Cleavage | Sequential cleavage by ribonucleases and exonucleases; produces mature rRNA species from larger precursors |
| Assembly with proteins | Ribosomal proteins bind rRNA co-transcriptionally in the nucleolus; assembled into pre-ribosomal particles (90S → 40S + 66S precursors) |
| Export | Ribosomal subunits (not whole ribosomes) exported separately through nuclear pore complexes to cytoplasm |
| Final assembly | 40S + 60S subunits associate only when mRNA is present and initiation factors engage |
- Box C/D snoRNA - guide 2'-O-methylation
- Box H/ACA snoRNA - guide pseudouridylation (ψ)
- Many snoRNAs are encoded within introns of other genes (released after splicing)
3. FUNCTIONS OF rRNA
| Function | Details |
|---|---|
| Structural scaffold | rRNA forms the core structure of the ribosome; ribosomal proteins stabilize and assist rRNA folding; ~60% of ribosome mass is rRNA |
| mRNA binding (small subunit) | 16S rRNA (prokaryotes) / 18S rRNA (eukaryotes): contains the anti-Shine-Dalgarno sequence at its 3' end → base-pairs with mRNA Shine-Dalgarno sequence to position mRNA correctly at start codon |
| Peptidyl transferase activity (ribozyme) | The 23S rRNA (prokaryotes) / 28S rRNA (eukaryotes) catalyzes peptide bond formation - this is the key enzymatic activity of the ribosome. The ribosome is fundamentally an RNA enzyme (ribozyme); proteins assist but are NOT the catalyst. Proved by crystal structures of ribosomes (Steitz, Ramakrishnan, Yonath - Nobel Prize 2009) |
| A, P, E site functions | The ribosome has 3 tRNA binding sites extending over both subunits: A (aminoacyl) site - accepts incoming aminoacyl-tRNA; P (peptidyl) site - holds peptidyl-tRNA; E (exit) site - holds deacylated tRNA before exit |
| GTPase activation | Ribosomal RNA surface activates GTPase activity of elongation factors (EF-Tu/EF1α, EF-G/EF2) → drives translocation |
| Target for antibiotics | rRNA is the target of many clinically important antibiotics: |
| Antibiotic | Target rRNA/Site | Effect |
|---|---|---|
| Streptomycin | 16S rRNA (30S) | Misreading of mRNA; inhibits initiation |
| Tetracycline | 16S rRNA (30S, A site) | Blocks aminoacyl-tRNA binding to A site |
| Chloramphenicol | 23S rRNA (50S, A site) | Inhibits peptidyl transferase activity |
| Erythromycin/Macrolides | 23S rRNA (50S, peptide exit tunnel) | Blocks translocation; peptide chain cannot exit |
| Linezolid | 23S rRNA (50S, A site) | Inhibits initiation |
| Fusidic acid | Not rRNA; EF-G | Inhibits translocation |
| Diphtheria toxin | EF-2 (eukaryotic) | ADP-ribosylates EF-2; inhibits translocation |
| Ricin | 28S rRNA (60S) | Removes A from 28S rRNA; abolishes EF-1 binding |
MASTER COMPARISON TABLE: mRNA vs tRNA vs rRNA
| Feature | mRNA | tRNA | rRNA |
|---|---|---|---|
| % of total RNA | 1-5% | 10-15% | 80-85% |
| Size | Largest; variable (few hundred to >10,000 nt) | Smallest (~73-93 nt) | Variable (16S-28S); moderately large |
| Structure | Single-stranded; linear; 5'-cap, poly-A tail | Single-stranded; cloverleaf (2D); L-shape (3D); extensive base pairing | Complex folded RNA; part of large ribonucleoprotein |
| Function | Template for protein synthesis; carries genetic code | Adaptor/decoder; carries amino acid to ribosome | Structural + catalytic scaffold of ribosome |
| Synthesized by | RNA Pol II (eukaryotes) | RNA Pol III (eukaryotes) | RNA Pol I (28S, 18S, 5.8S); Pol III (5S) |
| Processing | 5'-capping, splicing, 3'-polyadenylation | CCA addition, base modification, intron removal | Cleavage from pre-rRNA, base modification |
| Location of function | Cytoplasm (translated at ribosomes) | Cytoplasm (A, P, E sites of ribosome) | Cytoplasm (as ribosomes); Nucleolus (assembly) |
| Key structural features | 5'-cap, 5'-UTR, ORF, 3'-UTR, poly-A tail | Acceptor stem, D-loop, anticodon loop, TψC loop, variable loop | 16S (30S), 23S+5S (50S) in prokaryotes; 18S (40S), 28S+5.8S+5S (60S) in eukaryotes |
| Unique chemical modification | 5' m7G cap (5'→5' bond); methylation | Dihydrouracil, pseudouracil, inosine, ribothymidine | 2'-O-methylation, pseudouridylation (snoRNA-guided) |
| Key associated factor | Ribosomes; eIF-4E (cap); PABP (poly-A) | Aminoacyl-tRNA synthetase | Ribosomal proteins |
3 marks not points
TYPES OF RNA
mRNA (MESSENGER RNA) — 3 Marks
tRNA (TRANSFER RNA) — 3 Marks
rRNA (RIBOSOMAL RNA) — 3 Marks
In legible point format like the last question
Describe the contents boundaries applied anatomy of carotid digastrid an dsuboccipital triangles