
PUFA vs MUFA vs saturated fatty acids
PUFA MUFA saturated fatty acids health effects comparison 2025
saturated monounsaturated polyunsaturated fatty acid structure comparison diagram
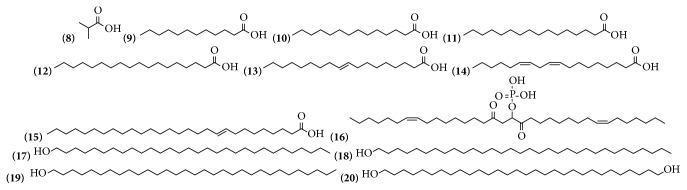
A chemical diagram displaying the molecular structures of various fatty acids and fatty alcohols, categorized as biochemical components relevant to human nutrition and pharmacology. The collection (labeled 8-20) illustrates a range of aliphatic compounds. Structures 8 through 15 primarily depict saturated and unsaturated fatty acids, characterized by long hydrocarbon chains terminating in a carboxylic acid group (-COOH). Notable features include branched-chain structures (8), varying carbon chain lengths (9-12), and examples of monounsaturated (13, 15) and polyunsaturated (14) fatty acids containing carbon-carbon double bonds. Structure 16 displays a more complex phosphorylated lipid derivative. Structures 17 through 20 represent fatty alcohols, identified by the terminal hydroxyl group (-OH) instead of a carboxyl group, including saturated long-chain alcohols (17-19) and a long-chain diol (20). This diagram serves as a visual reference for studying the biochemical classification, nomenclature, and structural diversity of lipids and their derivatives found in botanical sources with potential medicinal applications.
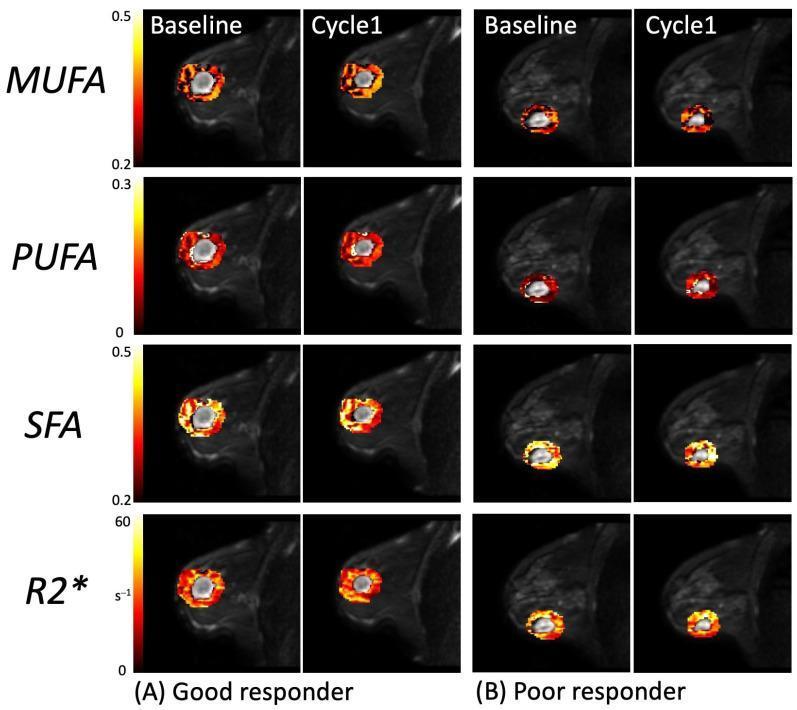
This diagnostic comparison chart displays sagittal quantitative MRI maps of a human breast, focusing on peritumoral metabolic and physiological markers during neoadjuvant chemotherapy (NACT). The image is organized into a grid comparing a 'Good responder' (A) and a 'Poor responder' (B) across two time points: Baseline and Cycle 1. Four key biomarkers are mapped in rows: Monounsaturated Fatty Acids (MUFA), Polyunsaturated Fatty Acids (PUFA), Saturated Fatty Acids (SFA), and the R2* relaxation rate (an indicator of tissue hypoxia). The quantitative data is presented as color-coded heatmaps (ranging from black/red to yellow/white for higher intensity) overlaid onto anatomical MRI scans. In the 'Good responder' columns, there is a visible reduction in the spatial extent and color intensity of all fatty acid markers and R2* signal from baseline to Cycle 1, suggesting a positive metabolic and oxygenation response to treatment. Conversely, the 'Poor responder' exhibits more stable signal intensities and distribution patterns between the two time points. This visual comparison illustrates the potential of peritumoral lipid composition and hypoxia imaging as predictive biomarkers for clinical response in breast cancer oncology.
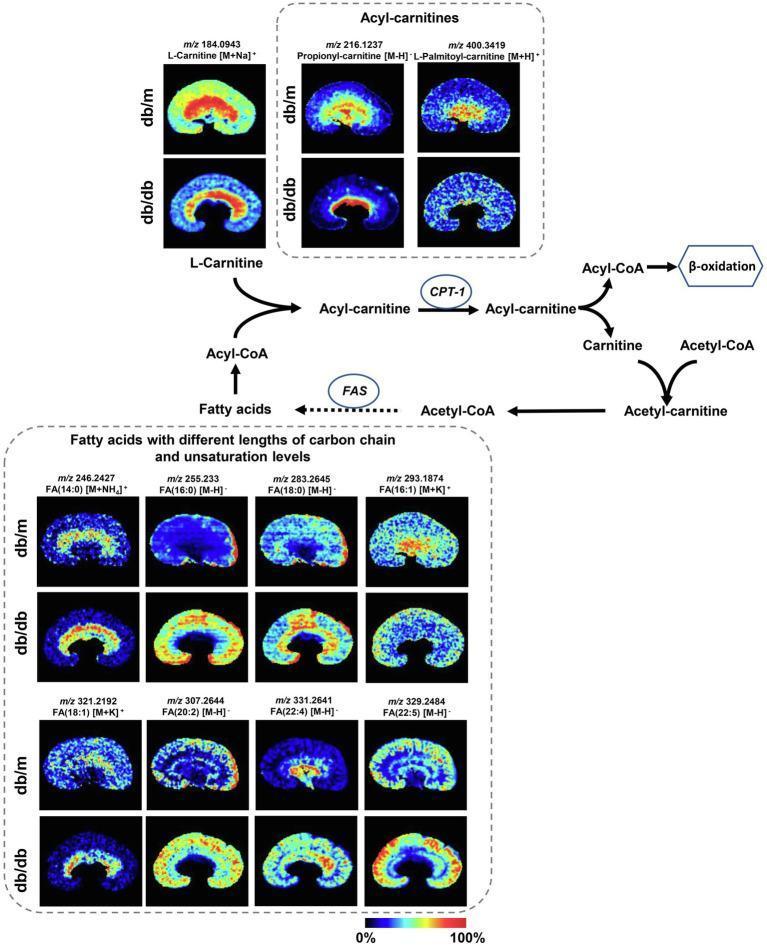
This composite educational image features high-resolution Mass Spectrometry Imaging (MSI) paired with a pathophysiology flow diagram illustrating metabolic reprogramming in Diabetic Kidney Disease (DKD). The visual comparison highlights molecular distribution differences between control (db/m) and diabetic (db/db) mouse kidney models. The top panels display heat maps of L-carnitine and acyl-carnitines (propionyl-carnitine and L-palmitoyl-carnitine), showing a significant signal reduction in diabetic kidneys, particularly in the cortex and medulla. The bottom section presents MSI for various fatty acids with varying chain lengths and unsaturation levels. It demonstrates an accumulation of saturated long-chain fatty acids (FA 14:0, 16:0, 18:0) and polyunsaturated fatty acids (FA 20:2, 22:4, 22:5) in the db/db group, indicated by higher intensity (red/yellow) compared to db/m. Interspersed biochemical flowcharts show the roles of rate-limiting enzymes, specifically CPT-1 (carnitine O-palmitoyl-transferase 1) in fatty acid degradation and FAS (fatty acid synthase) in biosynthesis. This content is designed for advanced medical education in nephrology and metabolic biochemistry to visualize histology-specific metabolic dysfunction.
![A chemical diagram illustrating the molecular structure of a novel arsenolipid, specifically an arsenic-containing fatty acid designated as AsFA 528. The molecule consists of a long, polyunsaturated hydrocarbon chain comprising approximately 30 carbon atoms. At one terminus, it features a dimethylarsinoyl functional group (–As(O)Me2), where the arsenic atom is double-bonded to an oxygen atom and single-bonded to two methyl groups (CH3). The hydrocarbon backbone contains eight double bonds positioned along the chain. The opposite terminus concludes with a carboxylic acid functional group (–COOH). Below the structural formula, technical data is provided, including the molecular formula C30H45AsO3, and mass spectrometry results: a calculated [M+H]+ value of 529.2657, an experimental [M+H]+ value of 529.2654, and a mass error of -0.69 ppm. This diagram is relevant to toxicology and biochemistry research regarding naturally occurring arsenic compounds in marine organisms and their potential impact on human food safety.](https://cdn.orris.care/cdss_images/pmc_clinical_VQA_e5836e744a0aec29a433c6d12243b103c44afc3e2bb1c4b673c3ad8b835c90f7.jpg)
A chemical diagram illustrating the molecular structure of a novel arsenolipid, specifically an arsenic-containing fatty acid designated as AsFA 528. The molecule consists of a long, polyunsaturated hydrocarbon chain comprising approximately 30 carbon atoms. At one terminus, it features a dimethylarsinoyl functional group (–As(O)Me2), where the arsenic atom is double-bonded to an oxygen atom and single-bonded to two methyl groups (CH3). The hydrocarbon backbone contains eight double bonds positioned along the chain. The opposite terminus concludes with a carboxylic acid functional group (–COOH). Below the structural formula, technical data is provided, including the molecular formula C30H45AsO3, and mass spectrometry results: a calculated [M+H]+ value of 529.2657, an experimental [M+H]+ value of 529.2654, and a mass error of -0.69 ppm. This diagram is relevant to toxicology and biochemistry research regarding naturally occurring arsenic compounds in marine organisms and their potential impact on human food safety.
"saturated fatty acids" AND "polyunsaturated fatty acids" AND cardiovascular
PMID: 39365172
Fatty Acids: SFA vs. MUFA vs. PUFA
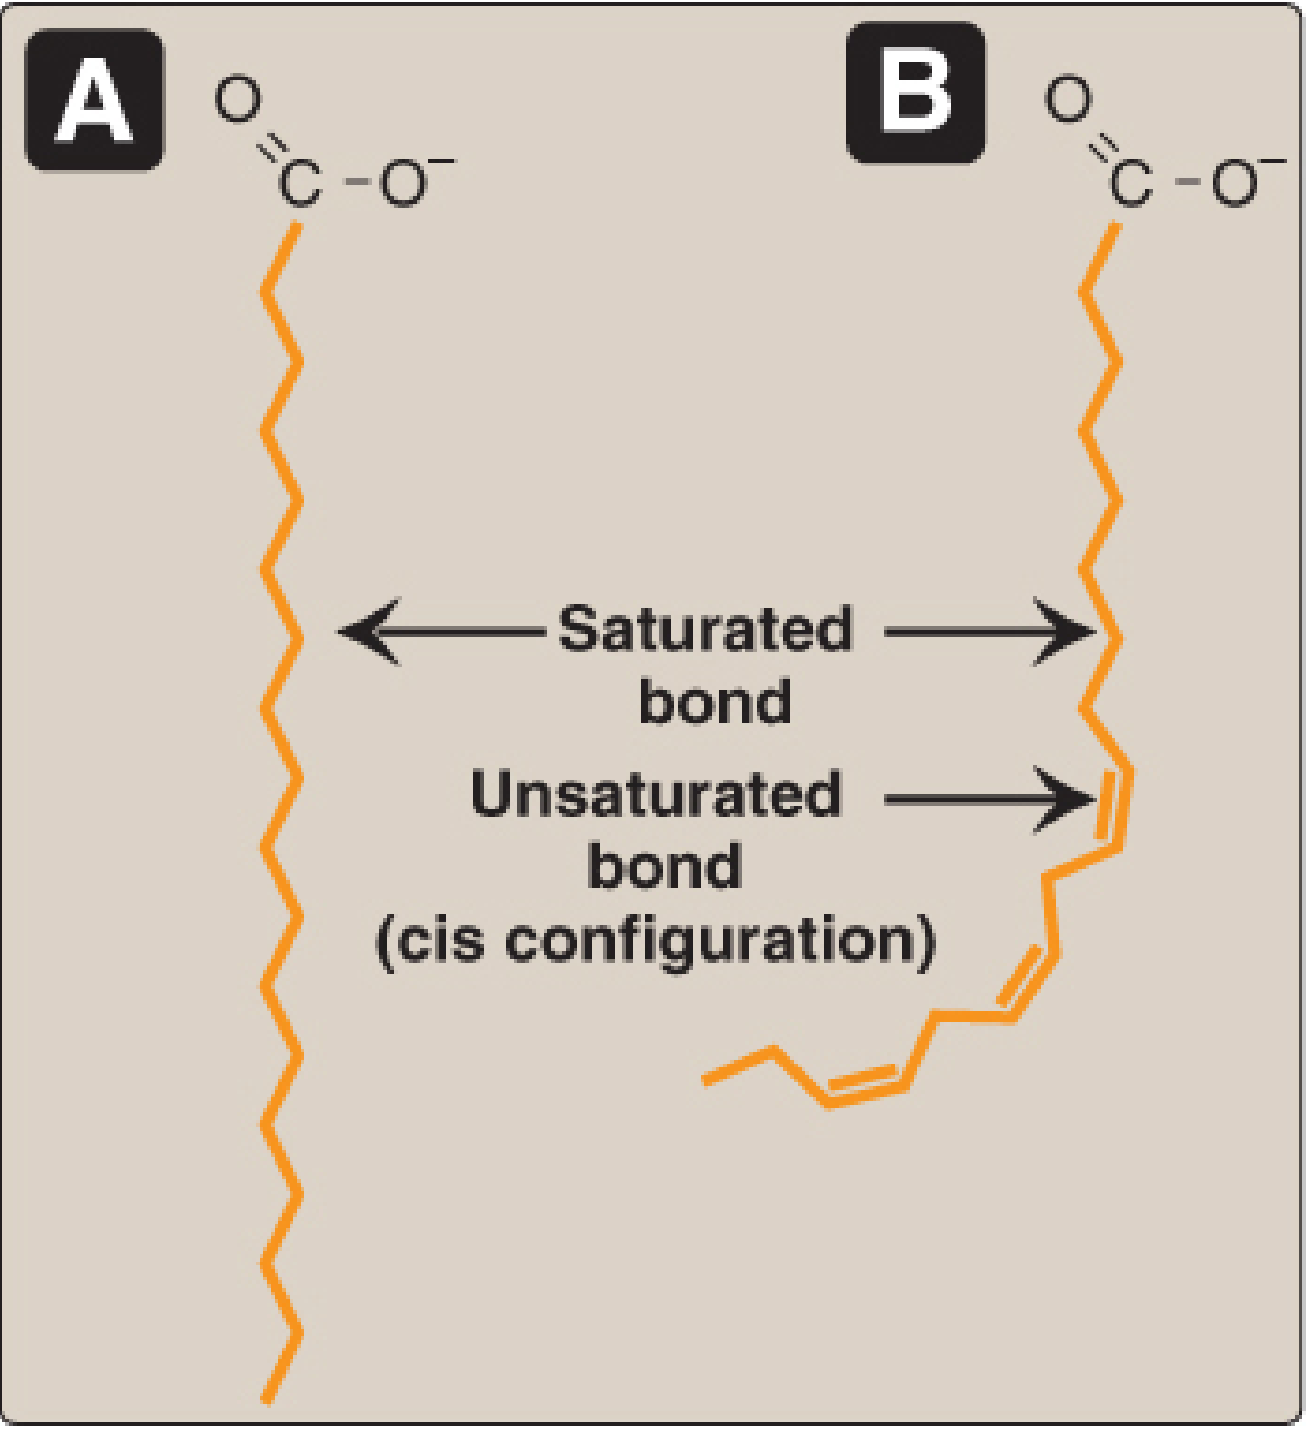
1. Chemical Structure
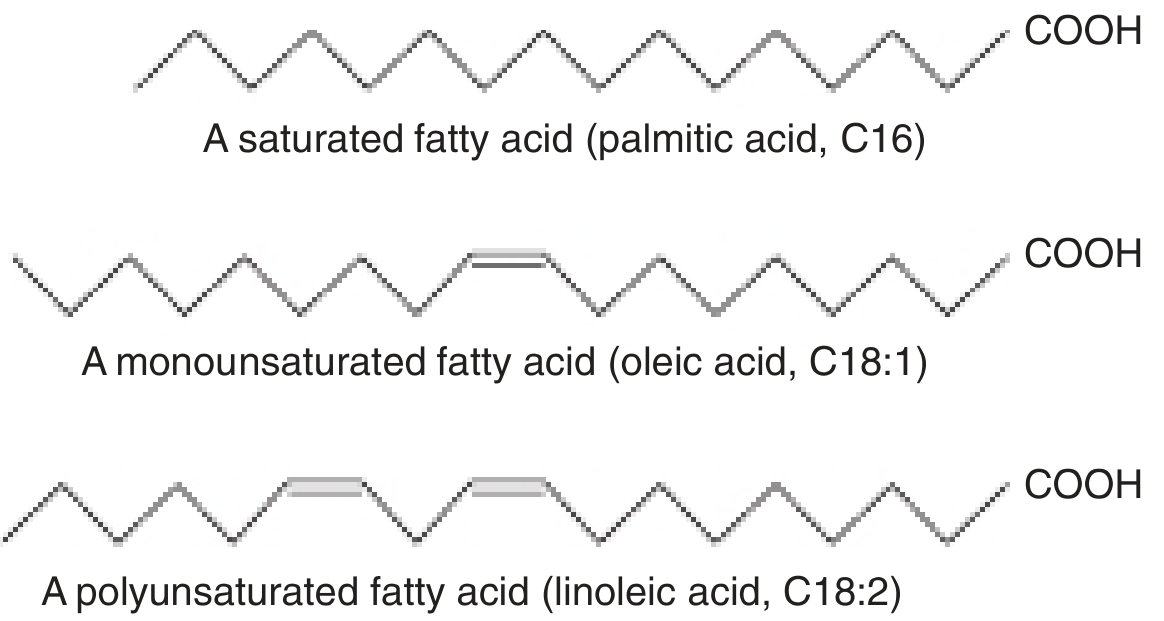
| Feature | Saturated (SFA) | Monounsaturated (MUFA) | Polyunsaturated (PUFA) |
|---|---|---|---|
| Double bonds | 0 | 1 | 2 or more |
| Chain shape | Straight | One kink | Multiple kinks |
| Physical state (room temp) | Solid | Liquid | Liquid |
| Oxidation susceptibility | Very low | Low | High (peroxidation risk) |
2. Nomenclature and Key Examples
| Type | Example | Notation | Common Source |
|---|---|---|---|
| SFA | Palmitic acid | 16:0 | Butter, lard, palm oil |
| SFA | Stearic acid | 18:0 | Beef, chocolate |
| SFA | Myristic acid | 14:0 | Dairy, coconut oil |
| MUFA | Oleic acid | 18:1 (ω-9) | Olive oil, avocado |
| PUFA ω-6 | Linoleic acid | 18:2 (9,12) | Sunflower, corn oil |
| PUFA ω-6 | Arachidonic acid | 20:4 (5,8,11,14) | Animal tissue |
| PUFA ω-3 | α-Linolenic acid | 18:3 (9,12,15) | Flaxseed, canola, walnuts |
| PUFA ω-3 | EPA | 20:5 | Fatty fish |
| PUFA ω-3 | DHA | 22:6 | Fatty fish, brain |
3. Cardiovascular and Lipid Effects
Saturated Fatty Acids (SFA)
- Raise LDL-C and total plasma cholesterol - positively associated with coronary heart disease (CHD) risk.
- Chain length matters: myristic (C14) and palmitic (C16) are most potent in raising cholesterol. Stearic acid (C18) has little effect on blood cholesterol.
- The 2025-2030 US Dietary Guidelines maintain the recommendation to limit SFA to <10% of total caloric intake.
- Important nuance from the EPIC-CVD meta-analysis (2025): Even-chain SFAs (e.g., palmitic, stearic) raised CHD risk (HR 1.24), but odd-chain SFAs (found in dairy, reflecting fermentation) showed protective associations (HR 0.82), challenging blanket SFA recommendations.
Monounsaturated Fatty Acids (MUFA)
- When substituted for SFA, MUFA lower LDL-C and total cholesterol while maintaining or raising HDL-C - a favorable lipid profile.
- This partly explains the low CHD incidence in Mediterranean populations consuming olive oil (rich in oleic acid, ω-9).
- Plant-source MUFA are consistently associated with lower CVD risk; animal-source MUFA are less clearly beneficial. - Biochemistry, Lippincott Illustrated Reviews (8th ed.)
Polyunsaturated Fatty Acids (PUFA)
- Principally linoleic acid from vegetable oils (sunflower, corn, soy).
- Lowers both LDL-C and HDL-C when substituted for SFA - a partial offset, though the net effect is still cardioprotective.
- Circulating linoleic acid is inversely associated with stroke risk in large prospective data.
- AMDR for linoleic acid: 5-10% of total calories.
- Suppress cardiac arrhythmias, reduce plasma triglycerides (TAG), decrease thrombosis tendency, lower blood pressure, and substantially reduce cardiovascular mortality.
- Have notable anti-inflammatory effects (precursors to resolvins, protectins, and less inflammatory eicosanoids vs. ω-6).
- DHA (22:6) is essential for brain development in infants; included in infant formula.
- Marine-derived long-chain ω-3 (DHA) is negatively associated with incident CHD (HR 0.91) per the 2025 EPIC-CVD meta-analysis.
- AMDR for α-linolenic acid: 0.6-1.2% of total calories. Two servings of fatty fish/week is recommended.
4. What Matters When Replacing SFA
| Replacement | CHD Risk Change |
|---|---|
| PUFA | -26 to -30% |
| MUFA (plant-source) | -20% |
| Whole grains | -11% |
| Refined carbohydrates | No benefit or increased risk |
| Trans fatty acids | Increased risk |
5. Other Physiological Roles
| Role | Notes |
|---|---|
| Membrane fluidity | PUFA and MUFA keep membranes fluid; brain membranes are especially DHA-rich |
| Eicosanoid synthesis | ω-6 PUFA (arachidonic acid) → pro-inflammatory prostaglandins, thromboxanes; ω-3 → less inflammatory or anti-inflammatory equivalents |
| Fat-soluble vitamin absorption | Dietary fat required for A, D, E, K absorption |
| Essential fatty acid deficiency | Causes scaly dermatitis (depletion of skin ceramides with long-chain FAs) |
| Peroxidation risk | PUFA, having multiple double bonds, are more susceptible to free radical-mediated lipid peroxidation - one reason MUFA is often preferred over PUFA in culinary use |
| Brain development | DHA (ω-3 PUFA) essential for infant CNS development |
6. Practical Dietary Guidance (2025-2030 DGA)
- Total fat: ~20-35% of calories; mostly unsaturated
- Limit SFA to <10% of total calories; replace with PUFA or MUFA, not refined carbs
- Emphasize: olive oil, nuts, seeds, fatty fish, avocados
- Limit: butter, coconut oil, palm oil, processed/red meats
- The 2025-2030 guidelines introduce a nuance by endorsing full-fat dairy and red meat to some degree, though the evidence still favors replacing SFA with plant-based unsaturated fats for CAD risk reduction. - Recent 2025 review (PMID 42288139)