
Interpretation of common investigations case-based approach -renal function tests, arterial blood gas, serum electrolytes, chest x-ray ( pediatrics) Self directed learning
pediatric chest x-ray interpretation normal abnormal
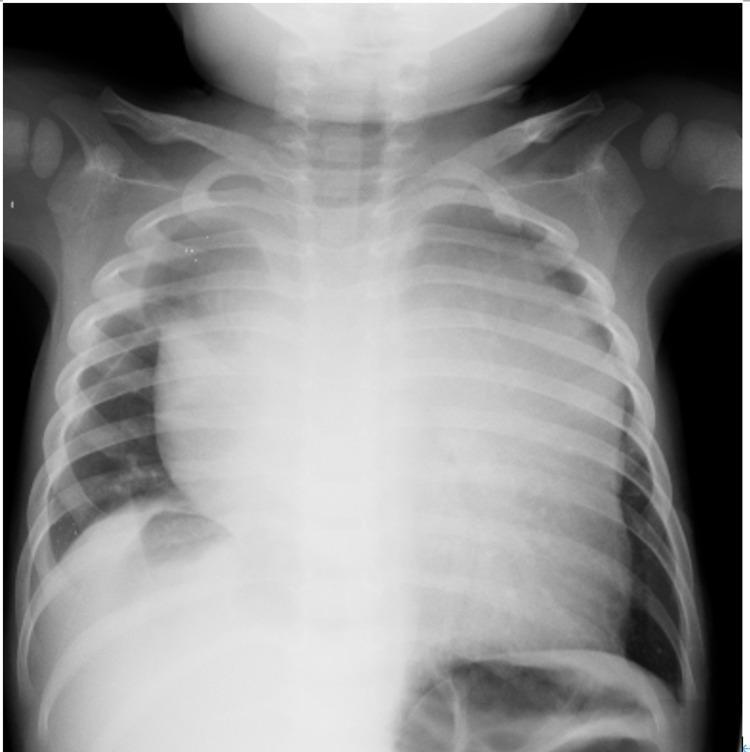
Anterior-posterior (AP) pediatric chest X-ray demonstrating a significant, abnormal expansion of the mediastinal shadow. The central opacity is markedly widened, obscuring the normal cardiac borders and silhouettes of the great vessels. This large, homogenous mass occupies the anterior and superior mediastinal compartments, causing lateral displacement of the lung fields. While the lung parenchyma appears relatively clear and aerated, there is evidence of mass effect on adjacent structures. The skeletal framework, including ribs and clavicles, appears intact. In a pediatric context, this visual presentation is highly suggestive of a large mediastinal mass, such as a lymphoma, thymoma, or germ cell tumor, which may present with acute respiratory distress due to tracheal compression or superior vena cava syndrome. The image illustrates the classic radiographic sign of mediastinal widening essential for medical students and clinicians in identifying potential intrathoracic emergencies.
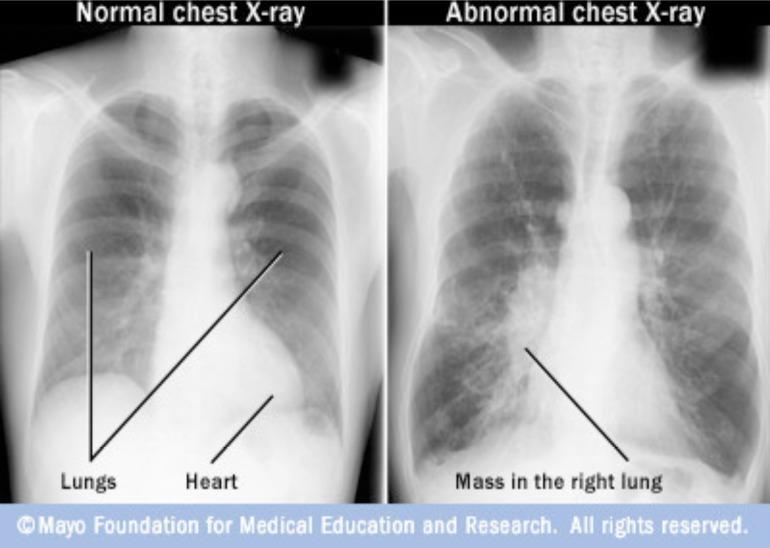
This Comparison Chart features two side-by-side posterior-anterior (PA) chest radiographs labeled 'Normal chest X-ray' and 'Abnormal chest X-ray'. The 'Normal' image depicts clear, radiolucent lung fields, sharp costophrenic angles, and a distinct cardiac silhouette. In contrast, the 'Abnormal' image demonstrates a significant focal opacity in the lower-to-middle zone of the right lung, labeled as a 'Mass in the right lung'. This finding represents a radiopaque lesion that obscures the normal pulmonary vascular markings and silhouettes the right heart border. The comparison serves as a diagnostic example for identifying primary lung neoplasms or large pulmonary masses. Key educational concepts include recognizing abnormal densities, understanding radiographic silhouettes, and differentiating healthy pulmonary parenchyma from pathological mass lesions. This material is suitable for undergraduate and intermediate medical education within the fields of radiology, pulmonology, and oncology.
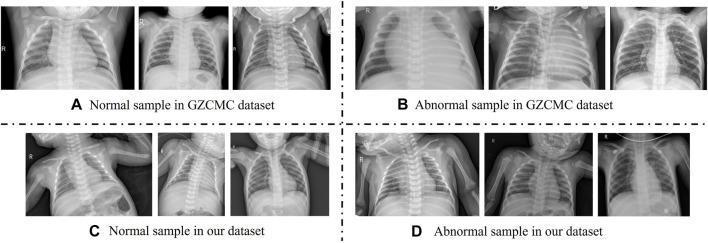
This diagnostic image provides a comparison chart of pediatric chest X-ray (CXR) samples from two different sources: the Guangzhou Women and Children’s Medical Center (GZCMC) dataset and a clinical dataset for retrospective study. The visual is divided into four quadrants (A-D) showcasing the variability in pediatric imaging. Quadrants A and C display 'Normal' samples. Normal CXRs show clear lung fields, visible ribcage structures, and a defined mediastinum. Quadrants B and D display 'Abnormal' samples (consistent with pneumonia), characterized by increased opacity, consolidation, and infiltrates within the lung fields. A key educational focus of the comparison is the difference in image acquisition. The GZCMC samples (A, B) demonstrate standard, centered positioning focused on the thoracic cavity with minimal artifacts. In contrast, the clinical dataset samples (C, D) demonstrate real-world variability in pediatric radiography, including rotated postures, varying shooting areas, and the presence of arms across the chest, which adds irrelevant information to the diagnostic field. This serves to illustrate the challenges of developing automated diagnostic models that must account for non-standardized patient positioning in clinical practice.
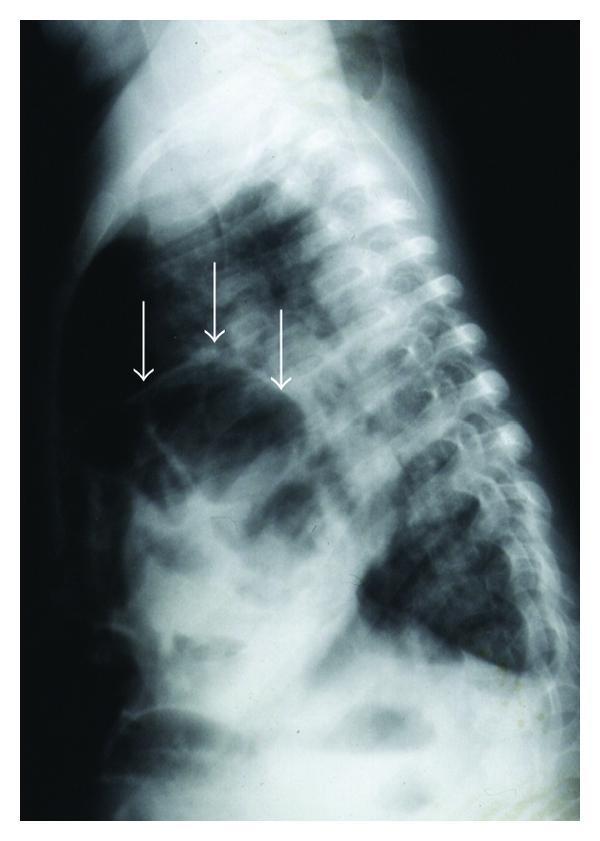
This lateral pediatric chest X-ray demonstrates a large diaphragmatic defect with significant herniation of abdominal contents into the thoracic cavity. The image shows multiple rounded and irregularly shaped areas of increased lucency (air-filled spaces) extending superiorly from the abdominal region into the posterior and lower chest, as indicated by three white arrows. These findings are characteristic of bowel loops within the thorax. The vertebral column and rib cage appear anatomically intact, though the normal lung parenchyma is displaced and obscured in the lower half of the chest due to the presence of these radiolucent structures. This diagnostic imaging is consistent with a congenital or acquired diaphragmatic hernia, such as a large paraesophageal hernia, leading to intrathoracic bowel displacement. Clinical relevance includes the potential for respiratory distress, failure to thrive, and gastric volvulus. The educational focus is on identifying abnormal air-filled visceral structures within the mediastinum and pleural space on pediatric radiology.
ABG arterial blood gas interpretation acid base disorders diagram
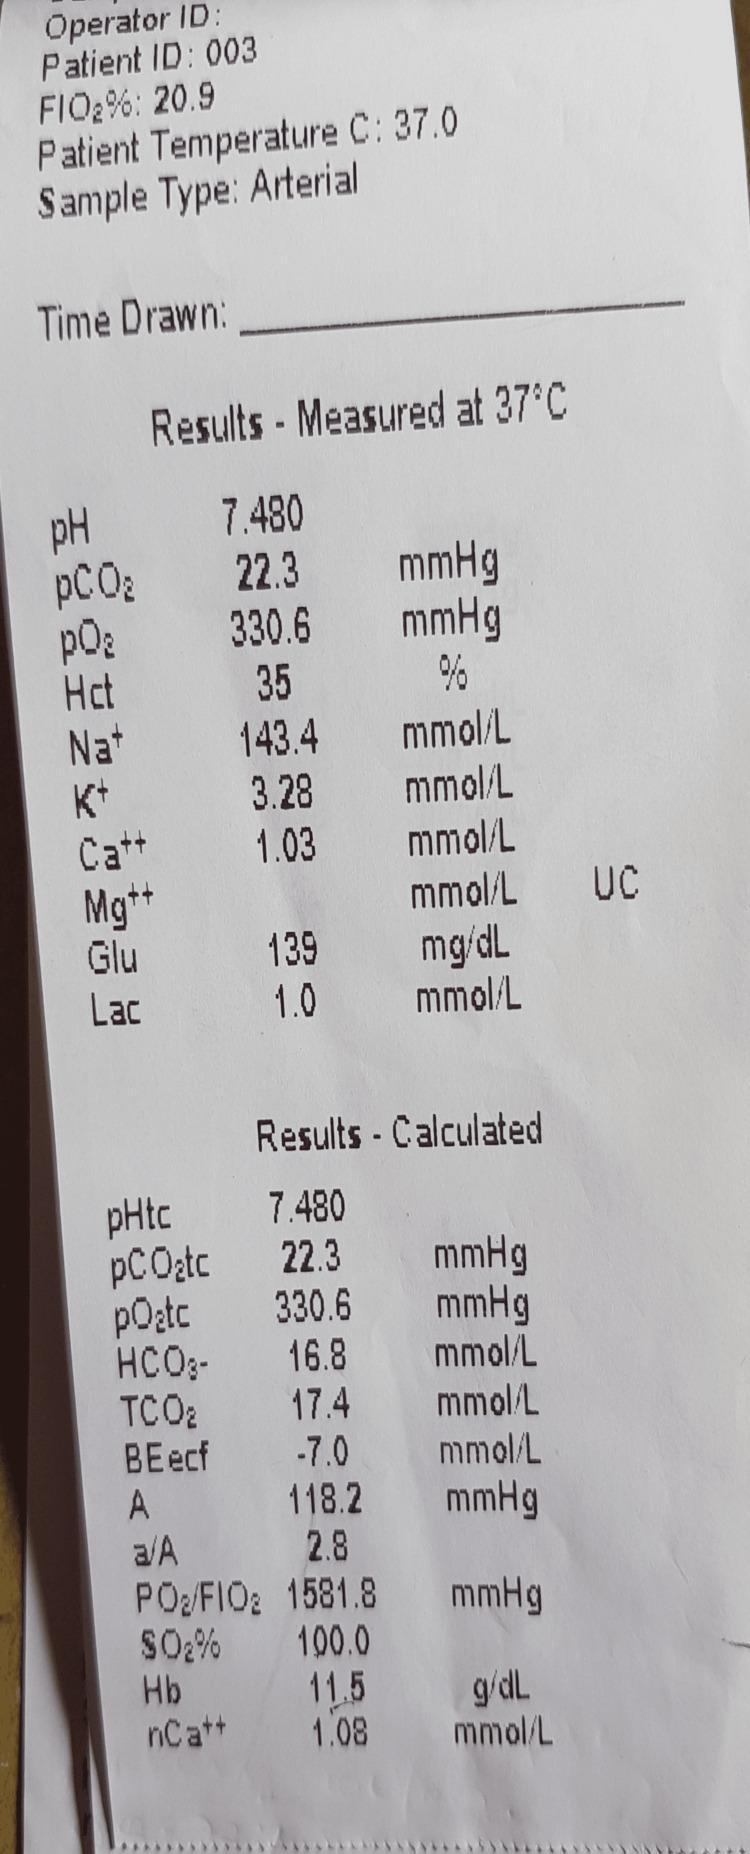
A clinical photograph of a printed arterial blood gas (ABG) analysis report. The document displays measured and calculated physiological values at a patient temperature of 37.0°C. Key measured values include a pH of 7.480, pCO2 of 22.3 mmHg, pO2 of 330.6 mmHg, and electrolyte levels (Na+ 143.4 mmol/L, K+ 3.28 mmol/L, Ca++ 1.03 mmol/L). Calculated values show a bicarbonate (HCO3-) level of 16.8 mmol/L and an oxygen saturation (SO2%) of 100.0%. This visual demonstrates a 'saturation gap' characteristic of certain toxicological conditions, such as methemoglobinemia, where the calculated oxygen saturation from the ABG appears normal (100%) despite the patient potentially experiencing clinical cyanosis and low peripheral pulse oximetry readings. The image is an educational tool for critical care, emergency medicine, and clinical toxicology, illustrating the interpretation of acid-base balance and oxygenation status.
This medical anatomical diagram illustrates the arterial blood supply and vascular distribution patterns across the internal skull base, specifically focusing on feeders involved in skull base meningiomas. The composite image consists of five sub-figures (A-E) superimposed on a superior view of a human skull model. Sub-figure A depicts the Dorsal Meningeal Artery (DMA) in red, originating from the meningohypophyseal trunk and descending along the upper clivus. Sub-figure B shows the Ascending Pharyngeal Artery (APA) in orange, distributing around the foramen magnum and lower clivus. Sub-figure C highlights the Tentorial Artery (TA) in green, following the course of the tentorium cerebelli. Sub-figure D illustrates the Petrosal Branch (PB) in blue, arising from the middle meningeal artery near the foramen spinosum and reaching the petrous apex. Sub-figure E provides a summarized color-coded overlay demonstrating the spatial relationships of these four vascular territories relative to the clivus, petrous bone, and foramen magnum. This visual guide assists in identifying potential feeding arteries based on the tumor's dural attachment site during preoperative planning for meningioma resection.
Anatomical Diagram and intraoperative overlay illustrating the arterial blood supply to the cavernous sinus, specifically regarding the feeding vessels of skull base meningiomas. The cavernous sinus is highlighted by a pink outline. The arterial distribution is color-coded: the Tentorial Artery (TA) is represented in yellow, demonstrating its supply to the superolateral aspect of the posterior cavernous sinus. The Dural Meningeal Artery (DMA) is shown in blue, highlighting its coverage of the inferomedial portion of the posterior cavernous sinus. A red arrow identifies the interface where cranial nerves are typically situated between these two arterial territories. The image serves as a clinical reference for neurosurgical planning, helping to differentiate between petrotentorial and petroclival meningioma attachments based on their primary feeding arteries and their spatial relationship to critical neurovascular structures within the skull base.
This medical anatomical diagram illustrates the arterial blood supply territories of the human brain through color-coded mapping on axial and coronal sections. Image 'a' displays an axial section at the level of the genu of the corpus callosum, while image 'b' shows a coronal section at the level of the head of the caudate nucleus. The primary vascular territories are identified as follows: red represents the Anterior Cerebral Artery (ACA), supplying the superior and medial aspects; green denotes the Middle Cerebral Artery (MCA), covering the extensive lateral and central regions; and blue indicates the Posterior Cerebral Artery (PCA) territory at the base and posterior aspects. Additionally, smaller vascular zones are identified, including the anterior choroidal artery (purple in 'a', light blue in 'b') and the posterior communicating artery (orange). Blue arrows highlight the border zones or watershed regions between major territories, which are clinically significant as areas highly susceptible to ischemia during hypoperfusion. This visual resource is designed for medical students and clinicians to understand neurovascular anatomy and the pathophysiology of watershed strokes.
pneumonia consolidation chest x-ray child
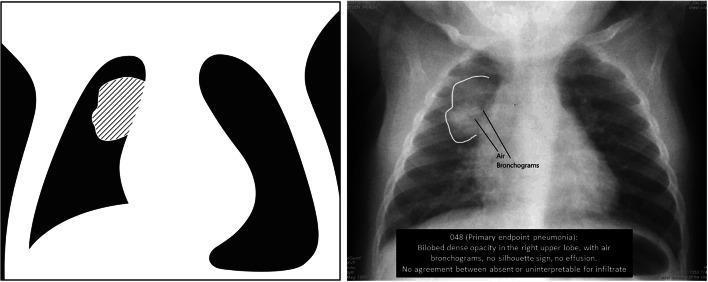
This educational composite contains a pediatric chest radiograph and a corresponding simplified anatomical diagram illustrating the WHO criteria for primary endpoint pneumonia. The right-sided image is an anteroposterior (AP) diagnostic X-ray of a child's chest. It demonstrates a focal, bilobed dense opacity in the right upper lobe, highlighted by a white outline. Significant radiographic features within this consolidated region include air bronchograms—linear lucencies representing air-filled bronchi against fluid-filled alveoli. There is no evidence of a silhouette sign at the heart border, and no pleural effusion is visible. The left-sided image is a high-contrast schematic diagram serving as a teaching tool; it uses a diagonal hatched pattern to map the exact anatomical location and morphology of the consolidation described in the radiograph. This material is designed for epidemiological training to standardize the identification of radiologically confirmed pneumonia, focusing on dense consolidation and distinguishing features like air bronchograms and the presence or absence of pleural fluid.
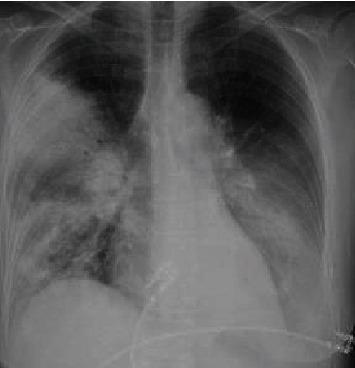
This diagnostic image is a posterior-anterior (PA) view chest X-ray demonstrating multifocal pneumonia with prominent consolidations. In the right lung, there is dense consolidation involving the upper lobe, characterized by increased radiopacity that obscures the regional vascular markings. Patchy, ill-defined airspace opacities are also visible extending into the right lower lobe. The left lung field reveals significant consolidation primarily localized within the lower lobe, partially obscuring the left hemidiaphragm silhouette. The cardiac silhouette appears normal in size, and the trachea is midline. The visual findings are consistent with severe pulmonary infection, such as atypical pneumonia (e.g., Legionella species). This clinical imaging serves as an educational example of multifocal bacterial consolidation and its radiographic distribution in the context of acute respiratory distress and sepsis.
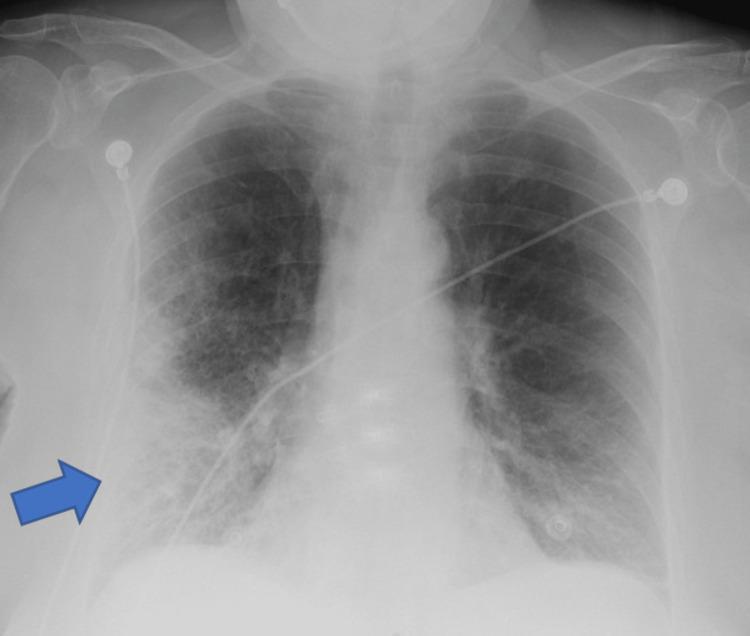
A frontal (anteroposterior) chest X-ray demonstrating clinical signs of pneumonia. A prominent blue arrow indicates a large area of increased opacity in the right lower lung field, suggestive of lobar consolidation or a dense pulmonary infiltrate. The opacity is heterogeneous with ill-defined borders, blending into the surrounding parenchyma. Beyond the focal area, there are diffuse bilateral reticulonodular interstitial markings, more pronounced in the mid and lower lung zones. The right costophrenic angle is relatively sharp, while the left shows mild blunting. Several medical devices are present: multiple radiopaque ECG leads/electrodes are positioned on the upper chest and shoulders, and a radiopaque enteric tube (nasogastric or feeding tube) is visible traversing the mediastinum toward the stomach. The image illustrates typical radiological findings of an infectious process in an acute clinical setting, highlighting focal consolidation against a background of generalized pulmonary congestion or inflammation.
hyponatremia hyperkalemia electrolyte management
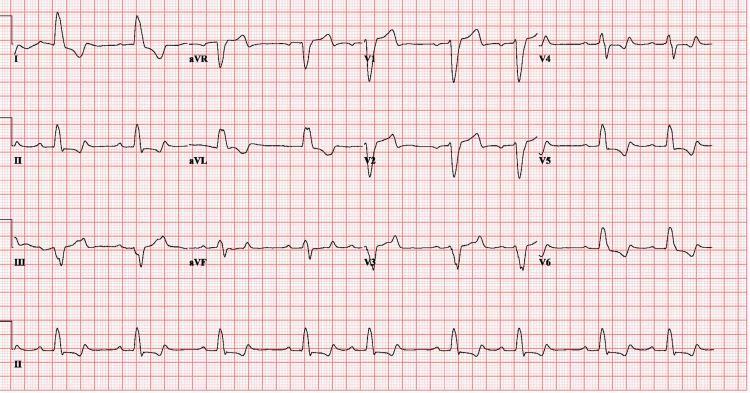
This diagnostic image is a 12-lead electrocardiogram (ECG) printed on standard grid paper, demonstrating dynamic changes consistent with Left Bundle Branch Block (LBBB) in the context of hyperkalemia management. The tracing shows a wide QRS complex duration (approximately 146 ms) and normal sinus rhythm. Key morphological features include a dominant, deep S-wave in the right precordial leads (V1-V2) and broad, notched, or monomorphic R-waves in the left-sided leads (I, aVL, V5, V6). Discordant T-wave inversions are visible in several leads, though the T-waves appear less peaked compared to typical acute hyperkalemia presentations, indicating post-hemodialysis improvement. Lead aVR shows expected global negativity of the P, QRS, and T waves. This ECG serves as a clinical example of how electrolyte imbalances and metabolic interventions like hemodialysis can alter intraventricular conduction and QRS morphology.
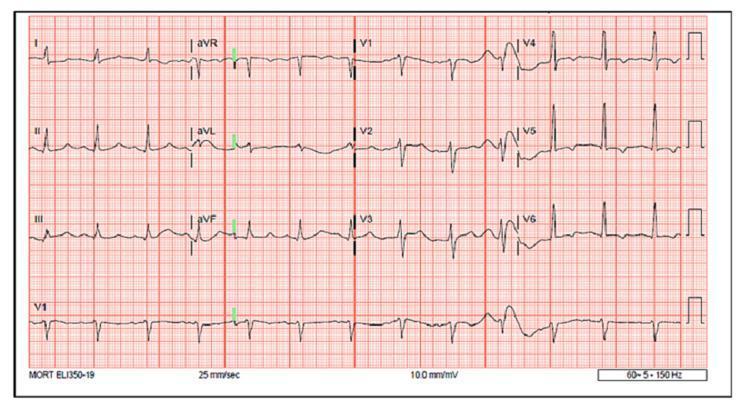
A 12-lead electrocardiogram (EKG) tracing displaying diagnostic findings associated with true hyperkalemia (7.4 mmol/L) in the context of acute kidney injury and metabolic acidosis. The tracing exhibits several critical electrolyte-induced abnormalities. Notable findings include a significantly prolonged QTc interval, measured at 522 ms (normal <440 ms), most visible in leads II, III, V5, and V6. Additionally, there are distinct T-wave inversions in the lateral leads, specifically I, aVL, V4, V5, and V6. The EKG serves as an educational illustration of how severe hyperkalemia can paradoxically manifest with QTc prolongation and lateral T-wave inversion rather than the classic 'peaked' T-wave morphology. This tracing is relevant for emergency medicine and nephrology, emphasizing the importance of recognizing atypical cardiac electrical manifestations of electrolyte imbalances to guide urgent clinical intervention.
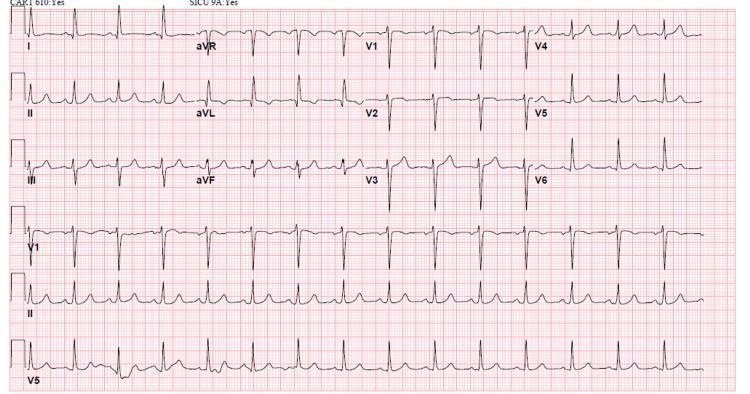
This diagnostic image is a standard 12-lead electrocardiogram (EKG) demonstrating a normal sinus rhythm in a patient following treatment for hyperkalemia. The tracing shows regular P waves that are upright in leads I, II, and aVF, with each P wave followed by a narrow QRS complex (duration <120 ms). The PR interval is within normal limits. The QRS complexes exhibit normal morphology across all limb and precordial leads (V1-V6), with a normal R-wave progression. T waves are concordant and lack the peaked morphology characteristic of acute hyperkalemia. No significant ST-segment deviations or pathological Q waves are visible. The clinical significance of this EKG is to demonstrate the resolution of conduction abnormalities, such as left bundle branch block (LBBB) or QRS widening, typically seen in severe electrolyte imbalances like hyperkalemia, after successful intervention with hemodialysis and medical management.
acute kidney injury AKI child nephrotic syndrome urinalysis cast
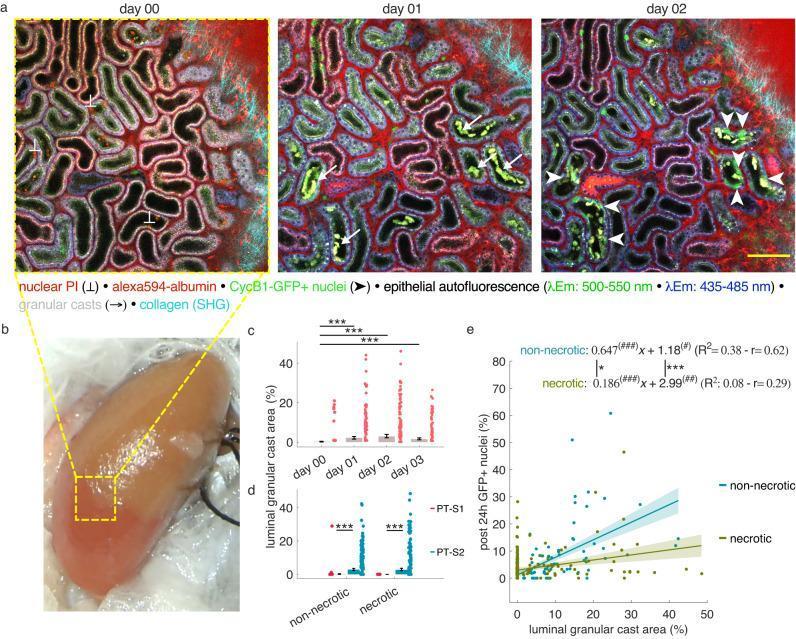
Educational visual summary illustrating the progression of Acute Kidney Injury (AKI) and tubule remodeling using serial in vivo 2-photon microscopy and statistical analysis. Panel (a) presents time-lapse images (Day 00, 01, 02) of a kidney 'Mid' region in CycB1-GFP mice following partial ischemia-reperfusion injury (IRI). The images show epithelial autofluorescence (λEm: 500-550 nm and 435-485 nm) and markers for nuclear necrosis (Propidium Iodide, PI), albumin (Alexa594), and cell cycling (CycB1-GFP+). Key observations include the initial appearance of luminal granular casts (arrows) on Day 1, followed by a substantial increase in proliferating GFP+ nuclei (arrowheads) by Day 2 in downstream tubule segments. Panel (b) shows a clinical photograph of a mouse kidney during arterial occlusion, identifying the ischemic border. Panels (c) and (d) provide volumetric quantification of luminal granular cast area across different days and tubule segments (PT-S1 vs. PT-S2), while panel (e) displays linear regression analysis correlating granular cast accumulation with subsequent epithelial proliferation in non-necrotic and necrotic segments.
![This pathophysiology diagram illustrates the pathogenesis of Tumor Lysis Syndrome (TLS) leading to Acute Kidney Injury (AKI). The flowchart begins with 'Tumor cell lysis,' releasing phosphate (PO4 3-), nucleic acids, and inflammation mediators (Cy). The phosphate combines with calcium (Ca2+) to form bar-shaped calcium phosphate crystals [Ca3(PO4)2]. Simultaneously, nucleic acids are metabolized into uric acid, which can either form cubic uric acid crystals or exist in a soluble form. The diagram identifies two distinct pathways to renal failure: 1) Injury due to crystal precipitation in renal tubules (calcium phosphate and uric acid crystals), and 2) Crystal-independent injury involving vasoconstriction, oxygen radicals, and inflammation. Both pathways converge on 'Acute kidney injury,' represented by a stylized kidney icon showing signs of damage. This visual summary is intended for oncology and nephrology medical education to explain the metabolic drivers and obstructive versus non-obstructive mechanisms of TLS-induced renal dysfunction.](https://cdn.orris.care/cdss_images/pmc_clinical_VQA_c824527c3bcca5255b115f60cf069d727fe72ae069581a1eb3c48f4d4ccd5958.jpg)
This pathophysiology diagram illustrates the pathogenesis of Tumor Lysis Syndrome (TLS) leading to Acute Kidney Injury (AKI). The flowchart begins with 'Tumor cell lysis,' releasing phosphate (PO4 3-), nucleic acids, and inflammation mediators (Cy). The phosphate combines with calcium (Ca2+) to form bar-shaped calcium phosphate crystals [Ca3(PO4)2]. Simultaneously, nucleic acids are metabolized into uric acid, which can either form cubic uric acid crystals or exist in a soluble form. The diagram identifies two distinct pathways to renal failure: 1) Injury due to crystal precipitation in renal tubules (calcium phosphate and uric acid crystals), and 2) Crystal-independent injury involving vasoconstriction, oxygen radicals, and inflammation. Both pathways converge on 'Acute kidney injury,' represented by a stylized kidney icon showing signs of damage. This visual summary is intended for oncology and nephrology medical education to explain the metabolic drivers and obstructive versus non-obstructive mechanisms of TLS-induced renal dysfunction.
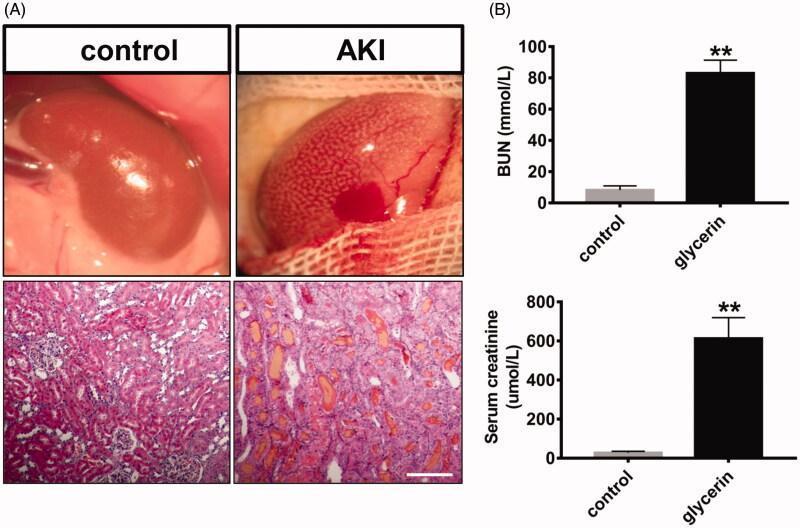
This composite educational image illustrates a rodent model of Acute Kidney Injury (AKI) induced by glycerol. Panel A presents side-by-side macroscopic and microscopic comparisons between a control and an AKI kidney. Macroscopically, the control kidney appears smooth and normal in size, while the AKI kidney exhibits significant enlargement (hypertrophy), a textured pale surface, and focal areas of hemorrhage. The corresponding histology (H&E staining, bar: 100μm) shows that the control tissue maintains organized tubular structures, whereas the AKI tissue demonstrates extensive pathology, including tubular dilatation, vacuolation, atrophy, and the presence of intratubular myoglobin casts characteristic of rhabdomyolysis-induced renal damage. Panel B provides quantitative data via bar charts, showing a marked, statistically significant increase in biochemical markers of renal dysfunction in the AKI (glycerin) group: Blood Urea Nitrogen (BUN) levels exceed 80 mmol/L and serum creatinine levels reach approximately 600 μmol/L, compared to the low baseline levels in the control group. This visual summary effectively demonstrates the correlation between macroscopic organ changes, histopathological tissue damage, and clinical biomarkers in acute nephrotoxicity.
pediatric ABG interpretation normal values children acid-base case-based approach 2024
Interpretation of Common Investigations in Pediatrics
A Case-Based Self-Directed Learning Guide
PART 1: RENAL FUNCTION TESTS (RFTs)
Normal Pediatric Reference Ranges
| Test | Normal Range | Units |
|---|---|---|
| Blood Urea Nitrogen (BUN) | 5-25 | mg/dL |
| Creatinine | 0.5-1.5 (adults); lower in children | mg/dL |
| Sodium | 133-147 | mmol/L |
| Potassium | 3.2-5.2 | mmol/L |
| Bicarbonate (CO2) | 22-32 | mmol/L |
| Uric acid | 2.5-7.5 | mg/dL |
| Calcium | 8.5-10.5 | mg/dL |
| Phosphorus | 2.2-4.2 | mg/dL |
Pediatric note: Serum creatinine is age-dependent. Neonates have creatinine ~0.3-0.5 mg/dL (reflecting maternal levels initially), infants 0.2-0.4 mg/dL, children 0.3-0.7 mg/dL, adolescents approach adult values. Always interpret creatinine in context of age and muscle mass.
Key Concepts
- The GFR is the single best measure of overall renal function. Normal adult GFR is ~125 mL/min/1.73m².
- Importantly, serum creatinine and BUN do not rise appreciably until GFR has fallen to ~50% of normal - meaning significant kidney disease may be present with "normal-looking" labs.
- When GFR falls to 30% of normal: moderate renal insufficiency - often asymptomatic but biochemical changes present.
- When GFR falls to 5-10% of normal: end-stage renal disease (ESRD) requiring renal replacement therapy.
eGFR = (0.413 × Height in cm) / Serum Creatinine (mg/dL)
- Not a reliable isolated marker of GFR. Elevated by: high protein intake, GI bleeding, corticosteroids, dehydration, muscle breakdown (all increase urea production independent of GFR).
- BUN:Creatinine ratio >20:1 suggests prerenal causes (dehydration, reduced perfusion). Ratio <10:1 suggests intrinsic renal or post-renal disease.
| Finding | Significance |
|---|---|
| Protein 2+ or more | Glomerular disease (nephrotic syndrome) |
| RBC casts | Glomerulonephritis |
| Granular/muddy brown casts | Acute tubular necrosis (ATN) |
| WBC casts | Pyelonephritis/interstitial nephritis |
| Glucose in absence of hyperglycemia | Fanconi syndrome / tubular dysfunction |
| Specific gravity fixed at 1.010 | Isosthenuria - loss of concentrating ability |
CASE 1: The Puffy Child
- Serum albumin: 1.8 g/dL (low)
- Serum creatinine: 0.4 mg/dL (normal for age)
- BUN: 18 mg/dL
- Urine dipstick: Protein 4+, Blood negative
- Urine protein/creatinine ratio: 4.2 (markedly elevated)
- Serum cholesterol: 380 mg/dL
- Massive proteinuria + hypoalbuminaemia + oedema + hyperlipidaemia = Nephrotic Syndrome
- GFR is preserved (normal creatinine) - this is pure nephrotic, not nephritic
- Urine lacks blood/RBC casts - does NOT suggest glomerulonephritis
- Diagnosis: Most likely Minimal Change Disease in this age group (80% of nephrotic syndrome at 1-8 years)
- Management: Respond to oral prednisolone 60 mg/m²/day; avoid nephrotoxins; monitor BP
CASE 2: Reduced Urine Output Post-Diarrhoeal Illness
- Creatinine: 3.2 mg/dL (markedly elevated)
- BUN: 80 mg/dL
- Serum K+: 6.8 mEq/L (dangerously elevated)
- Haemoglobin: 6.5 g/dL
- Platelets: 45,000/µL (low)
- Blood film: schistocytes present
- Urine: haematuria, proteinuria
- Triad: microangiopathic haemolytic anaemia + thrombocytopenia + AKI = Haemolytic Uraemic Syndrome (HUS)
- Likely aetiology: Shiga toxin-producing E. coli (O157:H7) from bloody diarrhoea
- Hyperkalemia (K+ 6.8) = immediate cardiac risk - requires urgent intervention
- Management: No antibiotics (may worsen Shiga toxin release), supportive care, dialysis if K+ uncontrollable, RBC transfusion if Hb <6
PART 2: ARTERIAL BLOOD GAS (ABG)
Normal Pediatric ABG Values
| Parameter | Neonate (0-4 days) | Infant (1mo-2yr) | Child (>2yr) |
|---|---|---|---|
| pH | 7.26-7.49 | 7.35-7.45 | 7.35-7.45 |
| pCO2 arterial | 27-40 mmHg | 27-41 mmHg | 35-48 mmHg (M) / 32-45 (F) |
| pO2 arterial | >50-85 mmHg | 54-95 mmHg | 83-108 mmHg |
| HCO3- | 17-24 mmol/L | 16-24 mmol/L | 22-26 mmol/L |
| Base Excess | -10 to -2 | -7 to -1 | -4 to +2 |
| SpO2 | 40-90% (Day 1-4) | 94-98% | 94-98% |
Systematic ABG Interpretation - 5-Step Approach
- pH <7.35 = Acidosis
- pH >7.45 = Alkalosis
- pH 7.35-7.45 = Normal (but a disorder may still be present with compensation)
| pH | pCO2 | HCO3 | Disorder |
|---|---|---|---|
| ↓ | ↑ | Normal/↑ | Respiratory Acidosis |
| ↑ | ↓ | Normal/↓ | Respiratory Alkalosis |
| ↓ | Normal/↓ | ↓ | Metabolic Acidosis |
| ↑ | Normal/↑ | ↑ | Metabolic Alkalosis |
| Disorder | Expected Compensation |
|---|---|
| Metabolic Acidosis | Expected pCO2 = 1.5 × HCO3 + 8 ± 2 (Winter's formula) |
| Metabolic Alkalosis | Expected pCO2 = 0.7 × HCO3 + 21 ± 2 |
| Acute Respiratory Acidosis | HCO3 rises 1 mEq/L per 10 mmHg rise in pCO2 |
| Chronic Respiratory Acidosis | HCO3 rises 3.5 mEq/L per 10 mmHg rise in pCO2 |
| Acute Respiratory Alkalosis | HCO3 falls 2 mEq/L per 10 mmHg fall in pCO2 |
| Chronic Respiratory Alkalosis | HCO3 falls 5 mEq/L per 10 mmHg fall in pCO2 |
AG = Na - (Cl + HCO3) — Normal = 8-12 mEq/L
- High AG Metabolic Acidosis (HAGMA) - mnemonic: MUDPILES
- Methanol, Uremia, DKA/Diabetic ketoacidosis, Propylene glycol/Paracetamol, Iron/Isoniazid, Lactic acidosis, Ethylene glycol, Salicylates
- Normal AG (Hyperchloraemic) Metabolic Acidosis (NAGMA) - mnemonic: HARDUPS
- Hyperalimentation, Addison's disease, Renal tubular acidosis (RTA), Diarrhoea, Ureteral diversion, Pancreatic fistula, Saline infusion
- PaO2 normal: 83-108 mmHg (room air, >2 years)
- A-a gradient = PAO2 - PaO2 (normal ~10 mmHg, increases with age)
- Normal A-a gradient + hypercapnia = hypoventilation (CNS, neuromuscular)
- Elevated A-a gradient + hypercapnia = intrinsic lung disease
CASE 3: Tachypnoeic 8-Month-Old
- pH: 7.30
- pCO2: 28 mmHg
- HCO3: 13 mmol/L
- PaO2: 48 mmHg
- Base excess: -11
- pH 7.30 = Acidosis
- HCO3 13 (low), pCO2 28 (low) = Primary Metabolic Acidosis with respiratory compensation
- Winter's formula: Expected pCO2 = 1.5 × 13 + 8 = 27.5 ± 2 → Actual 28 = appropriate compensation
- PaO2 48 = Hypoxaemia (severe)
- A-a gradient elevated - lung disease contributing
- Diagnosis: Likely severe Bronchiolitis (RSV) with lactic acidosis from hypoxaemia/poor perfusion
- Management: Supplemental O2, consider HFNC, cautious fluid resuscitation; ABG to monitor CO2 rise (impending respiratory failure if pCO2 starts rising back to normal)
Red flag: If pCO2 normalises or rises in a tachypnoeic infant, it means respiratory muscles are exhausting - imminent intubation needed.
CASE 4: A Drowsy 12-Year-Old with Diabetes
- pH: 7.18
- pCO2: 18 mmHg
- HCO3: 7 mEq/L
- PaO2: 95 mmHg
- Blood glucose: 520 mg/dL
- Serum Na: 134 mEq/L, K: 5.1 mEq/L, Cl: 102 mEq/L
- Urinalysis: Glucose 4+, Ketones 3+
- pH 7.18 = severe acidosis
- HCO3 7 (low) = Primary Metabolic Acidosis
- Anion Gap = 134 - (102 + 7) = 25 mEq/L → High AG Metabolic Acidosis
- pCO2 18 = respiratory compensation (Kussmaul breathing). Winter's formula: expected 1.5 × 7 + 8 = 18.5 ✓ - appropriate compensation only
- Elevated glucose + ketones + HAGMA = Diabetic Ketoacidosis (DKA)
- K+ 5.1 = falsely normal - total body K is depleted; once insulin is given, K will fall rapidly
- Management: IV fluid resuscitation (0.9% NaCl), insulin infusion only after K >3.5, hourly glucose + electrolyte monitoring, watch for cerebral oedema (avoid rapid Na correction)
PART 3: SERUM ELECTROLYTES
Sodium (Na+)
| Severity | Level | Clinical Features |
|---|---|---|
| Mild | 130-135 | Often asymptomatic |
| Moderate | 125-130 | Nausea, headache, lethargy |
| Severe | <125 | Seizures, coma, herniation risk |
- Hypovolaemic: Gastroenteritis (most common in paediatrics), salt-wasting nephropathy, cerebral salt wasting
- Euvolaemic (SIADH): CNS infections (meningitis, encephalitis), pneumonia, bronchiolitis, post-surgical, pain, nausea
- Hypervolaemic: Nephrotic syndrome, cardiac failure, cirrhosis
- Serum Na <135 mEq/L
- Plasma osmolality <275 mOsm/kg
- Urine osmolality not maximally dilute (>100 mOsm/kg)
- Urine Na >20 mmol/L
- No hypovolemia, diuretics, or other cause of impaired free water excretion (Brenner & Rector's The Kidney)
Critical hospital-acquired risk: Hypotonic IV fluids + elevated ADH (from pain, illness, surgery) = acute hyponatremia. Incidence up to 10% in paediatric wards. Use isotonic fluids (0.9% NaCl) as maintenance to reduce risk.
- Acute symptomatic (seizures): 3% NaCl 2-3 mL/kg IV over 15-30 min (raise Na by ~5 mEq/L quickly to stop seizure)
- Chronic/SIADH: Fluid restriction. Rate of correction: never exceed 10-12 mEq/L in 24 hours (risk of osmotic demyelination syndrome, though rare in children)
- Hypervolaemic: Treat underlying cause
- Dehydration (hypernatraemic dehydration) - common in breastfed neonates with poor intake
- Diabetes insipidus (central or nephrogenic)
- Excessive sodium administration
Symptoms: Irritability, high-pitched cry, seizures, intracranial haemorrhage (brain shrinkage causing vein rupture)
Potassium (K+)
| Cause | Mechanism |
|---|---|
| Vomiting/NG losses | GI loss of K+ and H+ |
| Diarrhoea | GI K+ loss |
| Diuretics (furosemide) | Renal wasting |
| DKA treatment | K shifts into cells with insulin |
| Renal tubular acidosis | Renal wasting |
| Salbutamol excess | β2 agonist drives K into cells |
Normal in neonates up to 6 mEq/L; values up to 6.5 mEq/L may be acceptable in preterm infants.
| Cause in children | Example |
|---|---|
| Renal failure (AKI/CKD) | HUS, ATN |
| Haemolysis | Specimen artefact (pseudohyperkalaemia) |
| Acidosis | H+ shifts K+ out of cells |
| Adrenal insufficiency | Lack of aldosterone |
| K+ excess | Over-supplementation |
- Peaked T waves (K+ >5.5)
- Prolonged PR interval
- Widened QRS
- Sine wave pattern, VF/asystole (K+ >8)
- IV Calcium gluconate 10% - stabilise cardiac membrane (immediate)
- IV Insulin + Dextrose - shift K+ into cells
- Salbutamol nebulisation - shift K+ into cells
- Sodium bicarbonate (if acidotic) - shift K+ into cells
- Ion exchange resin (Resonium) / dialysis - remove K+ from body
CASE 5: Post-Gastroenteritis Electrolyte Chaos
- Na: 118 mEq/L
- K: 3.0 mEq/L
- Cl: 84 mEq/L
- HCO3: 14 mEq/L
- ABG pH: 7.28, pCO2: 30 mmHg
- Glucose: 3.2 mmol/L
- Na 118 = Severe hyponatremia - seizure is directly caused by this
- AG = 118 - (84 + 14) = 20 mEq/L → Mild HAGMA (lactic acidosis from poor perfusion)
- K 3.0 = Hypokalaemia (GI losses)
- Glucose borderline low
- Management:
- Emergency: 3% NaCl 2 mL/kg IV to terminate seizure (target Na rise of 5 mEq/L)
- IV fluid resuscitation with isotonic saline (correct hypovolaemia)
- Add K to fluids once urine output established
- Slow sodium correction thereafter (≤10 mEq/L/24h)
PART 4: CHEST X-RAY (CXR) IN PEDIATRICS
Systematic Approach to Paediatric CXR - "ABCDE"
- Trachea midline? Displacement = tension pneumothorax, large effusion, mass
- Assess subglottic width - narrowing (steeple sign) = Croup
- Symmetry of lung fields
- Look for consolidation (opacification, air bronchograms)
- Hyperinflation: >8-9 posterior ribs visible = air trapping (asthma, bronchiolitis)
- Interstitial patterns: viral infections, pulmonary oedema, interstitial lung disease
- Cardiothoracic ratio: >0.55 in children = cardiomegaly (different from adults >0.5)
- In infants: thymus can look like cardiomegaly - "sail sign" of thymus
- Assess cardiac borders for silhouette sign
- Costophrenic angles should be sharp - blunting = pleural effusion
- Right hemidiaphragm normally sits slightly higher
- Flattened diaphragm = hyperinflation
- Bones: fractures, rib notching (coarctation), periosteal reaction
- Soft tissues: surgical emphysema
- Lines/tubes position: ETT, NG tube, central lines
Key CXR Patterns in Paediatric Disease
- Dense, homogeneous opacity
- Air bronchograms within opacity = alveolar filling (pus, fluid)
- Silhouette sign: loss of heart or diaphragm border = tells you which lobe is affected
- Right middle lobe → obliterates right heart border
- Lower lobe → obliterates diaphragm
- Aetiology: Bacterial pneumonia (Strep pneumoniae), lobar pneumonia
- Perihilar/interstitial infiltrates bilaterally
- Often patchy, with preserved lung volumes or hyperinflation
- Aetiology: Viral infections (RSV, influenza), Mycoplasma, early pulmonary oedema
-
9 posterior ribs visible on PA view
- Flattened hemidiaphragms
- Increased AP diameter
- Peribronchial cuffing ("doughnut sign")
- Aetiology: Asthma, bronchiolitis, foreign body with ball-valve effect
- Anterior mediastinum mass = "4 T's": Teratoma, Thyroid, Thymoma, Terrible lymphoma
- Bilateral hilar enlargement: lymphoma, sarcoidosis, TB
- Blunted costophrenic angle (>200-300 mL)
- Homogeneous opacity, meniscus sign
- Trachea may deviate away (large effusion) or remain central
- Aetiology: Parapneumonic (empyema), nephrotic syndrome, cardiac failure, malignancy
CASE 6: Breathless 3-Year-Old After Choking Episode
- Right lung: hyperinflated, ribs spread wider than left
- Left lung: normal
- Trachea and mediastinum: shifted to the LEFT
- Diaphragm: right hemidiaphragm is flattened
- Unilateral hyperinflation = ball-valve foreign body obstruction
- Air enters on inspiration (bronchus dilates) but cannot exit on expiration (bronchus narrows over foreign body) → air trapping
- Mediastinal shift AWAY from the hyperinflated side (unlike collapse where it shifts TOWARD)
- Diagnosis: Right bronchial Foreign Body Aspiration
- Management: Urgent rigid bronchoscopy under GA for removal
Compare with CXR in expiration: the affected side stays hyperinflated while the normal side deflates - this accentuates the asymmetry and is a useful trick in young children who cannot hold their breath.
CASE 7: Fever + Tachypnoea in a 2-Year-Old
- Right lower lobe: Dense homogeneous opacity
- Blunting of right costophrenic angle
- Air bronchograms within the opacity
- Left lung: clear
- Trachea: central
- Dense opacity + air bronchograms = consolidation (alveolar filling - pus)
- Costophrenic blunting = parapneumonic pleural effusion
- Diagnosis: Right lower lobe bacterial pneumonia with parapneumonic effusion
- Management: Amoxicillin-clavulanate (first-line community-acquired pneumonia in hospitalised child); ultrasound effusion to guide drainage if loculated
CASE 8: Coughing Infant (2 months) with Poor Feeding
- Bilateral interstitial infiltrates/haze
- Hyperinflation (flattened diaphragms, 10 posterior ribs)
- Perihilar cuffing
- No pleural effusion
- Hyperinflation + bilateral interstitial changes in a 2-month-old = Bronchiolitis (RSV most likely)
- No lobar consolidation - argues against bacterial pneumonia
- Management: Supplemental O2, nasogastric feeds if unable to maintain oral intake, high-flow nasal cannula (HFNC) for moderate-severe cases, avoid antibiotics unless secondary bacterial infection suspected
QUICK REFERENCE: Integration of All 4 Investigations
| Clinical Scenario | Key RFT | Key ABG | Key Electrolyte | Key CXR |
|---|---|---|---|---|
| Severe dehydration | ↑BUN:Cr ratio >20:1 | Metabolic acidosis, compensated | ↓Na (hyponatraemic) or ↑Na (hypernatraemic), ↓K | Normal or small heart |
| DKA | Creatinine may ↑ (dehydration) | HAGMA, pH <7.2, Kussmaul | ↑K (initial, falls with insulin), ↓Na (dilutional) | Often normal |
| Nephrotic syndrome | Normal Cr, proteinuria 4+, ↑cholesterol | Normal | ↓Na (dilutional), normal K | Cardiomegaly if massive oedema |
| HUS/AKI | ↑↑Cr, ↑BUN, proteinuria, haematuria | HAGMA (uremic) | ↑↑K (life-threatening), ↓Na | Pulmonary oedema if fluid overloaded |
| Severe bronchiolitis | Normal | Metabolic acidosis ± impending respiratory failure (rising pCO2) | ↓Na (SIADH common) | Hyperinflation + bilateral infiltrates |
| Bacterial pneumonia | Normal | Respiratory alkalosis (pain/fever), or mixed | Mild ↑WBC, may have ↓Na (SIADH) | Lobar consolidation + possible effusion |
| Foreign body aspiration | Normal | ±Respiratory acidosis if severe | Normal | Unilateral hyperinflation |
SELF-DIRECTED LEARNING CHECKLIST
- Can I interpret BUN:Creatinine ratio to differentiate pre-renal, renal, and post-renal causes?
- Do I know the age-adjusted normal creatinine values for neonates, infants, and children?
- Can I apply the Schwartz formula for eGFR in children?
- Do I know what each type of urinary cast indicates?
- Can I apply the 5-step systematic approach to any ABG?
- Can I calculate the Anion Gap and apply Winter's formula?
- Can I differentiate HAGMA (MUDPILES) from NAGMA (HARDUPS)?
- Do I know the age-adjusted normal pCO2 and HCO3 in neonates vs older children?
- Can I diagnose and classify hyponatremia by volume status?
- Do I know the SIADH diagnostic criteria?
- Do I know the emergency management of severe hyponatremia with seizures?
- Can I list the ECG changes in hyperkalaemia in order of severity?
- Do I know the rate limits for sodium correction?
- Can I use the ABCDE approach systematically?
- Can I use the silhouette sign to locate which lobe is consolidated?
- Do I know the difference between consolidation and hyperinflation patterns?
- Can I identify a foreign body aspiration pattern on CXR?
- Miller's Anesthesia, 10e (Renal function tables, GFR, creatinine)
- Brenner & Rector's The Kidney (Hyponatraemia in children, SIADH)
- Murray & Nadel's Textbook of Respiratory Medicine (ABG interpretation)
- Pediatric Blood Gas Reference Intervals, UKLab
- LITFL - Acid-Base Interpretation