
Help me study ECG from zero
What is your background? · What is your main goal with ECG?
ECG interpretation basics for beginners complete guide
ECG From Zero: A Complete Beginner's Guide
PART 1 - What Is an ECG and Why Does It Work?
The Core Idea
"When a cardiac impulse passes through the heart, electrical current also spreads from the heart into the adjacent tissues surrounding the heart. A small portion of the current spreads all the way to the surface of the body." - Guyton & Hall Textbook of Medical Physiology
PART 2 - The Heart's Electrical System (The Pathway)
SA Node  →  Atria  →  AV Node  →  Bundle of His
    →  Right & Left Bundle Branches  →  Purkinje Fibers  →  Ventricles
| Structure | What it does |
|---|---|
| SA Node (sinoatrial) | The natural pacemaker. Fires 60-100 times per minute. Located in the right atrium. |
| Atria | Two upper chambers. Depolarize (activate) and contract, pushing blood into the ventricles. |
| AV Node (atrioventricular) | A relay station. Deliberately slows the signal down to give ventricles time to fill with blood. |
| Bundle of His | A fast highway carrying the signal into the ventricles. |
| Bundle Branches (L & R) | Split to cover both ventricles. |
| Purkinje Fibers | The finest branches. Deliver electricity directly to heart muscle cells. |

PART 3 - The ECG Waves: What Each One Means
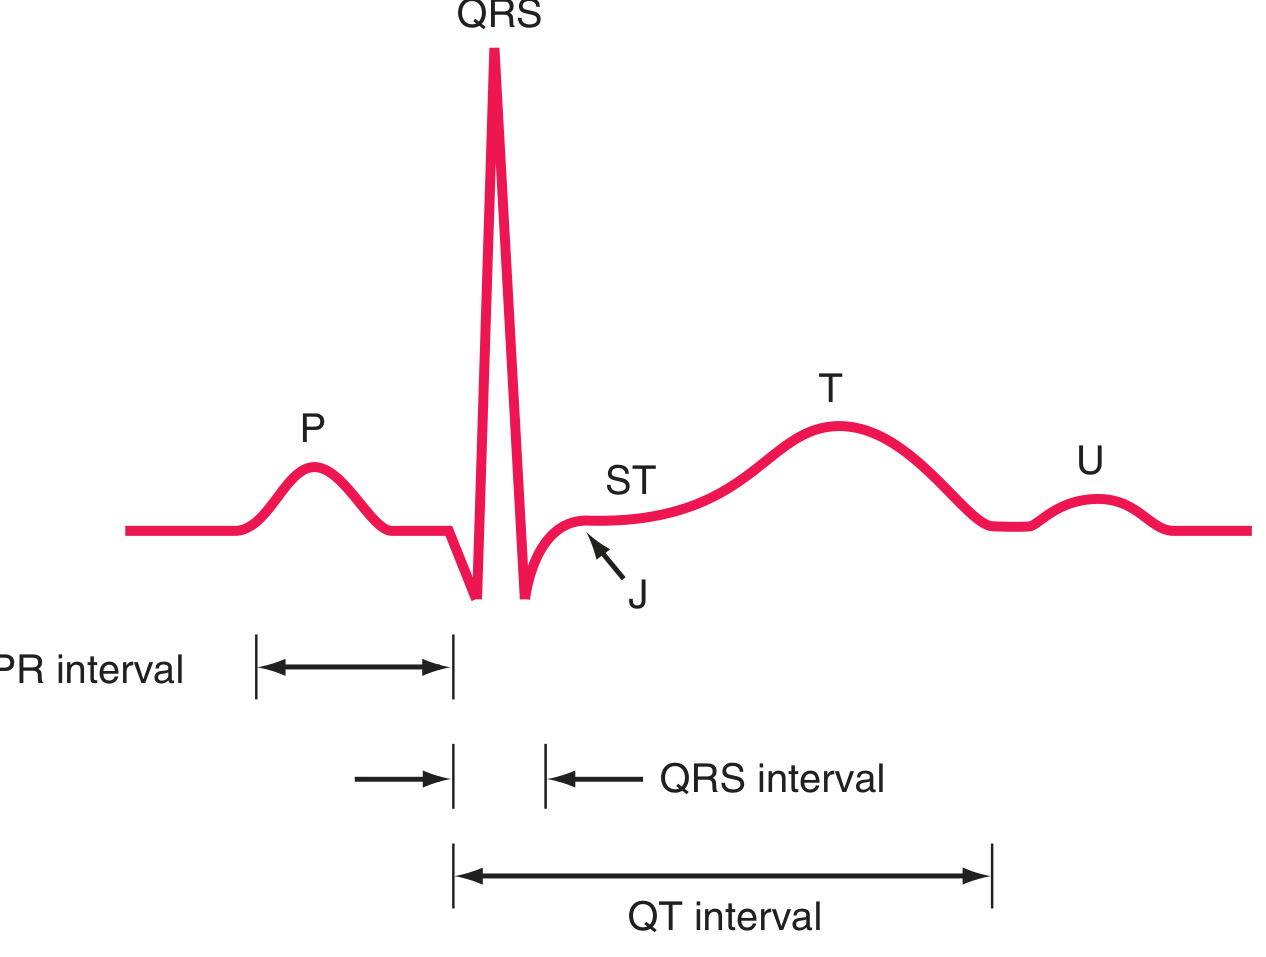
The Waves
| Wave / Segment | What it represents | Normal look |
|---|---|---|
| P wave | Atrial depolarization (atria fire and contract) | Small, rounded bump |
| PR interval | Time for signal to travel from SA node through AV node to ventricles | Flat line after P wave |
| QRS complex | Ventricular depolarization (ventricles fire) - the main pumping event | Tall, sharp spike |
| ST segment | Ventricles are contracting - no net current flow | Flat, at the baseline (isoelectric) |
| T wave | Ventricular repolarization (ventricles "recharge") | Rounded bump after QRS |
| U wave | Late repolarization (not always visible) | Small bump after T wave |
| J point | Junction between QRS end and ST segment start | Point of transition |
"The P wave is caused by electrical potentials generated when the atria depolarize... The QRS complex is caused by potentials generated when the ventricles depolarize... The T wave is caused by potentials generated as the ventricles recover from depolarization. This process normally occurs in ventricular muscle 0.25 to 0.35 second after depolarization. The T wave is known as a repolarization wave."
PART 4 - The ECG Paper and Normal Values
The Grid
- Each small box = 1 mm wide = 40 ms (0.04 seconds) in time
- Each large box = 5 mm wide = 200 ms (0.20 seconds)
- Vertically: 1 mV = 10 mm (10 small boxes tall)
Key Normal Intervals
| Interval | What it measures | Normal value |
|---|---|---|
| PR interval | AV node conduction time | 120-200 ms (3-5 small boxes) |
| QRS duration | Ventricular depolarization time | < 100-110 ms (< 2.5 small boxes) |
| QT interval | Total ventricular electrical activity | < 450 ms (men), < 460 ms (women) |
| Heart rate | Beats per minute | 60-100 bpm |
How to Calculate Heart Rate (2 easy methods)
- 1 large box = 300 bpm
- 2 large boxes = 150 bpm
- 3 large boxes = 100 bpm
- 4 large boxes = 75 bpm
- 5 large boxes = 60 bpm
PART 5 - The 12 Leads: Different "Camera Angles"
"Each lead is analogous to a different video camera angle 'looking' at the same events - atrial and ventricular depolarization and repolarization - from different spatial orientations." - Harrison's Principles of Internal Medicine
The Two Groups
- Lead I, II, III (standard limb leads)
- aVR, aVL, aVF (augmented leads)
- V1, V2, V3, V4, V5, V6 (placed across the chest)
Which Leads "See" Which Part of the Heart?
| Territory | Leads | Artery at risk |
|---|---|---|
| Inferior wall | II, III, aVF | Right coronary artery (RCA) |
| Lateral wall | I, aVL, V5, V6 | Left circumflex artery (LCx) |
| Anterior wall | V1-V4 | Left anterior descending (LAD) |
| Septal | V1, V2 | LAD |
PART 6 - A Systematic 8-Step Approach to Reading Any ECG
Step 1: Rate
- Is it normal (60-100 bpm), fast (tachycardia >100), or slow (bradycardia <60)?
- Use the 300 / large boxes method above.
Step 2: Rhythm
- Is it regular (all R-R intervals equal) or irregular?
- Is there a P wave before every QRS? Is there a QRS after every P?
- A normal sinus rhythm = P wave before every QRS, rate 60-100, regular.
Step 3: Axis
- The electrical axis tells you the average direction of ventricular depolarization.
- Quick screen: If the QRS is upright (positive) in Lead I AND in Lead aVF = normal axis (roughly 0° to +90°).
- Left axis deviation (LAD): positive in I, negative in aVF.
- Right axis deviation (RAD): negative in I, positive in aVF.
Step 4: P waves
- Are they present? Are they the same shape in each lead?
- Normal P wave: upright in Lead II, inverted in aVR, duration < 120 ms, amplitude < 2.5 mm.
- Absent P waves suggest atrial fibrillation.
- Abnormally shaped P waves suggest atrial enlargement or ectopic pacemaker.
Step 5: PR interval
- Normal = 120-200 ms (3-5 small boxes).
- Long PR (>200 ms) = First-degree AV block (slow conduction through AV node).
- Progressively lengthening PR = Mobitz type 1 (Wenckebach) block.
- Constant PR but dropped QRS = Mobitz type 2 block.
- No relationship between P and QRS = Complete (3rd degree) heart block - emergency!
- Short PR = pre-excitation (e.g., Wolff-Parkinson-White syndrome).
Step 6: QRS complex
- Normal duration < 110 ms.
- Wide QRS (>120 ms) = Bundle branch block or ventricular origin rhythm.
- Left Bundle Branch Block (LBBB): Wide QRS, "M" pattern in V5-V6, dominant S in V1.
- Right Bundle Branch Block (RBBB): Wide QRS, "RSR'" (rabbit ears) pattern in V1.
- Pathological Q waves: > 1 small box wide OR > 25% of R wave height = suggests old myocardial infarction (MI).
- Check voltage: tall QRS may indicate ventricular hypertrophy.
Step 7: ST segment and T waves
| Finding | Meaning |
|---|---|
| ST elevation (above baseline) | STEMI (ST-elevation myocardial infarction) - heart attack in progress - call for help immediately |
| ST depression (below baseline) | Ischemia (reduced blood supply) or NSTEMI |
| T wave inversion | Ischemia, LVH, bundle branch block, pulmonary embolism |
| Tall, peaked T waves | Hyperkalemia (high potassium - dangerous) |
| Flat T waves | Hypokalemia, ischemia |
Step 8: QT interval
- Measure from start of QRS to end of T wave.
- Prolonged QT is dangerous - can trigger a lethal arrhythmia called Torsades de Pointes.
- Causes: drugs (many antiarrhythmics, antipsychotics, antibiotics), electrolyte disturbances (low K+, low Mg2+, low Ca2+), congenital long QT syndrome.
PART 7 - Common ECG Patterns to Know
Atrial Fibrillation (AF) - The Most Common Arrhythmia
- Irregularly irregular rhythm (totally chaotic R-R intervals)
- No distinct P waves - replaced by a chaotic, fibrillating baseline
- Normal QRS (unless conduction abnormality)
Sinus Tachycardia
- Rate > 100 bpm, but normal P-QRS-T morphology
- Causes: fever, pain, anxiety, blood loss, hyperthyroidism
Sinus Bradycardia
- Rate < 60 bpm, otherwise normal morphology
- Can be normal in athletes; may indicate sick sinus syndrome
STEMI (Heart Attack in Progress)
- ST elevation ≥ 1 mm in 2 or more contiguous leads
- Reciprocal ST depression in opposite leads
- Evolves over hours: hyperacute T waves → ST elevation → Q waves → T inversion
Ventricular Fibrillation (VF) - Cardiac Arrest
- Completely chaotic baseline, no recognizable waves
- No cardiac output - patient is in cardiac arrest
- Requires immediate defibrillation
Ventricular Tachycardia (VT)
- Wide, bizarre QRS complexes at rate > 100 bpm
- Can deteriorate to VF - urgent treatment needed
PART 8 - The Cardiac Cycle Tied to the ECG
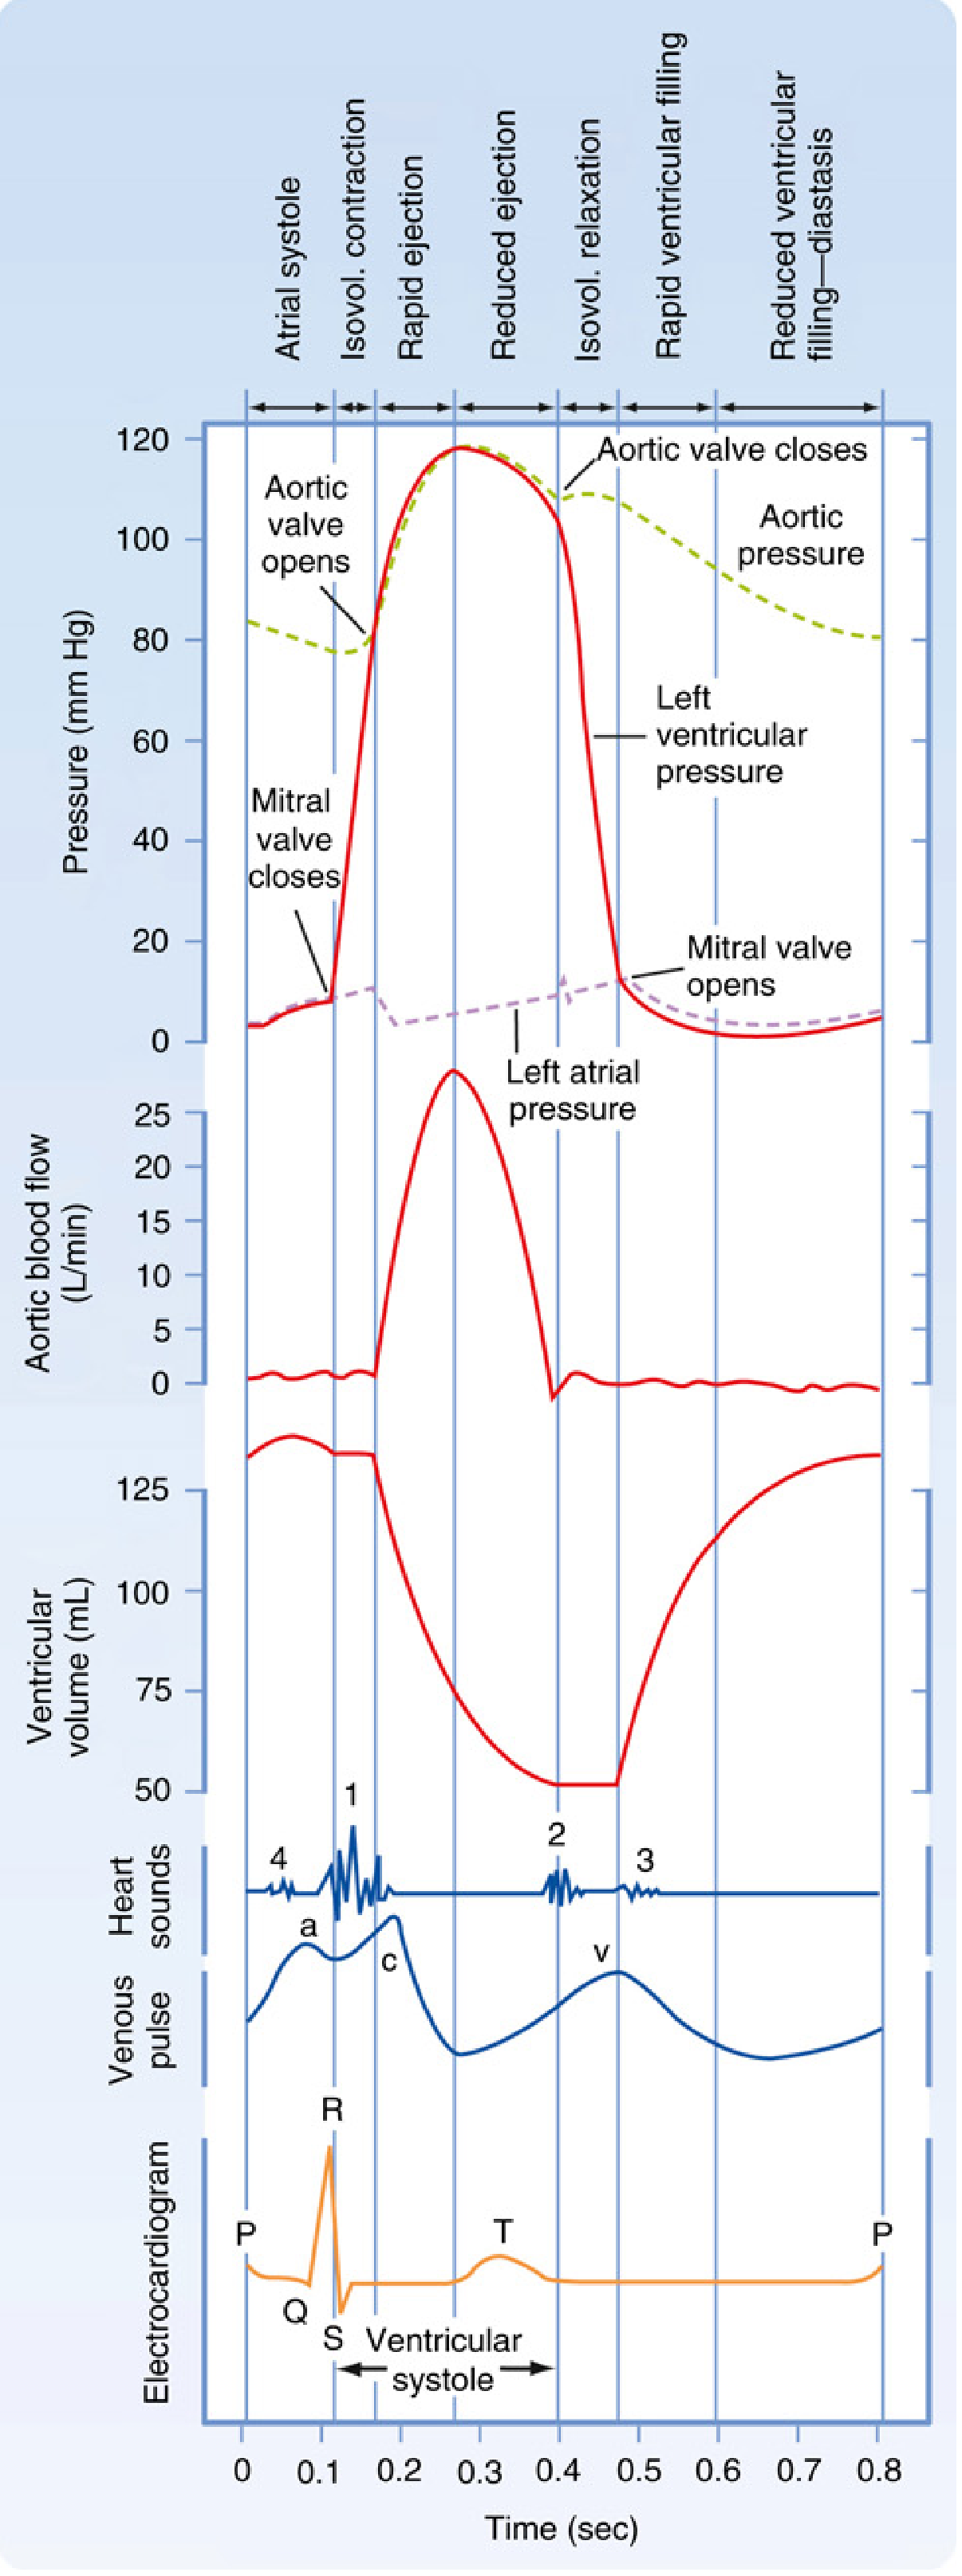
- P wave fires → atria contract (atrial systole) → blood fills ventricles
- QRS fires → ventricles contract → aortic valve opens → blood ejected
- T wave → ventricles relax → aortic valve closes → heart refills
- The cycle repeats with the next P wave
PART 9 - How to Practice (Learning Roadmap)
| Stage | What to do |
|---|---|
| Week 1 | Memorize the wave sequence (P-QRS-T), normal intervals, and the 8-step approach |
| Week 2 | Practice calculating rate and recognizing normal sinus rhythm on 20+ ECGs |
| Week 3 | Add AF, bundle branch blocks, STEMI recognition |
| Week 4+ | Work through clinical cases with diagnosis |
Free Resources
-
Life in the Fast Lane ECG Library - the best free online ECG reference with hundreds of examples and detailed explanations.
-
Geeky Medics ECG Guide - a clear step-by-step written guide with images.
Quick Reference Cheat Sheet
NORMAL VALUES
  Rate:         60-100 bpm
  PR interval:  120-200 ms  (3-5 small boxes)
  QRS duration: < 110 ms    (< 2.5 small boxes)
  QT interval:  < 450 ms (M), < 460 ms (F)

WAVE MEANING
  P wave   = atria depolarize
  QRS      = ventricles depolarize (contract)
  T wave   = ventricles repolarize (recharge)
  ST seg   = ventricles fully contracted

8 STEPS
  1. Rate
  2. Rhythm
  3. Axis
  4. P waves
  5. PR interval
  6. QRS complex
  7. ST + T waves
  8. QT interval

RED FLAGS (act fast)
  ST elevation     → STEMI
  Wide QRS + fast  → VT
  No P waves + irregular → AF
  Prolonged QT     → risk of Torsades
  Complete AV block → emergency
Create a comprehensive ECG study guide PDF I can print
mkdir -p /tmp/workspace/ecg-study-guide && ls /tmp/workspace/ecg-study-guide/
~/ecg-study-guide/generate_ecg_pdf.py
"""
Comprehensive ECG Study Guide PDF Generator
Uses reportlab with custom drawings for ECG waveforms, tables, and structured content.
"""
from reportlab.lib.pagesizes import A4
from reportlab.lib import colors
from reportlab.lib.units import mm, cm
from reportlab.lib.styles import getSampleStyleSheet, ParagraphStyle
from reportlab.lib.enums import TA_CENTER, TA_LEFT, TA_JUSTIFY
from reportlab.platypus import (
SimpleDocTemplate, Paragraph, Spacer, Table, TableStyle,
PageBreak, HRFlowable, KeepTogether
)
from reportlab.platypus.flowables import Flowable
from reportlab.pdfgen import canvas
from reportlab.graphics.shapes import Drawing, Line, Rect, String, Path, Circle
from reportlab.graphics import renderPDF
import math
# ── Colours ────────────────────────────────────────────────────────────────────
NAVY = colors.HexColor("#1A2C5B")
TEAL = colors.HexColor("#0D7B8A")
RED = colors.HexColor("#C0392B")
ORANGE = colors.HexColor("#E67E22")
GREEN = colors.HexColor("#1E8449")
LIGHT_BG = colors.HexColor("#F0F4F8")
LIGHT_TEAL= colors.HexColor("#E8F6F8")
LIGHT_RED = colors.HexColor("#FDEDEC")
LIGHT_YEL = colors.HexColor("#FEF9E7")
GRID_COL = colors.HexColor("#FFCCCC")
GRID_DARK = colors.HexColor("#FF9999")
ECG_COL = colors.HexColor("#C0392B")
BOX_BORDER= colors.HexColor("#2E86AB")
DARK_GREY = colors.HexColor("#2C3E50")
MID_GREY = colors.HexColor("#7F8C8D")
PAGE_W, PAGE_H = A4
# ── Styles ─────────────────────────────────────────────────────────────────────
styles = getSampleStyleSheet()
def make_styles():
s = {}
s['cover_title'] = ParagraphStyle('cover_title',
fontSize=34, textColor=colors.white, fontName='Helvetica-Bold',
spaceAfter=8, alignment=TA_CENTER, leading=40)
s['cover_sub'] = ParagraphStyle('cover_sub',
fontSize=14, textColor=colors.HexColor("#BDC3C7"), fontName='Helvetica',
spaceAfter=6, alignment=TA_CENTER, leading=18)
s['cover_note'] = ParagraphStyle('cover_note',
fontSize=11, textColor=colors.HexColor("#ECF0F1"), fontName='Helvetica',
spaceAfter=4, alignment=TA_CENTER, leading=14)
s['ch_title'] = ParagraphStyle('ch_title',
fontSize=20, textColor=colors.white, fontName='Helvetica-Bold',
spaceAfter=4, leading=24)
s['section'] = ParagraphStyle('section',
fontSize=13, textColor=NAVY, fontName='Helvetica-Bold',
spaceBefore=10, spaceAfter=4, leading=16,
borderPad=0)
s['subsection'] = ParagraphStyle('subsection',
fontSize=11, textColor=TEAL, fontName='Helvetica-Bold',
spaceBefore=6, spaceAfter=2, leading=14)
s['body'] = ParagraphStyle('body',
fontSize=9.5, textColor=DARK_GREY, fontName='Helvetica',
spaceAfter=4, leading=14, alignment=TA_JUSTIFY)
s['body_b'] = ParagraphStyle('body_b',
fontSize=9.5, textColor=DARK_GREY, fontName='Helvetica-Bold',
spaceAfter=3, leading=14)
s['bullet'] = ParagraphStyle('bullet',
fontSize=9.5, textColor=DARK_GREY, fontName='Helvetica',
spaceAfter=3, leading=13, leftIndent=14, firstLineIndent=-10)
s['small'] = ParagraphStyle('small',
fontSize=8, textColor=MID_GREY, fontName='Helvetica',
spaceAfter=2, leading=11, alignment=TA_CENTER)
s['caption'] = ParagraphStyle('caption',
fontSize=8.5, textColor=MID_GREY, fontName='Helvetica-Oblique',
spaceAfter=4, leading=11, alignment=TA_CENTER)
s['callout'] = ParagraphStyle('callout',
fontSize=9.5, textColor=DARK_GREY, fontName='Helvetica',
spaceAfter=3, leading=13, leftIndent=12, rightIndent=6)
s['mono'] = ParagraphStyle('mono',
fontSize=8.5, textColor=DARK_GREY, fontName='Courier',
spaceAfter=2, leading=12, leftIndent=10)
s['red_bold'] = ParagraphStyle('red_bold',
fontSize=10, textColor=RED, fontName='Helvetica-Bold',
spaceAfter=2, leading=13)
s['toc_entry'] = ParagraphStyle('toc_entry',
fontSize=10, textColor=NAVY, fontName='Helvetica',
spaceAfter=5, leading=14, leftIndent=6)
s['toc_ch'] = ParagraphStyle('toc_ch',
fontSize=12, textColor=NAVY, fontName='Helvetica-Bold',
spaceAfter=4, spaceBefore=8, leading=16)
return s
# ── Helpers ────────────────────────────────────────────────────────────────────
def colored_table(data, col_widths, header_bg=NAVY, header_fg=colors.white,
alt_bg=LIGHT_BG, font_size=9):
"""Build a nicely styled table."""
n_cols = len(data[0])
ts = TableStyle([
# Header
('BACKGROUND', (0,0), (-1,0), header_bg),
('TEXTCOLOR', (0,0), (-1,0), header_fg),
('FONTNAME', (0,0), (-1,0), 'Helvetica-Bold'),
('FONTSIZE', (0,0), (-1,0), font_size),
('ALIGN', (0,0), (-1,0), 'CENTER'),
('BOTTOMPADDING', (0,0), (-1,0), 5),
('TOPPADDING', (0,0), (-1,0), 5),
# Body
('FONTNAME', (0,1), (-1,-1), 'Helvetica'),
('FONTSIZE', (0,1), (-1,-1), font_size - 0.5),
('TOPPADDING', (0,1), (-1,-1), 4),
('BOTTOMPADDING', (0,1), (-1,-1), 4),
('LEFTPADDING', (0,0), (-1,-1), 6),
('RIGHTPADDING', (0,0), (-1,-1), 6),
# Alternating rows
*[('BACKGROUND', (0,i), (-1,i), alt_bg) for i in range(2, len(data), 2)],
# Grid
('GRID', (0,0), (-1,-1), 0.4, colors.HexColor("#C8D0DA")),
('ROWBACKGROUNDS', (0,1), (-1,-1), [colors.white, alt_bg]),
('VALIGN', (0,0), (-1,-1), 'MIDDLE'),
])
t = Table(data, colWidths=col_widths)
t.setStyle(ts)
return t
def info_box(story, text, S, bg=LIGHT_TEAL, border=TEAL, icon="ℹ"):
"""Coloured info/alert box."""
box_data = [[Paragraph(f'<b>{icon}</b>', S['body_b']),
Paragraph(text, S['callout'])]]
box = Table(box_data, colWidths=[14*mm, 145*mm])
box.setStyle(TableStyle([
('BACKGROUND', (0,0), (-1,-1), bg),
('LINEAFTER', (0,0), (0,-1), 1.5, border),
('LEFTPADDING', (0,0), (-1,-1), 6),
('RIGHTPADDING', (0,0), (-1,-1), 6),
('TOPPADDING', (0,0), (-1,-1), 5),
('BOTTOMPADDING', (0,0), (-1,-1), 5),
('VALIGN', (0,0), (-1,-1), 'MIDDLE'),
]))
story.append(box)
story.append(Spacer(1, 4))
def warning_box(story, text, S):
info_box(story, text, S, bg=LIGHT_RED, border=RED, icon="⚠")
def key_box(story, text, S):
info_box(story, text, S, bg=LIGHT_YEL, border=ORANGE, icon="★")
# ── ECG Drawings ────────────────────────────────────────────────────────────────
class ECGWaveformDrawing(Flowable):
"""
Draws a labelled single-beat ECG waveform on ECG paper grid.
"""
def __init__(self, width=160*mm, height=55*mm):
Flowable.__init__(self)
self.width = width
self.height = height
def draw(self):
c = self._canvas
w, h = self.width, self.height
# ── ECG paper grid ──────────────────────────────────────────────────
small = w / 50 # 1 small box width
smh = h / 14 # 1 small box height
# Light grid (1 mm)
c.setStrokeColor(GRID_COL)
c.setLineWidth(0.3)
x = 0
while x <= w:
c.line(x, 0, x, h); x += small
y = 0
while y <= h:
c.line(0, y, w, y); y += smh
# Dark grid (5 mm)
c.setStrokeColor(GRID_DARK)
c.setLineWidth(0.7)
x = 0
while x <= w:
c.line(x, 0, x, h); x += small*5
y = 0
while y <= h:
c.line(0, y, w, y); y += smh*5
# ── Baseline ───────────────────────────────────────────────────────
baseline = h * 0.38
margin = small * 2
scale_x = small # 1 small box = 40 ms
scale_y = smh * 2 # 1 mV = 10 mm = 5 * smh*2
# ── Draw ECG trace ─────────────────────────────────────────────────
c.setStrokeColor(ECG_COL)
c.setLineWidth(1.8)
c.setLineCap(1)
# Coordinates as fractions of one beat (total ~200 small boxes = 800ms)
# Each unit below = 1 small box (40ms) horizontally
# Y values in mV from baseline
beats = [
# (x_small_boxes, y_mV)
(0, 0), (2, 0),
# P wave
(4, 0.05), (5, 0.15), (6, 0.22), (7, 0.15), (8, 0.05), (10, 0),
# PR segment
(13, 0),
# Q wave
(14, -0.1),
# R wave
(15.5, 1.3),
# S wave
(17, -0.25),
(18, 0),
# ST segment (slight elevation = normal)
(20, 0.03),
(26, 0.03),
# T wave
(28, 0.05), (31, 0.32), (34, 0.05),
# After T / U wave
(36, 0), (38, 0.04), (39, 0.07), (40, 0.04), (42, 0),
# Trailing
(45, 0),
]
pts = [(margin + x * scale_x, baseline + y * scale_y) for x, y in beats]
path = c.beginPath()
path.moveTo(*pts[0])
# Smooth curves between points using simple interpolation
for i in range(1, len(pts)):
x0, y0 = pts[i-1]
x1, y1 = pts[i]
# For sharp features (Q, R, S) use straight lines
if abs(y1 - y0) / (scale_y + 0.001) > 0.4:
path.lineTo(x1, y1)
else:
cx = (x0 + x1) / 2
path.curveTo(cx, y0, cx, y1, x1, y1)
c.drawPath(path, stroke=1, fill=0)
# ── Labels ─────────────────────────────────────────────────────────
c.setFont('Helvetica-Bold', 8)
def label(text, x_box, y_mv, dx=0, dy=6, col=NAVY):
px = margin + x_box * scale_x + dx
py = baseline + y_mv * scale_y + dy
c.setFillColor(col)
c.drawCentredString(px, py, text)
def bracket(x1_box, x2_box, y_box=-1.8, text="", col=TEAL):
"""Horizontal bracket below the trace."""
y = baseline + y_box * smh
x1 = margin + x1_box * scale_x
x2 = margin + x2_box * scale_x
c.setStrokeColor(col)
c.setFillColor(col)
c.setLineWidth(0.8)
# line
c.line(x1, y, x2, y)
c.line(x1, y, x1, y + smh*0.5)
c.line(x2, y, x2, y + smh*0.5)
c.setFont('Helvetica', 7)
c.drawCentredString((x1+x2)/2, y - 7, text)
# Wave labels
label("P", 6, 0.22 + 0.05)
label("Q", 14, -0.10 - 0.12, col=RED)
label("R", 15.5, 1.3 + 0.06, col=RED)
label("S", 17, -0.25 - 0.13, col=RED)
label("T", 31, 0.32 + 0.06)
label("U", 39, 0.07 + 0.04)
label("J", 18, 0.0 + 0.04)
# ST segment label
c.setFont('Helvetica', 7)
c.setFillColor(GREEN)
sx = margin + 23 * scale_x
sy = baseline + 0.03 * scale_y + 5
c.drawCentredString(sx, sy, "ST")
# Interval brackets
bracket(4, 13, y_box=-2.5, text="PR interval", col=TEAL)
bracket(13, 34, y_box=-4.2, text="QT interval", col=NAVY)
bracket(13, 18, y_box=-1.0, text="QRS", col=RED)
# Calibration box (1 mV pulse) at far left
cx0 = small * 0.5
bw = small * 1.0
bh = smh * 5 # 1 mV = 10mm = 5 small boxes
c.setStrokeColor(DARK_GREY)
c.setLineWidth(1.2)
c.line(cx0, baseline, cx0, baseline)
c.line(cx0, baseline, cx0, baseline + bh)
c.line(cx0, baseline + bh, cx0 + bw, baseline + bh)
c.line(cx0 + bw, baseline + bh, cx0 + bw, baseline)
c.setFont('Helvetica', 6)
c.setFillColor(DARK_GREY)
c.drawCentredString(cx0 + bw/2, baseline + bh + 3, "1 mV")
# Speed annotation
c.setFont('Helvetica', 7)
c.setFillColor(MID_GREY)
c.drawString(w - 45*mm, 4, "25 mm/s | 1 mV = 10 mm")
class ECGPaperScaleDrawing(Flowable):
"""Shows a zoomed ECG paper grid with measurements."""
def __init__(self, width=120*mm, height=40*mm):
Flowable.__init__(self)
self.width = width
self.height = height
def draw(self):
c = self._canvas
w, h = self.width, self.height
cols = 25
rows = 8
sw = w / cols
sh = h / rows
# Grid
for i in range(cols+1):
x = i * sw
c.setStrokeColor(GRID_COL if i % 5 != 0 else GRID_DARK)
c.setLineWidth(0.3 if i % 5 != 0 else 0.8)
c.line(x, 0, x, h)
for j in range(rows+1):
y = j * sh
c.setStrokeColor(GRID_COL if j % 5 != 0 else GRID_DARK)
c.setLineWidth(0.3 if j % 5 != 0 else 0.8)
c.line(0, y, w, y)
# Annotations
c.setFont('Helvetica-Bold', 8)
c.setFillColor(TEAL)
# Small box: 1mm = 40ms
c.setStrokeColor(TEAL)
c.setLineWidth(1.2)
bx, by = sw, sh * 2
c.rect(bx, by, sw, sh, stroke=1, fill=0)
c.setFillColor(TEAL)
c.drawCentredString(bx + sw/2, by + sh + 3, "1 small box")
c.setFont('Helvetica', 7)
c.drawCentredString(bx + sw/2, by - 9, "= 1mm = 40ms")
# Large box: 5mm = 200ms
c.setFont('Helvetica-Bold', 8)
c.setStrokeColor(NAVY)
c.setLineWidth(1.5)
bx2, by2 = sw*10, sh*1
c.rect(bx2, by2, sw*5, sh*5, stroke=1, fill=0)
c.setFillColor(NAVY)
c.drawCentredString(bx2 + sw*2.5, by2 + sh*5 + 3, "1 large box")
c.setFont('Helvetica', 7)
c.drawCentredString(bx2 + sw*2.5, by2 - 9, "= 5mm = 200ms")
# Voltage arrow
ax = w - sw * 3
c.setStrokeColor(GREEN)
c.setFillColor(GREEN)
c.setLineWidth(1.2)
c.line(ax, sh, ax, sh*6)
c.setFont('Helvetica-Bold', 7.5)
c.drawString(ax + 2, sh*3, "10mm = 1mV")
class HeartAnatomyDiagram(Flowable):
"""Simple schematic of the cardiac conduction system."""
def __init__(self, width=150*mm, height=80*mm):
Flowable.__init__(self)
self.width = width
self.height = height
def draw(self):
c = self._canvas
w, h = self.width, self.height
# Background
c.setFillColor(colors.HexColor("#F8FBFF"))
c.rect(0, 0, w, h, stroke=0, fill=1)
# ── Heart outline (simplified) ──────────────────────────────────────
c.setStrokeColor(colors.HexColor("#C0392B"))
c.setLineWidth(1.5)
c.setFillColor(colors.HexColor("#FDECEA"))
# Right atrium (top left)
c.roundRect(w*0.12, h*0.52, w*0.22, h*0.30, 8, stroke=1, fill=1)
# Left atrium (top right)
c.roundRect(w*0.45, h*0.52, w*0.22, h*0.30, 8, stroke=1, fill=1)
# Right ventricle (bottom left)
c.setFillColor(colors.HexColor("#FDEDEC"))
c.roundRect(w*0.12, h*0.12, w*0.22, h*0.35, 8, stroke=1, fill=1)
# Left ventricle (bottom right)
c.roundRect(w*0.45, h*0.12, w*0.22, h*0.35, 8, stroke=1, fill=1)
# ── Labels for chambers ────────────────────────────────────────────
c.setFont('Helvetica', 7)
c.setFillColor(DARK_GREY)
c.drawCentredString(w*0.23, h*0.66, "Right")
c.drawCentredString(w*0.23, h*0.59, "Atrium")
c.drawCentredString(w*0.56, h*0.66, "Left")
c.drawCentredString(w*0.56, h*0.59, "Atrium")
c.drawCentredString(w*0.23, h*0.28, "Right")
c.drawCentredString(w*0.23, h*0.21, "Ventricle")
c.drawCentredString(w*0.56, h*0.28, "Left")
c.drawCentredString(w*0.56, h*0.21, "Ventricle")
# ── Conduction pathway ─────────────────────────────────────────────
dot_r = 3.5
def node(x, y, label, col=TEAL, side='right'):
c.setFillColor(col)
c.circle(x, y, dot_r, stroke=0, fill=1)
c.setFillColor(col)
c.setFont('Helvetica-Bold', 7.5)
if side == 'right':
c.drawString(x + 6, y - 3, label)
else:
c.drawRightString(x - 6, y - 3, label)
def arrow(x1, y1, x2, y2, col=TEAL):
c.setStrokeColor(col)
c.setLineWidth(1.3)
c.line(x1, y1, x2, y2)
# Arrowhead
dx, dy = x2-x1, y2-y1
length = math.sqrt(dx**2 + dy**2)
if length < 0.001: return
ux, uy = dx/length, dy/length
ax1 = x2 - 6*ux + 3*uy
ay1 = y2 - 6*uy - 3*ux
ax2 = x2 - 6*ux - 3*uy
ay2 = y2 - 6*uy + 3*ux
c.setFillColor(col)
p = c.beginPath()
p.moveTo(x2, y2)
p.lineTo(ax1, ay1)
p.lineTo(ax2, ay2)
p.close()
c.drawPath(p, stroke=0, fill=1)
# SA Node
sa_x, sa_y = w*0.18, h*0.80
node(sa_x, sa_y, "SA Node (Pacemaker)", col=GREEN, side='right')
# AV Node
av_x, av_y = w*0.34, h*0.50
arrow(sa_x, sa_y - dot_r, av_x, av_y + dot_r, col=GREEN)
node(av_x, av_y, "AV Node (Delay)", col=ORANGE)
# Bundle of His
his_x, his_y = w*0.34, h*0.36
arrow(av_x, av_y - dot_r, his_x, his_y + dot_r, col=ORANGE)
node(his_x, his_y, "Bundle of His", col=ORANGE)
# Bundle branches
rbb_x, rbb_y = w*0.20, h*0.22
lbb_x, lbb_y = w*0.48, h*0.22
arrow(his_x, his_y - dot_r, rbb_x, rbb_y + dot_r, col=TEAL)
arrow(his_x, his_y - dot_r, lbb_x, lbb_y + dot_r, col=TEAL)
node(rbb_x, rbb_y, "R. Branch", col=TEAL, side='left')
node(lbb_x, lbb_y, "L. Branch", col=TEAL)
# Purkinje
pk_x, pk_y = w*0.34, h*0.08
arrow(rbb_x, rbb_y - dot_r, pk_x, pk_y + dot_r, col=NAVY)
arrow(lbb_x, lbb_y - dot_r, pk_x, pk_y + dot_r, col=NAVY)
node(pk_x, pk_y, "Purkinje Fibers → Myocardium", col=NAVY)
# Timeline labels on right
c.setFont('Helvetica', 7)
c.setFillColor(GREEN)
c.drawString(w*0.82, h*0.78, "→ P wave")
c.setFillColor(ORANGE)
c.drawString(w*0.82, h*0.48, "→ PR interval")
c.setFillColor(TEAL)
c.drawString(w*0.82, h*0.20, "→ QRS complex")
# Title
c.setFont('Helvetica-Bold', 9)
c.setFillColor(NAVY)
c.drawCentredString(w/2, h*0.95, "Cardiac Conduction System & ECG Correlation")
class LeadsDiagram(Flowable):
"""12-lead placement schematic."""
def __init__(self, width=155*mm, height=75*mm):
Flowable.__init__(self)
self.width = width
self.height = height
def draw(self):
c = self._canvas
w, h = self.width, self.height
c.setFillColor(LIGHT_BG)
c.rect(0, 0, w, h, stroke=0, fill=1)
# Title
c.setFont('Helvetica-Bold', 9)
c.setFillColor(NAVY)
c.drawCentredString(w/2, h - 10, "12-Lead ECG Placement & Territories")
# Body outline
body_cx, body_cy = w * 0.32, h * 0.45
body_w, body_h = w*0.26, h*0.70
c.setStrokeColor(colors.HexColor("#E8B4B8"))
c.setFillColor(colors.HexColor("#FDF2F3"))
c.setLineWidth(1)
c.roundRect(body_cx - body_w/2, body_cy - body_h/2,
body_w, body_h, 15, stroke=1, fill=1)
# Chest lead positions
c.setFont('Helvetica-Bold', 7)
leads_pos = [
("V1", body_cx - body_w*0.22, body_cy + body_h*0.10),
("V2", body_cx - body_w*0.08, body_cy + body_h*0.12),
("V3", body_cx + body_w*0.05, body_cy + body_h*0.08),
("V4", body_cx + body_w*0.18, body_cy + body_h*0.03),
("V5", body_cx + body_w*0.27, body_cy - body_h*0.05),
("V6", body_cx + body_w*0.33, body_cy - body_h*0.14),
]
for name, lx, ly in leads_pos:
c.setFillColor(RED)
c.circle(lx, ly, 4, stroke=0, fill=1)
c.setFillColor(RED)
c.drawCentredString(lx, ly + 7, name)
# Limb lead positions
limb_leads = [
("RA", body_cx - body_w*0.30, body_cy + body_h*0.35, TEAL),
("LA", body_cx + body_w*0.30, body_cy + body_h*0.35, TEAL),
("RL", body_cx - body_w*0.30, body_cy - body_h*0.40, MID_GREY),
("LL", body_cx + body_w*0.30, body_cy - body_h*0.40, GREEN),
]
for name, lx, ly, col in limb_leads:
c.setFillColor(col)
c.circle(lx, ly, 5, stroke=0, fill=1)
c.setFillColor(col)
c.setFont('Helvetica-Bold', 7)
c.drawCentredString(lx, ly + 8, name)
# Territory table on right
right_x = w * 0.64
c.setFont('Helvetica-Bold', 8)
c.setFillColor(NAVY)
c.drawString(right_x, h*0.90, "Lead Territories")
territories = [
(TEAL, "Inferior: II, III, aVF"),
(RED, "Anterior: V1 – V4"),
(GREEN, "Lateral: I, aVL, V5, V6"),
(ORANGE, "Septal: V1, V2"),
(NAVY, "aVR: Looks at cavity"),
]
ty = h * 0.78
for col, text in territories:
c.setFillColor(col)
c.circle(right_x + 4, ty + 3, 3.5, stroke=0, fill=1)
c.setFont('Helvetica', 7.5)
c.setFillColor(DARK_GREY)
c.drawString(right_x + 12, ty, text)
ty -= 12
class RateRuler(Flowable):
"""300 large-box rule visual for heart rate."""
def __init__(self, width=150*mm, height=28*mm):
Flowable.__init__(self)
self.width = width
self.height = height
def draw(self):
c = self._canvas
w, h = self.width, self.height
c.setFillColor(LIGHT_BG)
c.rect(0, 0, w, h, stroke=0, fill=1)
c.setFont('Helvetica-Bold', 8)
c.setFillColor(NAVY)
c.drawCentredString(w/2, h - 9, "300 Rule: Heart Rate from R-R Interval")
# 6 boxes
boxes = [
(1, "300"),
(2, "150"),
(3, "100"),
(4, "75"),
(5, "60"),
(6, "50"),
]
total_boxes = 6
bw = w / (total_boxes + 1)
by = h * 0.08
bh = h * 0.48
bg_colors = [RED, ORANGE, colors.HexColor("#F0C419"), GREEN, TEAL, NAVY]
# Draw an R spike at position 0
c.setStrokeColor(ECG_COL)
c.setLineWidth(2)
c.line(bw*0.5, by, bw*0.5, by + bh * 1.8)
for i, (n_boxes, bpm) in enumerate(boxes):
x = bw * (n_boxes + 0.5)
# R spike
c.setStrokeColor(ECG_COL)
c.setLineWidth(2)
c.line(x, by, x, by + bh * 1.8)
# Coloured box
c.setFillColor(bg_colors[i])
c.setStrokeColor(colors.white)
c.setLineWidth(0.5)
bx = bw * n_boxes
c.rect(bx, by, bw, bh, stroke=1, fill=1)
c.setFillColor(colors.white)
c.setFont('Helvetica-Bold', 10)
c.drawCentredString(x, by + bh/2, bpm)
c.setFont('Helvetica', 6.5)
c.drawCentredString(x, by + bh + 4, f"bpm")
c.drawCentredString(x, by - 8, f"{n_boxes} box{'es' if n_boxes>1 else ''}")
# ── Page Templates ─────────────────────────────────────────────────────────────
def chapter_header(story, chapter_num, title, subtitle, S, col=NAVY):
"""Chapter header banner."""
data = [[Paragraph(f'<font color="white"><b>Chapter {chapter_num}</b></font>',
S['ch_title']),
Paragraph(f'<font color="white"><b>{title}</b></font>',
ParagraphStyle('ch_t2', fontSize=18, textColor=colors.white,
fontName='Helvetica-Bold', leading=22,
spaceAfter=0)),
Paragraph(f'<font color="#BDC3C7">{subtitle}</font>',
ParagraphStyle('ch_st', fontSize=10, textColor=colors.HexColor("#BDC3C7"),
fontName='Helvetica', leading=13))]]
# Flatten to single cell with stacked paragraphs
cell_content = [
Paragraph(f'<font color="#BDC3C7">CHAPTER {chapter_num}</font>',
ParagraphStyle('ch_n', fontSize=9, textColor=colors.HexColor("#BDC3C7"),
fontName='Helvetica', spaceAfter=2)),
Paragraph(f'<font color="white">{title}</font>',
ParagraphStyle('ch_big', fontSize=20, textColor=colors.white,
fontName='Helvetica-Bold', spaceAfter=4, leading=24)),
Paragraph(f'<font color="#BDC3C7">{subtitle}</font>',
ParagraphStyle('ch_sm', fontSize=9.5, textColor=colors.HexColor("#BDC3C7"),
fontName='Helvetica', spaceAfter=0, leading=13)),
]
tbl = Table([[cell_content]], colWidths=[170*mm])
tbl.setStyle(TableStyle([
('BACKGROUND', (0,0), (-1,-1), col),
('LEFTPADDING', (0,0), (-1,-1), 14),
('RIGHTPADDING', (0,0), (-1,-1), 14),
('TOPPADDING', (0,0), (-1,-1), 12),
('BOTTOMPADDING', (0,0), (-1,-1), 12),
('ROUNDEDCORNERS', [4, 4, 4, 4]),
]))
story.append(tbl)
story.append(Spacer(1, 10))
# ═══════════════════════════════════════════════════════════════════════════════
# MAIN DOCUMENT BUILDER
# ═══════════════════════════════════════════════════════════════════════════════
def build_pdf(output_path):
S = make_styles()
doc = SimpleDocTemplate(
output_path,
pagesize=A4,
leftMargin=18*mm,
rightMargin=18*mm,
topMargin=16*mm,
bottomMargin=18*mm,
title="Comprehensive ECG Study Guide",
author="Orris Medical Education",
subject="Electrocardiography from Zero",
)
story = []
# ══════════════════════════════════════════════════════════════════
# COVER PAGE
# ══════════════════════════════════════════════════════════════════
def cover_canvas(canvas, doc):
canvas.saveState()
# Dark navy background
canvas.setFillColor(NAVY)
canvas.rect(0, 0, PAGE_W, PAGE_H, stroke=0, fill=1)
# Teal accent stripe
canvas.setFillColor(TEAL)
canvas.rect(0, PAGE_H*0.45, PAGE_W, 6, stroke=0, fill=1)
canvas.rect(0, PAGE_H*0.44, PAGE_W, 2, stroke=0, fill=1)
# ECG decorative line
canvas.setStrokeColor(colors.HexColor("#1ABC9C"))
canvas.setLineWidth(1.2)
canvas.setLineCap(1)
y0 = PAGE_H * 0.52
pts = [
(20,0),(40,0),(42,0),(43,-3),(45,18),(47,-22),(49,6),(51,0),
(70,0),(73,0),(76,8),(79,0),(100,0),(140,0)
]
scale = PAGE_W / 160
path = canvas.beginPath()
path.moveTo(pts[0][0]*scale, y0 + pts[0][1]*scale*0.6)
for px, py in pts[1:]:
path.lineTo(px*scale, y0 + py*scale*0.6)
canvas.drawPath(path, stroke=1, fill=0)
canvas.restoreState()
# Cover content (will be placed over cover background)
story.append(Spacer(1, 55*mm))
story.append(Paragraph("COMPREHENSIVE", ParagraphStyle('ct1',
fontSize=13, textColor=colors.HexColor("#1ABC9C"), fontName='Helvetica-Bold',
spaceAfter=0, alignment=TA_CENTER, leading=16, tracking=3)))
story.append(Paragraph("ECG STUDY GUIDE", ParagraphStyle('ct2',
fontSize=42, textColor=colors.white, fontName='Helvetica-Bold',
spaceAfter=6, alignment=TA_CENTER, leading=46)))
story.append(Paragraph("Electrocardiography from Zero to Clinical Interpretation",
S['cover_sub']))
story.append(Spacer(1, 8*mm))
story.append(HRFlowable(width="60%", thickness=1, color=TEAL, spaceAfter=6*mm))
story.append(Paragraph("Complete beginner's reference · Waveforms · Intervals · Leads · Axis",
S['cover_note']))
story.append(Paragraph("Arrhythmias · STEMI · Bundle Branch Blocks · Systematic Approach",
S['cover_note']))
story.append(Spacer(1, 30*mm))
story.append(Paragraph("Based on Harrison's Principles of Internal Medicine | Guyton & Hall | Miller's Anesthesia",
ParagraphStyle('src', fontSize=8, textColor=colors.HexColor("#7F8C8D"),
fontName='Helvetica', alignment=TA_CENTER, leading=11)))
story.append(PageBreak())
# ══════════════════════════════════════════════════════════════════
# TABLE OF CONTENTS
# ══════════════════════════════════════════════════════════════════
story.append(Spacer(1, 4*mm))
toc_header = Table([[Paragraph("TABLE OF CONTENTS", ParagraphStyle('toch',
fontSize=18, textColor=colors.white, fontName='Helvetica-Bold',
alignment=TA_CENTER, leading=22))]],
colWidths=[170*mm])
toc_header.setStyle(TableStyle([
('BACKGROUND', (0,0), (-1,-1), NAVY),
('TOPPADDING', (0,0), (-1,-1), 10),
('BOTTOMPADDING', (0,0), (-1,-1), 10),
]))
story.append(toc_header)
story.append(Spacer(1, 6*mm))
toc_chapters = [
("1", "Foundations of ECG",
"What ECGs record · Electricity in the heart · Why ECGs matter"),
("2", "The Cardiac Conduction System",
"SA node → AV node → His-Purkinje · Action potentials"),
("3", "ECG Waveforms & Intervals",
"P wave · QRS · T wave · ST segment · Normal values"),
("4", "The ECG Paper & Grid",
"Speed · Voltage · How to measure intervals"),
("5", "The 12 Leads",
"Limb leads · Chest leads · Territories · Camera analogy"),
("6", "Heart Rate & Rhythm",
"300 rule · 1500 rule · Regular vs irregular"),
("7", "Cardiac Axis",
"Normal · LAD · RAD · Quick methods"),
("8", "Systematic 8-Step Approach",
"A reliable framework for every ECG"),
("9", "Common Arrhythmias",
"Sinus rhythms · AF · SVT · Heart blocks · VT · VF"),
("10", "ST Changes & Ischemia",
"STEMI · NSTEMI · Territories · Reciprocal changes"),
("11", "Bundle Branch Blocks",
"LBBB · RBBB · Hemiblocks · William Marrow mnemonic"),
("12", "Electrolyte & Drug Effects",
"Hyperkalaemia · Hypokalaemia · QT prolongation"),
("13", "Quick Reference & Cheat Sheet",
"Normal values · 8 steps · Red flags · Mnemonics"),
]
for num, title, sub in toc_chapters:
row_data = [
[Paragraph(f'<b>{num}</b>', ParagraphStyle('tn',
fontSize=11, textColor=colors.white, fontName='Helvetica-Bold',
alignment=TA_CENTER, leading=14)),
Paragraph(f'<b>{title}</b><br/><font size="8" color="#7F8C8D">{sub}</font>',
S['toc_entry'])]
]
row_t = Table(row_data, colWidths=[12*mm, 155*mm])
bg = TEAL if int(num) % 2 == 0 else NAVY
row_t.setStyle(TableStyle([
('BACKGROUND', (0,0), (0,0), bg),
('BACKGROUND', (1,0), (1,0), colors.white),
('TOPPADDING', (0,0), (-1,-1), 5),
('BOTTOMPADDING', (0,0), (-1,-1), 5),
('LEFTPADDING', (0,0), (-1,-1), 8),
('LINEBELOW', (0,0), (-1,-1), 0.3, colors.HexColor("#DEE2E6")),
('VALIGN', (0,0), (-1,-1), 'MIDDLE'),
]))
story.append(row_t)
story.append(PageBreak())
# ══════════════════════════════════════════════════════════════════
# CHAPTER 1: FOUNDATIONS
# ══════════════════════════════════════════════════════════════════
chapter_header(story, 1, "Foundations of ECG",
"What it records, why it matters, and how it works", S)
story.append(Paragraph("What is an ECG?", S['section']))
story.append(Paragraph(
"An electrocardiogram (ECG or EKG) is a graphic recording of the electrical "
"activity generated by the heart. When heart muscle cells depolarise (activate) "
"and repolarise (reset), they create tiny electrical currents that travel through "
"body tissues to the skin surface. Metal electrodes stuck to the skin detect these "
"potentials, and the ECG machine amplifies and plots them against time.", S['body']))
info_box(story,
"<b>Key concept:</b> The ECG records <i>electrical</i> activity, not mechanical "
"contraction directly. But because electricity triggers contraction, the ECG is an "
"indirect window into pump function, rhythm, and structural disease.", S)
story.append(Paragraph("Why is the ECG clinically useful?", S['section']))
uses_data = [
["Clinical Use", "What the ECG Shows"],
["Heart rate & rhythm", "Normal sinus rhythm, tachycardia, bradycardia, AF, blocks"],
["Myocardial ischaemia / infarction", "ST elevation/depression, Q waves, T changes"],
["Conduction system disease", "Bundle branch blocks, AV blocks"],
["Electrolyte abnormalities", "Peaked T waves (↑K+), U waves (↓K+), QT changes"],
["Drug toxicity monitoring", "QT prolongation, Digoxin effect"],
["Cardiac hypertrophy", "Voltage criteria for LVH / RVH"],
["Pulmonary embolism", "S1Q3T3, sinus tachycardia, right heart strain"],
]
story.append(colored_table(uses_data, [65*mm, 105*mm]))
story.append(Spacer(1, 6))
story.append(PageBreak())
# ══════════════════════════════════════════════════════════════════
# CHAPTER 2: CONDUCTION SYSTEM
# ══════════════════════════════════════════════════════════════════
chapter_header(story, 2, "Cardiac Conduction System",
"The electrical pathway that drives every heartbeat", S, col=TEAL)
story.append(HeartAnatomyDiagram(width=160*mm, height=82*mm))
story.append(Spacer(1, 4))
story.append(Paragraph("Caption: Schematic of the cardiac conduction system correlated with ECG waveforms.", S['caption']))
story.append(Paragraph("Step-by-Step Signal Propagation", S['section']))
steps = [
("1. SA Node fires",
"Located in the right atrium. Spontaneously depolarises 60–100 times/min. "
"This is the normal pacemaker. The P wave begins."),
("2. Atrial conduction",
"The impulse spreads across both atria via specialised conduction pathways, "
"causing atrial contraction. The P wave is completed."),
("3. AV Node delay",
"At the AV junction, conduction slows deliberately (about 80–120 ms). "
"This gives the ventricles time to finish filling with blood. "
"This delay is seen as the PR interval on the ECG."),
("4. Bundle of His",
"A fast conduction highway through the fibrous skeleton of the heart. "
"Connects the AV node to the ventricular conduction system."),
("5. Bundle Branches",
"The His bundle splits into the Right Bundle Branch (RBB) and Left Bundle "
"Branch (LBB). The LBB further divides into anterior and posterior fascicles."),
("6. Purkinje Fibers",
"The finest branches of the conduction system. They deliver the impulse "
"directly to ventricular muscle cells (myocytes), triggering synchronous "
"ventricular contraction — the QRS complex."),
("7. Repolarisation",
"After contraction, ventricular cells reset their electrical potential. "
"This produces the T wave."),
]
for step, desc in steps:
story.append(Paragraph(f'<b>• {step}:</b> {desc}', S['bullet']))
story.append(Spacer(1, 4))
key_box(story,
"<b>Backup Pacemakers:</b> If the SA node fails, the AV node can pace at "
"40–60 bpm, and the ventricles themselves at 20–40 bpm. These 'escape rhythms' "
"are slower and produce abnormal-looking QRS complexes.", S)
story.append(PageBreak())
# ══════════════════════════════════════════════════════════════════
# CHAPTER 3: WAVEFORMS & INTERVALS
# ══════════════════════════════════════════════════════════════════
chapter_header(story, 3, "ECG Waveforms & Intervals",
"Every deflection explained — P, QRS, ST, T, U", S, col=colors.HexColor("#8E44AD"))
story.append(Paragraph("The Normal ECG Waveform", S['section']))
story.append(ECGWaveformDrawing(width=165*mm, height=58*mm))
story.append(Paragraph(
"A single cardiac cycle on ECG paper. The calibration pulse (left) = 1 mV. "
"Intervals shown below the trace. Speed = 25 mm/s.", S['caption']))
story.append(Spacer(1, 5))
story.append(Paragraph("Wave-by-Wave Reference", S['section']))
waves_data = [
["Wave / Feature", "Electrical Event", "Normal Appearance", "Normal Duration"],
["P wave", "Atrial depolarisation",
"Small, rounded, upright (in II)", "< 120 ms, < 2.5 mm tall"],
["PR interval", "AV node conduction delay",
"Flat isoelectric line", "120–200 ms (3–5 small boxes)"],
["Q wave", "Septal depolarisation\n(initial)",
"Small, narrow dip", "< 40 ms wide, < 25% R height"],
["R wave", "Main ventricular depolarisation",
"Tall upward spike", "Tallest wave in most leads"],
["S wave", "Terminal ventricular depol.",
"Downward deflection after R", "Variable"],
["QRS complex", "Ventricular depolarisation",
"Sharp, tall complex", "< 100–110 ms"],
["ST segment", "Plateau of action potential\n(isopotential phase)",
"Flat at baseline (isoelectric)", "Isoelectric ± 0.5 mm"],
["T wave", "Ventricular repolarisation",
"Rounded, asymmetric, upright", "Variable; same direction as QRS"],
["QT interval", "Total ventricular electrical\nactivity",
"QRS start → T end", "< 450 ms (♂), < 460 ms (♀)"],
["U wave", "Late repolarisation (M-cells)",
"Small bump after T (optional)", "Same direction as T"],
]
story.append(colored_table(waves_data,
[33*mm, 38*mm, 50*mm, 46*mm], font_size=8.5))
story.append(Spacer(1, 5))
warning_box(story,
"<b>Pathological Q waves</b> = width > 1 small box (40 ms) <b>OR</b> amplitude "
"> 25% of the R wave. Indicates prior myocardial infarction (dead tissue "
"cannot depolarise, creating a 'window' to negative cavity).", S)
story.append(PageBreak())
# ══════════════════════════════════════════════════════════════════
# CHAPTER 4: ECG PAPER & GRID
# ══════════════════════════════════════════════════════════════════
chapter_header(story, 4, "ECG Paper & Measurement",
"Understanding the grid, speed, and voltage calibration", S, col=GREEN)
story.append(Paragraph("The ECG Grid", S['section']))
story.append(ECGPaperScaleDrawing(width=140*mm, height=44*mm))
story.append(Paragraph(
"Standard ECG paper: 25 mm/s speed, 1 mV = 10 mm (10 small boxes) calibration.", S['caption']))
story.append(Spacer(1, 4))
grid_data = [
["Grid Unit", "Physical Size", "Time", "Voltage"],
["1 small box", "1 mm × 1 mm", "40 ms (0.04 s)", "0.1 mV"],
["1 large box", "5 mm × 5 mm", "200 ms (0.20 s)", "0.5 mV"],
["5 large boxes", "25 mm × 25 mm", "1 second", "2.5 mV"],
["Standard strip", "250 mm long", "10 seconds", "—"],
]
story.append(colored_table(grid_data, [36*mm, 36*mm, 50*mm, 45*mm]))
story.append(Spacer(1, 5))
story.append(Paragraph("Heart Rate Calculation", S['section']))
story.append(RateRuler(width=160*mm, height=30*mm))
story.append(Paragraph(
"Count large boxes between two R peaks and divide 300. "
"For irregular rhythms: count QRS complexes in 10-second strip × 6.", S['caption']))
story.append(Spacer(1, 4))
rate_data = [
["Large Boxes (R to R)", "1", "2", "3", "4", "5", "6"],
["Heart Rate (bpm)", "300","150","100","75","60","50"],
]
rate_t = Table(rate_data, colWidths=[42*mm]+[21*mm]*6)
rate_t.setStyle(TableStyle([
('BACKGROUND', (0,0), (-1,0), NAVY),
('TEXTCOLOR', (0,0), (-1,0), colors.white),
('FONTNAME', (0,0), (-1,-1), 'Helvetica-Bold'),
('FONTSIZE', (0,0), (-1,-1), 9),
('ALIGN', (0,0), (-1,-1), 'CENTER'),
('BACKGROUND', (1,1), (1,1), RED),
('BACKGROUND', (2,1), (2,1), ORANGE),
('BACKGROUND', (3,1), (3,1), colors.HexColor("#F0C419")),
('BACKGROUND', (4,1), (4,1), GREEN),
('BACKGROUND', (5,1), (5,1), TEAL),
('BACKGROUND', (6,1), (6,1), NAVY),
('TEXTCOLOR', (1,1), (-1,1), colors.white),
('TOPPADDING', (0,0), (-1,-1), 6),
('BOTTOMPADDING', (0,0), (-1,-1), 6),
('GRID', (0,0), (-1,-1), 0.5, colors.white),
]))
story.append(rate_t)
story.append(PageBreak())
# ══════════════════════════════════════════════════════════════════
# CHAPTER 5: 12 LEADS
# ══════════════════════════════════════════════════════════════════
chapter_header(story, 5, "The 12 Leads",
"12 different views of the same electrical event", S, col=colors.HexColor("#1A5276"))
story.append(Paragraph(
"A standard ECG uses 10 electrodes (4 limb + 6 chest) but generates "
"<b>12 different views (leads)</b> by comparing electrode pairs from different angles. "
"Think of each lead as a camera looking at the heart from a specific direction.", S['body']))
story.append(LeadsDiagram(width=160*mm, height=78*mm))
story.append(Paragraph(
"Lead placement: RA = Right Arm, LA = Left Arm, RL = Right Leg (ground), LL = Left Leg. "
"Chest leads V1–V6 span from sternum to axilla.", S['caption']))
story.append(Spacer(1, 4))
story.append(Paragraph("Lead Groups Summary", S['section']))
leads_data = [
["Lead Group", "Leads", "Heart Territory", "Main Artery"],
["Inferior", "II, III, aVF", "Inferior wall of LV + RV", "Right Coronary Artery (RCA)"],
["Anterior", "V1, V2, V3, V4", "Anterior LV wall + septum", "Left Anterior Descending (LAD)"],
["Lateral", "I, aVL, V5, V6", "Lateral LV wall", "Left Circumflex (LCx)"],
["Septal", "V1, V2", "Interventricular septum", "LAD (septal perforators)"],
["aVR", "aVR", "Cavity of heart (looks in)", "Global ischaemia if ST elevation"],
]
story.append(colored_table(leads_data, [22*mm, 28*mm, 62*mm, 58*mm], header_bg=colors.HexColor("#1A5276")))
story.append(Spacer(1, 4))
key_box(story,
"<b>Contiguous leads:</b> Two or more leads in the same anatomical territory. "
"ST changes are only significant when present in ≥2 contiguous leads. "
"This prevents single-lead artefact from being misread as disease.", S)
story.append(PageBreak())
# ══════════════════════════════════════════════════════════════════
# CHAPTER 6 & 7: RATE, RHYTHM & AXIS
# ══════════════════════════════════════════════════════════════════
chapter_header(story, 6, "Rate, Rhythm & Cardiac Axis",
"Normal sinus rhythm, tachycardia/bradycardia, axis deviation", S, col=ORANGE)
story.append(Paragraph("Normal Sinus Rhythm — Criteria (ALL must be present)", S['section']))
nsr = [
"P wave present before <b>every</b> QRS complex",
"QRS complex after <b>every</b> P wave",
"P wave upright in Lead II, inverted in aVR (confirms SA node origin)",
"PR interval 120–200 ms (constant)",
"QRS duration < 110 ms (narrow = normal conduction)",
"Rate 60–100 bpm",
"Regular rhythm (all R-R intervals equal ± 10%)",
]
for item in nsr:
story.append(Paragraph(f'<b>✓</b> {item}', S['bullet']))
story.append(Spacer(1, 4))
story.append(Paragraph("Rate Classification", S['section']))
rate_class = [
["Classification", "Rate", "Causes"],
["Sinus bradycardia", "< 60 bpm", "Athletes, vagal, sick sinus, hypothyroidism, drugs (β-blockers)"],
["Normal sinus rhythm", "60–100 bpm", "Normal"],
["Sinus tachycardia", "> 100 bpm", "Pain, fever, anaemia, hypovolaemia, anxiety, PE, hyperthyroidism"],
["Supraventricular tachy.", "> 150 bpm", "Narrow QRS; SVT, AF with fast response"],
["Ventricular tachycardia", "> 100 bpm", "Wide QRS; life-threatening; treat urgently"],
]
story.append(colored_table(rate_class, [42*mm, 28*mm, 100*mm], header_bg=ORANGE))
story.append(Spacer(1, 6))
story.append(Paragraph("Cardiac Axis", S['section']))
story.append(Paragraph(
"The <b>cardiac axis</b> is the average direction of ventricular depolarisation. "
"Normal = -30° to +90°. Quick determination using Lead I and aVF:", S['body']))
axis_data = [
["Lead I", "Lead aVF", "Axis", "Mnemonic"],
["↑ Positive", "↑ Positive", "NORMAL (0° to +90°)", "Both up = normal"],
["↑ Positive", "↓ Negative", "LEFT axis deviation (LAD)", "Like a falling tree left"],
["↓ Negative", "↑ Positive", "RIGHT axis deviation (RAD)", "Pushed right"],
["↓ Negative", "↓ Negative", "EXTREME / NW axis", "Northwest = bizarre"],
]
story.append(colored_table(axis_data, [24*mm, 24*mm, 58*mm, 64*mm], header_bg=ORANGE))
story.append(Spacer(1, 4))
story.append(Paragraph("<b>Causes of LAD:</b> LBBB, left anterior fascicular block, inferior MI, LVH, WPW", S['bullet']))
story.append(Paragraph("<b>Causes of RAD:</b> RVH, RBBB, lateral MI, PE, dextrocardia, normal in children/tall thin adults", S['bullet']))
story.append(PageBreak())
# ══════════════════════════════════════════════════════════════════
# CHAPTER 8: 8-STEP SYSTEMATIC APPROACH
# ══════════════════════════════════════════════════════════════════
chapter_header(story, 8, "The Systematic 8-Step Approach",
"Apply this order to every ECG you read — every time", S, col=colors.HexColor("#145A32"))
steps_8 = [
("1", "RATE", GREEN,
"Calculate heart rate (300 / large boxes, or complexes × 6).\n"
"Classify: bradycardia (<60), normal (60–100), tachycardia (>100)."),
("2", "RHYTHM", TEAL,
"Is the rhythm regular (constant R-R) or irregular?\n"
"Is there a P before every QRS and a QRS after every P?"),
("3", "AXIS", colors.HexColor("#1A5276"),
"Check Lead I and aVF.\n"
"Both positive = normal. See axis table above."),
("4", "P WAVES", ORANGE,
"Present? Upright in II? Inverted in aVR?\n"
"Abnormal shape: peaked (P pulmonale) or bifid (P mitrale)?"),
("5", "PR INTERVAL", colors.HexColor("#6C3483"),
"Measure PR. Normal = 120–200 ms.\n"
"Long = AV block. Short = pre-excitation (WPW)."),
("6", "QRS COMPLEX", RED,
"Duration < 110 ms (narrow = normal). Wide = BBB or ventricular.\n"
"Check voltage, morphology (Q waves, R wave progression V1→V6)."),
("7", "ST SEGMENT & T WAVES", colors.HexColor("#922B21"),
"ST elevation → STEMI (emergency).\n"
"ST depression → ischaemia/NSTEMI.\n"
"T wave: inverted, peaked, flattened?"),
("8", "QT INTERVAL", colors.HexColor("#7B241C"),
"Measure QT. Correct for rate (QTc).\n"
"Prolonged (>450 ms M / >460 ms F) = risk of Torsades de Pointes."),
]
for num, name, col, desc in steps_8:
desc_lines = desc.strip().split('\n')
desc_paras = [Paragraph(line.strip(), S['callout']) for line in desc_lines if line.strip()]
num_para = Paragraph(f'<font color="white"><b>{num}</b></font>',
ParagraphStyle('sn', fontSize=16, textColor=colors.white,
fontName='Helvetica-Bold', alignment=TA_CENTER, leading=20))
name_para = Paragraph(f'<font color="white"><b>{name}</b></font>',
ParagraphStyle('snm', fontSize=11, textColor=colors.white,
fontName='Helvetica-Bold', leading=14))
row_t = Table([[num_para, [name_para] + desc_paras]],
colWidths=[14*mm, 155*mm])
row_t.setStyle(TableStyle([
('BACKGROUND', (0,0), (0,0), col),
('BACKGROUND', (1,0), (1,0), colors.white),
('LINEAFTER', (0,0), (0,0), 3, col),
('TOPPADDING', (0,0), (-1,-1), 5),
('BOTTOMPADDING', (0,0), (-1,-1), 5),
('LEFTPADDING', (0,0), (-1,-1), 8),
('VALIGN', (0,0), (-1,-1), 'MIDDLE'),
('LINEBELOW', (0,0), (-1,-1), 0.5, colors.HexColor("#DEE2E6")),
]))
story.append(row_t)
story.append(Spacer(1, 2))
story.append(PageBreak())
# ══════════════════════════════════════════════════════════════════
# CHAPTER 9: ARRHYTHMIAS
# ══════════════════════════════════════════════════════════════════
chapter_header(story, 9, "Common Arrhythmias",
"Patterns you must recognise — from benign to life-threatening", S, col=RED)
arrhythmias = [
("Atrial Fibrillation (AF)", RED, [
"<b>Rate:</b> Ventricular rate typically 100–160 bpm (uncontrolled); variable",
"<b>Rhythm:</b> Irregularly irregular — completely unpredictable R-R intervals",
"<b>P waves:</b> Absent — replaced by chaotic fibrillatory baseline (f-waves)",
"<b>QRS:</b> Usually narrow (unless aberrant conduction or BBB)",
"<b>Causes:</b> Hypertension, valvular disease, thyrotoxicosis, alcohol, post-surgery",
"<b>Risk:</b> Stroke from atrial thrombus — anticoagulation often required",
]),
("Atrial Flutter", ORANGE, [
"<b>Rate:</b> Atrial rate ~300 bpm, ventricular rate usually 150 bpm (2:1 block)",
"<b>Rhythm:</b> Regular or regularly irregular",
"<b>P waves:</b> Classic 'sawtooth' flutter waves (F-waves) best seen in II, III, aVF",
"<b>QRS:</b> Narrow, every 2nd (or 3rd/4th) flutter wave conducts",
"<b>Causes:</b> Similar to AF; reentrant circuit in right atrium",
]),
("First-Degree AV Block", colors.HexColor("#1A5276"), [
"<b>PR interval:</b> > 200 ms (> 5 small boxes) — constant",
"<b>Every P conducts:</b> Yes — P followed by QRS every time",
"<b>Clinical significance:</b> Usually benign; monitor",
"<b>Causes:</b> Athletic training, digoxin, increased vagal tone, inferior MI",
]),
("Second-Degree AV Block — Mobitz I (Wenckebach)", TEAL, [
"<b>PR interval:</b> Progressively lengthens until a QRS is dropped",
"<b>Pattern:</b> Cycles — e.g. 3 conducted beats then 1 dropped QRS",
"<b>Clinical:</b> Often benign; inferior MI location; rarely progresses",
"<b>Memory:</b> 'Longer, longer, longer, DROP — then we have a Wenckebach'",
]),
("Second-Degree AV Block — Mobitz II", RED, [
"<b>PR interval:</b> Constant (normal or prolonged), then sudden dropped QRS",
"<b>Warning:</b> Can progress to complete heart block — needs pacing",
"<b>Causes:</b> Anterior MI, degenerative disease, myocarditis",
]),
("Third-Degree (Complete) AV Block", colors.HexColor("#922B21"), [
"<b>P waves and QRS complexes:</b> Completely independent — no relationship",
"<b>Pattern:</b> P waves march through at SA rate (60–100); QRS escape at 20–40 bpm",
"<b>QRS:</b> Wide (ventricular escape) or narrow (junctional escape)",
"<b>Clinical:</b> EMERGENCY — syncope, haemodynamic compromise, requires pacing",
]),
("Ventricular Tachycardia (VT)", colors.HexColor("#7B241C"), [
"<b>Rate:</b> > 100 bpm (usually 120–200)",
"<b>QRS:</b> Wide (> 120 ms), bizarre morphology, all complexes same shape (monomorphic)",
"<b>P waves:</b> Independent (AV dissociation), may be hidden in QRS",
"<b>Key features:</b> Fusion beats, capture beats support VT diagnosis",
"<b>Clinical:</b> Haemodynamically unstable → DC cardioversion. Stable → amiodarone",
]),
("Ventricular Fibrillation (VF)", colors.HexColor("#4A235A"), [
"<b>Appearance:</b> Chaotic, irregular baseline — no recognisable waves",
"<b>Rate:</b> Unmeasurable",
"<b>Clinical:</b> CARDIAC ARREST — no cardiac output",
"<b>Treatment:</b> Immediate CPR + defibrillation (non-shockable rhythms: PEA, asystole)",
]),
]
for title_a, col_a, points in arrhythmias:
title_p = Paragraph(f'<font color="white"><b>{title_a}</b></font>',
ParagraphStyle('at', fontSize=10, textColor=colors.white,
fontName='Helvetica-Bold', leading=14))
content = [Paragraph(pt, S['bullet']) for pt in points]
t = Table([[title_p], [content]], colWidths=[167*mm])
t.setStyle(TableStyle([
('BACKGROUND', (0,0), (-1,0), col_a),
('BACKGROUND', (0,1), (-1,1), colors.white),
('TOPPADDING', (0,0), (-1,-1), 5),
('BOTTOMPADDING', (0,0), (-1,-1), 5),
('LEFTPADDING', (0,0), (-1,-1), 8),
('LINEBELOW', (0,-1), (-1,-1), 0.5, col_a),
]))
story.append(t)
story.append(Spacer(1, 4))
story.append(PageBreak())
# ══════════════════════════════════════════════════════════════════
# CHAPTER 10: ST CHANGES & ISCHAEMIA
# ══════════════════════════════════════════════════════════════════
chapter_header(story, 10, "ST Changes & Myocardial Ischaemia",
"STEMI · NSTEMI · Unstable Angina · Pericarditis", S, col=colors.HexColor("#922B21"))
story.append(Paragraph("ST Elevation — STEMI", S['section']))
story.append(Paragraph(
"ST-elevation myocardial infarction (STEMI) is a medical emergency. "
"Complete coronary artery occlusion causes full-thickness (transmural) ischaemia. "
"Time is muscle — reperfusion within 90 minutes (primary PCI) is the goal.", S['body']))
stemi_criteria = [
["Lead Group", "Leads", "Culprit Artery", "ST Elevation Threshold"],
["Anterior", "V2–V3", "LAD", "≥ 2.5 mm (M <40), ≥ 2 mm (M ≥40), ≥ 1.5 mm (F)"],
["Anterior/other", "V1, V4", "LAD", "≥ 1 mm"],
["Inferior", "II, III, aVF", "RCA (or LCx)", "≥ 1 mm"],
["Lateral", "I, aVL, V5–V6", "LCx", "≥ 1 mm"],
["Posterior", "V7–V9", "RCA/LCx", "≥ 0.5 mm (posterior leads)"],
["Right ventricle", "V3R–V4R", "RCA (proximal)", "≥ 1 mm"],
]
story.append(colored_table(stemi_criteria, [24*mm, 24*mm, 36*mm, 84*mm], header_bg=RED))
story.append(Spacer(1, 5))
warning_box(story,
"<b>Reciprocal changes:</b> In STEMI, expect ST <i>depression</i> in leads "
"opposite the infarct territory. E.g., inferior STEMI (II/III/aVF elevation) → "
"reciprocal depression in I and aVL. Presence of reciprocal changes strongly supports true STEMI.", S)
story.append(Spacer(1, 5))
story.append(Paragraph("Evolution of ECG Changes in STEMI", S['section']))
evolv = [
["Time", "ECG Finding", "Pathology"],
["Minutes (hyperacute)", "Tall, peaked T waves ('hyperacute T')", "Hyperkalaemia of ischaemic cells"],
["Hours (acute)", "ST elevation — upward 'tombstoning'", "Transmural injury current"],
["Hours–days", "Pathological Q waves develop", "Necrotic myocardium cannot depolarise"],
["Days–weeks", "ST returns to baseline; T wave inverts", "Healing/scar phase"],
["Weeks–months", "Q waves persist; T may normalise", "Permanent scar"],
]
story.append(colored_table(evolv, [34*mm, 68*mm, 66*mm], header_bg=colors.HexColor("#922B21")))
story.append(Spacer(1, 5))
story.append(Paragraph("ST Depression & T Wave Changes", S['section']))
st_dep = [
["ECG Finding", "Common Causes"],
["Horizontal ST depression", "Subendocardial ischaemia / NSTEMI"],
["Downsloping ST depression", "Digoxin effect; severe ischaemia"],
["Upsloping ST depression", "Less specific; tachycardia"],
["Saddle-shaped ST elevation", "Pericarditis (global, concave up)"],
["T wave inversion (symmetric)", "Ischaemia, LVH, BBB, PE, raised ICP"],
["T wave inversion (Wellens)", "Critical LAD stenosis — do NOT exercise test!"],
["Peaked T waves", "Hyperkalaemia (most important), hyperacute MI"],
["Flat / inverted T waves", "Hypokalaemia, ischaemia, digoxin"],
]
story.append(colored_table(st_dep, [80*mm, 88*mm], header_bg=colors.HexColor("#7B241C")))
story.append(PageBreak())
# ══════════════════════════════════════════════════════════════════
# CHAPTER 11: BUNDLE BRANCH BLOCKS
# ══════════════════════════════════════════════════════════════════
chapter_header(story, 11, "Bundle Branch Blocks",
"LBBB · RBBB · Hemiblocks — recognition and significance", S, col=TEAL)
story.append(Paragraph(
"A bundle branch block occurs when conduction down one bundle branch is slowed "
"or blocked. The affected ventricle depolarises late via slow cell-to-cell spread, "
"producing a <b>wide QRS > 120 ms</b>.", S['body']))
story.append(Spacer(1, 4))
bbb_data = [
["Feature", "RBBB", "LBBB"],
["QRS duration", "> 120 ms", "> 120 ms"],
["V1 morphology", "RSR' pattern (rabbit ears / M shape)",
"Broad monophasic S wave (W shape)"],
["V6 morphology", "Wide S wave (slurred)", "Broad monophasic R (M shape)"],
["Mnemonic", "WiLLiaM MaRRoW", "WiLLiaM MaRRoW"],
["Mnemonic explained", "MaRRoW → M in V1, W in V6", "WiLLiaM → W in V1, M in V6"],
["ST & T direction", "Discordant (opposite QRS)", "Discordant (opposite QRS)"],
["Clinical significance", "Often benign; RV strain, PE, CHD",
"ALWAYS pathological — new LBBB = possible MI"],
["Effect on STEMI Dx", "Can diagnose STEMI with Sgarbossa criteria",
"Obscures STEMI — use Sgarbossa criteria"],
]
story.append(colored_table(bbb_data, [38*mm, 65*mm, 65*mm], header_bg=TEAL))
story.append(Spacer(1, 5))
key_box(story,
"<b>WiLLiaM MaRRoW mnemonic:</b><br/>"
"• <b>W</b>iLL<b>i</b>a<b>M</b> → LBBB: <b>W</b> in V1, <b>M</b> in V6<br/>"
"• Ma<b>RR</b>o<b>W</b> → RBBB: <b>M</b> in V1, <b>W</b> in V6", S)
story.append(Spacer(1, 4))
story.append(Paragraph("Sgarbossa Criteria (STEMI in BBB)", S['section']))
story.append(Paragraph(
"In LBBB or ventricular paced rhythms, use Sgarbossa criteria to identify STEMI:", S['body']))
sgarbossa = [
"<b>Criterion 1 (5 points):</b> ST elevation ≥ 1 mm <i>concordant</i> with QRS (same direction) — most specific",
"<b>Criterion 2 (3 points):</b> ST depression ≥ 1 mm concordant in V1–V3 — moderate specificity",
"<b>Criterion 3 (2 points):</b> ST elevation ≥ 5 mm <i>discordant</i> with QRS — least specific",
]
for s_item in sgarbossa:
story.append(Paragraph(f'• {s_item}', S['bullet']))
story.append(Paragraph("Score ≥ 3 points = STEMI likely. Modified Sgarbossa uses proportional ST/S ratio ≥ 0.25.", S['body']))
story.append(PageBreak())
# ══════════════════════════════════════════════════════════════════
# CHAPTER 12: ELECTROLYTES & DRUGS
# ══════════════════════════════════════════════════════════════════
chapter_header(story, 12, "Electrolyte & Drug Effects",
"Potassium · Calcium · QT prolongation · Digoxin", S, col=colors.HexColor("#6C3483"))
story.append(Paragraph("Potassium and the ECG", S['section']))
k_data = [
["Potassium Level", "ECG Changes", "Why?"],
["Severe hypokalaemia (<2.5)", "Flat/inverted T waves, U waves > T waves, "
"ST depression, QT prolongation, widening QRS",
"Prolonged repolarisation"],
["Mild hypokalaemia (2.5–3.5)", "Flat T waves, prominent U waves in V2–V3",
"Reduced repolarisation reserve"],
["Normal (3.5–5.0)", "Normal T waves", "—"],
["Mild hyperkalaemia (5.5–6.5)", "Tall, narrow, peaked T waves (tent-shaped) — "
"best seen V2–V4",
"Shortened repolarisation"],
["Moderate hyperkalaemia (6.5–8.0)", "Peaked T + prolonged PR + widened QRS + "
"loss of P wave",
"Slowed conduction"],
["Severe hyperkalaemia (>8.0)", "'Sine wave' pattern → VF/cardiac arrest",
"Generalised membrane depolarisation"],
]
story.append(colored_table(k_data, [42*mm, 74*mm, 52*mm],
header_bg=colors.HexColor("#6C3483"), font_size=8.5))
story.append(Spacer(1, 5))
warning_box(story,
"<b>Remember:</b> Hyperkalaemia with wide QRS and sine wave is a <i>pre-arrest</i> pattern. "
"Give IV calcium gluconate immediately to stabilise the cardiac membrane, "
"then insulin + glucose, salbutamol nebulisers to shift K+ into cells.", S)
story.append(Spacer(1, 4))
story.append(Paragraph("QT Prolongation — Causes & Consequences", S['section']))
qt_data = [
["Category", "Examples"],
["Antiarrhythmics", "Amiodarone, sotalol, quinidine, procainamide"],
["Antibiotics", "Azithromycin, clarithromycin, moxifloxacin, erythromycin"],
["Antipsychotics", "Haloperidol, quetiapine, olanzapine, risperidone"],
["Antidepressants", "TCAs, citalopram, escitalopram"],
["Antiemetics", "Ondansetron, domperidone, metoclopramide"],
["Electrolyte disorders", "↓K+, ↓Mg2+, ↓Ca2+ — all prolong QT"],
["Congenital", "Long QT syndrome types 1–7 (Romano-Ward, Jervell-Lange-Nielsen)"],
]
story.append(colored_table(qt_data, [50*mm, 118*mm],
header_bg=colors.HexColor("#6C3483")))
story.append(Spacer(1, 4))
story.append(Paragraph("Digoxin Effect vs Toxicity", S['section']))
dig_data = [
["", "Digoxin Effect (therapeutic)", "Digoxin Toxicity"],
["ST segment", "Scooped/sagging ('reverse tick')", "Normal or worsened"],
["T wave", "Inverted / biphasic", "Variable"],
["PR interval", "Prolonged (1st degree block)", "Prolonged further"],
["Rate", "Bradycardia (desired)", "Brady + arrhythmias"],
["Classic toxic arrhythmia", "—",
"PAT with block (bidirectional VT in severe toxicity)"],
]
story.append(colored_table(dig_data, [40*mm, 66*mm, 62*mm],
header_bg=colors.HexColor("#6C3483")))
story.append(PageBreak())
# ══════════════════════════════════════════════════════════════════
# CHAPTER 13: QUICK REFERENCE CHEAT SHEET
# ══════════════════════════════════════════════════════════════════
chapter_header(story, 13, "Quick Reference & Cheat Sheet",
"Print this page — tape it to your wall", S, col=DARK_GREY)
# Normal values box
nv_data = [
[Paragraph("<b>NORMAL VALUES</b>", ParagraphStyle('nvt', fontSize=10, textColor=NAVY,
fontName='Helvetica-Bold', leading=13)),
Paragraph("Rate: 60–100 bpm | PR: 120–200 ms | QRS: <110 ms | "
"QTc: <450 ms (M), <460 ms (F)", S['body_b'])]
]
nv_t = Table(nv_data, colWidths=[38*mm, 130*mm])
nv_t.setStyle(TableStyle([
('BACKGROUND', (0,0), (-1,-1), LIGHT_TEAL),
('TOPPADDING', (0,0), (-1,-1), 8), ('BOTTOMPADDING', (0,0), (-1,-1), 8),
('LEFTPADDING', (0,0), (-1,-1), 8), ('GRID', (0,0), (-1,-1), 0.5, TEAL),
]))
story.append(nv_t)
story.append(Spacer(1, 6))
# 8 steps compact
steps_compact = [
["Step", "Check", "Key Normal / Action"],
["1 Rate", "300 ÷ R-R large boxes", "60–100 bpm = normal"],
["2 Rhythm", "Regular? P before QRS?", "Sinus = P upright in II, inverted aVR"],
["3 Axis", "Lead I & aVF both up?", "Both + = normal; +/- = LAD; -/+ = RAD"],
["4 P waves", "Present? Normal shape?", "Upright II, <120 ms, <2.5 mm"],
["5 PR interval", "Measure P to QRS start", "120–200 ms; >200 = AV block"],
["6 QRS complex", "Width? Morphology?", "<110 ms narrow; BBB if wide"],
["7 ST & T waves", "Elevation? Depression?", "Flat baseline; ≥1 mm elev = STEMI if 2+ leads"],
["8 QT interval", "QRS start to T wave end", "<450 ms (M) / <460 ms (F)"],
]
story.append(Paragraph("8-Step Rapid Reference", S['section']))
story.append(colored_table(steps_compact, [28*mm, 52*mm, 88*mm]))
story.append(Spacer(1, 6))
# Red flags
story.append(Paragraph("🚨 RED FLAGS — Act Immediately", S['red_bold']))
red_data = [
["ECG Finding", "Diagnosis", "Action"],
["ST elevation ≥1 mm in ≥2 contiguous leads", "STEMI", "Activate cath lab / call senior"],
["Wide QRS >120 ms + rate >100 bpm", "Ventricular Tachycardia", "Senior review / cardioversion"],
["Chaotic baseline, no waves", "Ventricular Fibrillation", "CPR + Defibrillate NOW"],
["P and QRS independent, slow rate", "Complete Heart Block", "Senior + pacing"],
["QTc >500 ms", "High risk Torsades", "Stop QT-prolonging drugs, correct electrolytes"],
["Sine wave pattern (wide, no P waves)", "Severe Hyperkalaemia", "IV Calcium urgently"],
["New LBBB + chest pain", "Possible STEMI", "Treat as STEMI"],
]
story.append(colored_table(red_data, [60*mm, 42*mm, 66*mm], header_bg=RED))
story.append(Spacer(1, 6))
# Mnemonics
story.append(Paragraph("Key Mnemonics", S['section']))
mnem_data = [
["Mnemonic", "What it's for", "Details"],
["WiLLiaM MaRRoW", "BBB V1/V6 morphology",
"LBBB: W in V1, M in V6 | RBBB: M in V1, W in V6"],
["300 – 150 – 100 – 75 – 60 – 50", "Heart rate from large boxes",
"1–2–3–4–5–6 large boxes"],
["'Sawtooth'", "Atrial flutter", "Regular flutter waves ~300 bpm in II/III/aVF"],
["'Irregularly irregular'", "AF", "No two R-R intervals the same; no clear P waves"],
["S1 Q3 T3", "Pulmonary embolism", "S wave in I, Q wave in III, T inversion in III"],
["Wellens pattern", "Critical LAD stenosis",
"Biphasic or deep T inversions in V2–V3; no pain at time of ECG"],
["Sgarbossa (≥3 pts)", "STEMI in BBB",
"Concordant ST elev ≥1mm (5pts), concordant ST dep V1-V3 (3pts), discordant ≥5mm (2pts)"],
]
story.append(colored_table(mnem_data, [46*mm, 40*mm, 82*mm], header_bg=DARK_GREY))
story.append(Spacer(1, 6))
# Practice recommendation
info_box(story,
"<b>How to get good at ECGs:</b> Read at least 1 ECG per day using your 8-step checklist. "
"Start with litfl.com/ecg-library (free, 500+ cases with explanations). "
"After 100 ECGs, patterns become automatic.", S)
# Footer on last page
story.append(Spacer(1, 8*mm))
story.append(HRFlowable(width="100%", thickness=0.5, color=MID_GREY))
story.append(Spacer(1, 3))
story.append(Paragraph(
"Sources: Harrison's Principles of Internal Medicine 22E (2025) · "
"Guyton & Hall Textbook of Medical Physiology · Miller's Anesthesia 10E · "
"Goldman-Cecil Medicine · Orris Medical Library",
S['small']))
story.append(Paragraph(
"This guide is for educational purposes. Always consult senior clinicians and institutional "
"guidelines for patient care decisions.",
ParagraphStyle('disc', fontSize=7, textColor=MID_GREY, fontName='Helvetica-Oblique',
alignment=TA_CENTER, leading=10)))
# ══════════════════════════════════════════════════════════════════
# PAGE NUMBERS
# ══════════════════════════════════════════════════════════════════
def add_page_number(canvas_obj, doc_obj):
canvas_obj.saveState()
page_num = canvas_obj.getPageNumber()
if page_num == 1:
cover_canvas(canvas_obj, doc_obj)
else:
# Header bar
canvas_obj.setFillColor(NAVY)
canvas_obj.rect(0, PAGE_H - 12*mm, PAGE_W, 12*mm, stroke=0, fill=1)
canvas_obj.setFont('Helvetica-Bold', 8)
canvas_obj.setFillColor(colors.white)
canvas_obj.drawString(18*mm, PAGE_H - 7.5*mm, "ECG Study Guide")
canvas_obj.setFont('Helvetica', 8)
canvas_obj.setFillColor(colors.HexColor("#BDC3C7"))
canvas_obj.drawRightString(PAGE_W - 18*mm, PAGE_H - 7.5*mm,
"Harrison · Guyton & Hall · Miller")
# Footer
canvas_obj.setFillColor(LIGHT_BG)
canvas_obj.rect(0, 0, PAGE_W, 10*mm, stroke=0, fill=1)
canvas_obj.setFont('Helvetica', 8)
canvas_obj.setFillColor(NAVY)
canvas_obj.drawCentredString(PAGE_W / 2, 3.5*mm, f"— {page_num} —")
canvas_obj.setFillColor(MID_GREY)
canvas_obj.setFont('Helvetica', 7)
canvas_obj.drawString(18*mm, 3.5*mm, "Orris Medical Education")
canvas_obj.restoreState()
doc.build(story, onFirstPage=add_page_number, onLaterPages=add_page_number)
print(f"PDF saved to: {output_path}")
if __name__ == "__main__":
output = "/tmp/workspace/ecg-study-guide/ECG_Study_Guide.pdf"
build_pdf(output)
cd /tmp/workspace/ecg-study-guide && python generate_ecg_pdf.py 2>&1
Flowable.draw() uses self.canv not self._canvas. Let me fix all the custom drawing classes.cd /tmp/workspace/ecg-study-guide && python -c " import re with open('generate_ecg_pdf.py', 'r') as f: content = f.read() # Replace self._canvas with self.canv everywhere inside draw() methods content = content.replace('c = self._canvas', 'c = self.canv') with open('generate_ecg_pdf.py', 'w') as f: f.write(content) print('Done') "
cd /tmp/workspace/ecg-study-guide && python generate_ecg_pdf.py 2>&1
ls -lh /tmp/workspace/ecg-study-guide/ECG_Study_Guide.pdf
cd /tmp/workspace/ecg-study-guide && python -c " from pypdf import PdfReader r = PdfReader('ECG_Study_Guide.pdf') print(f'Pages: {len(r.pages)}') print(f'Title: {r.metadata.title}') # Check each page has content for i, p in enumerate(r.pages): txt = p.extract_text() print(f' Page {i+1}: {len(txt)} chars') "
ECG Study Guide
PDF Document · PDF
| Pages | Content |
|---|---|
| 1 | Cover page with decorative ECG trace |
| 2 | Full Table of Contents (13 chapters) |
| 3 | Ch 1 - Foundations: what ECGs record, clinical uses table |
| 4 | Ch 2 - Conduction system diagram (SA → Purkinje, correlated to P/QRS/T) |
| 5 | Ch 3 - All ECG waves with a hand-drawn waveform on red ECG grid paper, full reference table |
| 6 | Ch 4 - ECG paper grid with annotated scale diagram + 300-rule colour ruler |
| 7 | Ch 5 - 12-lead placement diagram with territory map |
| 8 | Ch 6/7 - Normal sinus criteria, rate classification table, axis quick-look table |
| 9 | Ch 8 - Colour-coded 8-step systematic approach |
| 10 | Ch 9 - 8 arrhythmias (AF, flutter, all heart blocks, VT, VF) with bullet criteria |
| 11-12 | Ch 10 - STEMI criteria by territory, evolution timeline, ST/T change table |
| 13 | Ch 11 - LBBB vs RBBB table, WiLLiaM MaRRoW mnemonic, Sgarbossa criteria |
| 14 | Ch 12 - Potassium ECG effects (all levels), QT prolonging drugs, digoxin effect |
| 15-16 | Ch 13 - Quick reference cheat sheet: normal values, 8-step compact table, red flags, all mnemonics |