
mi ecg interpretation
Reading File
Now let me search the medical library for MI ECG interpretation content, in parallel with a web search for current resources.
Finding Sources
Finding Sources
Searching the Web
MI ECG interpretation ST elevation leads localization 2024
Good results. Let me now read the key textbook sections on MI ECG interpretation from Tintinalli's and Rosen's, and also search for leads/localization and Q waves content in parallel.
Reading File
Finding Sources
Finding Sources
Excellent content found. Let me read more of this section and fetch the ECG evolution image.
Reading File
Loading Image
Finding Sources
Excellent - I have the ECG evolution image. Now let me read the Rosen's section on ECG abnormalities in ACS, which seems very detailed.
Reading File
Loading Image
I have excellent content from multiple textbooks. Let me now read the Rosen's localization section and check for any images there.
Reading File
I now have comprehensive content from Rosen's and Frameworks for Internal Medicine. I have enough to write a thorough, well-structured answer. Let me compile the full response.
MI ECG Interpretation
A comprehensive guide to reading ECGs in myocardial infarction, covering the temporal evolution of changes, diagnostic criteria, lead localization, and mimics.
Temporal Evolution of ECG Changes
The ECG in STEMI evolves in a predictable sequence over time:
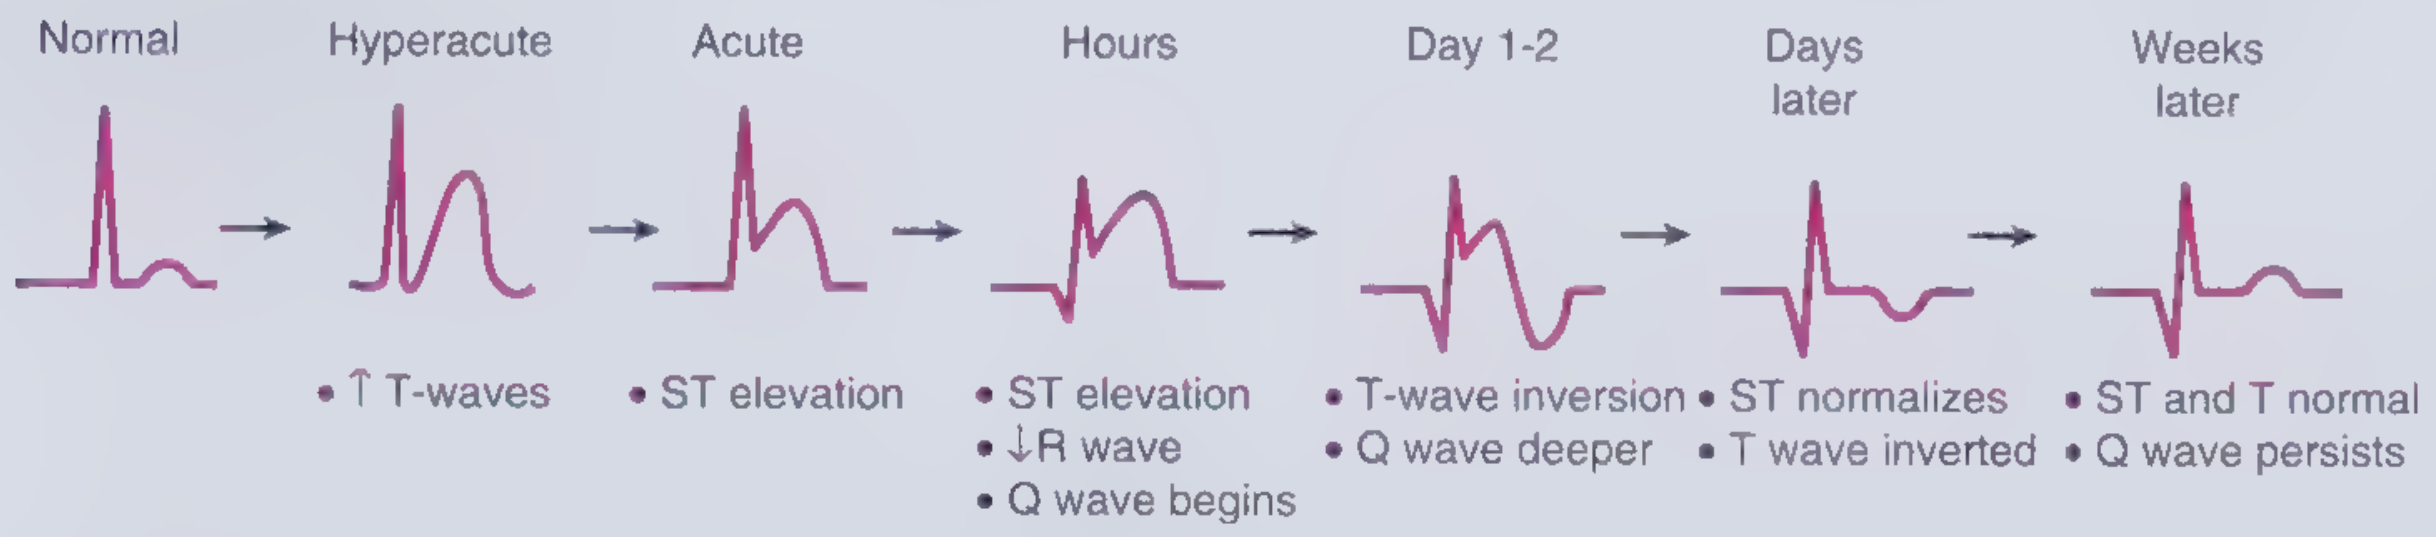
| Phase | Timing | ECG Finding |
|---|---|---|
| Hyperacute | Minutes | Tall, broad-based, peaked T-waves |
| Acute | Hours | ST elevation, Q wave begins, R wave decreases |
| Evolving | Hours-Days | ST elevation persists, deeper Q waves, T-wave inversion |
| Subacute | Day 1-2 | T-wave inversion, Q waves deepen |
| Resolving | Days later | ST normalizes, T wave still inverted |
| Chronic/Old | Weeks later | ST and T normal, Q waves persist |
The hyperacute T wave is the earliest sign - it appears within minutes of flow interruption but is transient and often missed on the first ECG. It progresses rapidly to ST elevation. - Rosen's Emergency Medicine, p. 999
STEMI Diagnostic Criteria
Per the Fourth Universal Definition of MI, STEMI is diagnosed by new ST elevation at the J point in ≥2 contiguous leads:
| Lead Group | Required ST Elevation |
|---|---|
| All leads except V2-V3 | ≥ 1 mm (0.1 mV) |
| V2-V3 in females (any age) | ≥ 1.5 mm |
| V2-V3 in males ≥40 years | ≥ 2 mm |
| V2-V3 in males <40 years | ≥ 2.5 mm |
- Frameworks for Internal Medicine, p. 33; Rosen's Emergency Medicine, p. 999
NSTEMI / UA ECG Findings
ECG findings in NSTEMI/UA include:
- New horizontal or downsloping ST depression ≥ 0.05 mV (0.5 mm) in ≥2 contiguous leads
- T-wave inversion ≥ 0.1 mV in ≥2 contiguous leads with prominent R wave or R/S ratio >1
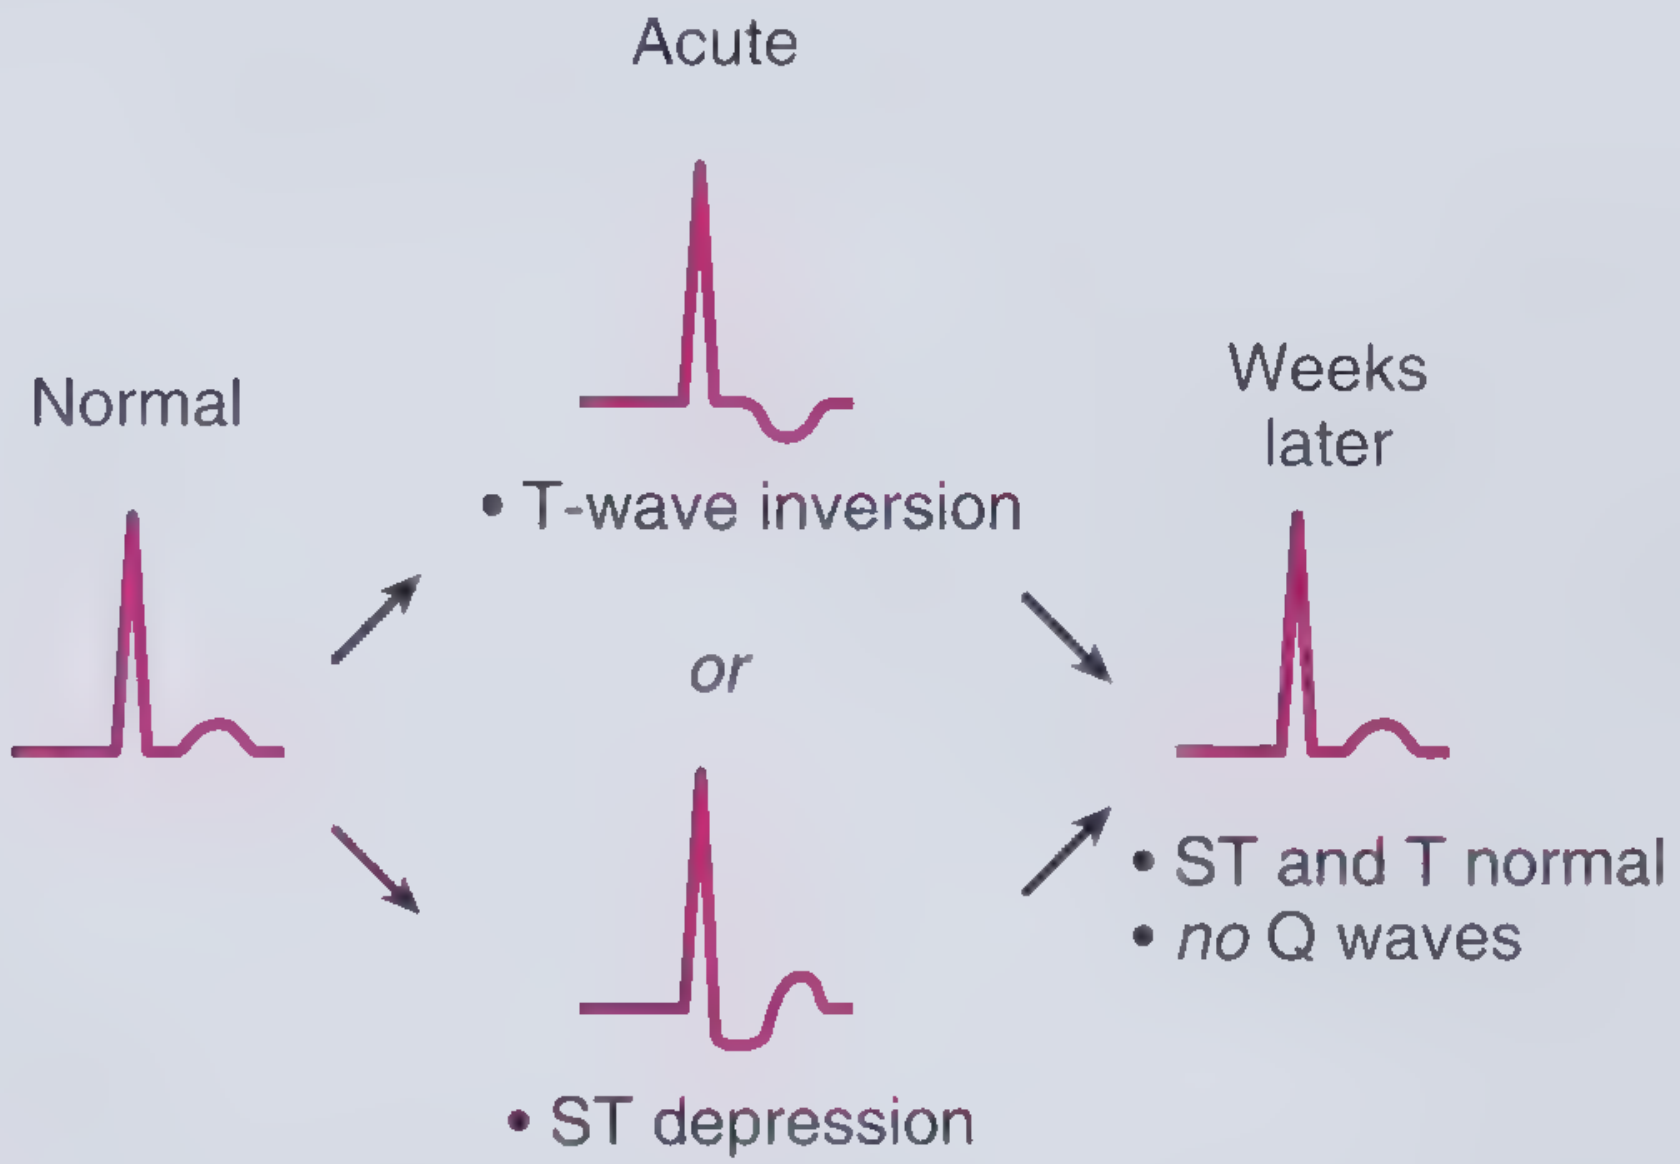
UA vs NSTEMI distinction: Both share similar ECG findings; they are differentiated by serum troponin elevation (NSTEMI = elevated troponin; UA = troponin negative). - Frameworks for Internal Medicine, p. 34
Lead Groups and Wall Localization
Contiguous leads are grouped by the myocardial territory they interrogate:
| Territory | Leads | Artery |
|---|---|---|
| Anterior/Septal | V1-V4 | LAD (left anterior descending) |
| Lateral | V5, V6, I, aVL | LCx (left circumflex) or LAD diagonal |
| Inferior | II, III, aVF | RCA (right coronary artery; occasionally LCx) |
| Posterior | V7-V9 (posterior leads); reciprocal depression V1-V3 | RCA or LCx |
| Right Ventricle | V3R, V4R | RCA proximal |
- Frameworks for Internal Medicine, p. 33
Key Localization Rules
- Anterior STEMI: ST elevation V1-V4 - suspect LAD occlusion
- Inferior STEMI: ST elevation II, III, aVF - the tallest elevation in lead III vs II suggests RCA occlusion; elevation greater in II suggests LCx
- Posterior MI: No direct ST elevation on standard 12-lead; instead, look for ST depression in V1-V3 with a dominant R wave - this is a reciprocal change from the posterior wall
- Right ventricular MI: Occurs with inferior STEMI; diagnose with right-sided leads (V4R). Critical to recognize because nitrates are contraindicated
Reciprocal Changes
Reciprocal ST depression appears in leads on the opposite side of the heart from the infarct territory. They increase the specificity and positive predictive value of the ECG for AMI.
-
Inferior MI (II, III, aVF elevation) → reciprocal depression best seen in aVL (150° away from lead III)
-
Anterior STEMI → less commonly shows reciprocal inferior depression
-
Posterior MI → ST depression in V1-V3 represents reciprocal change from posterior wall elevation (visible on V8-V9)
-
Rosen's Emergency Medicine, p. 1000
Pathological Q Waves
Q waves develop as myocardium becomes electrically silent:
- Begin to appear within hours of occlusion (may be transient in early ischemia)
- Become deeper over days 1-2
- Persist for weeks to years ("old MI" pattern)
- Criteria: Q wave duration ≥ 0.04 sec AND depth ≥ 25% of R wave height (in the appropriate leads)
Special ECG Patterns in MI
Wellens' Syndrome
Biphasic or deeply inverted T waves in V2-V3 in a pain-free patient = critical LAD stenosis (pre-infarction pattern). Do not stress test.
De Winter T waves
Upsloping ST depression with tall, symmetrical T waves in V1-V6 + subtle ST elevation in aVR = LAD occlusion equivalent (STEMI equivalent, but no ST elevation).
Sgarbossa Criteria (for LBBB)
Used to diagnose STEMI in the presence of LBBB or ventricular paced rhythm:
- Concordant ST elevation ≥ 1 mm (in the same direction as the QRS) - 5 points
- Concordant ST depression ≥ 1 mm in V1-V3 - 3 points
- Discordant ST elevation ≥ 5 mm - 2 points (less specific; the modified Sgarbossa criteria use a ratio of ST/S ≤ -0.25 instead)
A score ≥ 3 is considered positive for MI.
STEMI Mimics (False Positives)
Several conditions can produce ST elevation that is NOT MI:
| Condition | Distinguishing Feature |
|---|---|
| Benign early repolarization | Concave ST elevation, widespread, young males, no dynamic change |
| Acute pericarditis | Diffuse ST elevation (saddle-shaped), PR depression, no reciprocal changes |
| LVH | Strain pattern; elevation in V1-V2 with depression/inversion in lateral leads |
| LBBB | ST changes opposite to QRS direction (discordant) |
| Brugada syndrome | Coved ST elevation in V1-V2 with RBBB morphology |
| Takotsubo/stress cardiomyopathy | ST changes without culprit artery; apical ballooning on echo |
| Hyperkalemia | Peaked T waves, wide QRS, sine wave pattern |
| Myocarditis | Can mimic STEMI; diffuse or focal changes; elevated troponin |
- Frameworks for Internal Medicine, p. 34; Rosen's Emergency Medicine, p. 999
False Negatives (ECG Can Miss MI)
- Very early presentation (first few minutes)
- Prior MI with existing Q waves or persistent ST elevation
- LBBB (obscures ischemic changes)
- Ventricular paced rhythm
- Posterior MI on standard 12-lead (need posterior leads V7-V9)
- Right ventricular MI (need right-sided leads)
A single normal ECG does not rule out AMI - the negative predictive value is high but not 100%, even up to 12 hours after symptom onset. Serial ECGs are essential. - Rosen's Emergency Medicine, p. 999
Practical Step-by-Step MI ECG Interpretation
- Rate and rhythm - note any arrhythmia (VT/VF, complete heart block are MI complications)
- LBBB? - if new LBBB with chest pain, apply Sgarbossa criteria
- ST elevation? - measure at J point, identify contiguous leads, apply sex/lead-specific thresholds
- Localize - match leads to territory and artery
- Reciprocal changes? - confirms STEMI, raises specificity
- Posterior leads - if V1-V3 show ST depression, obtain V7-V9
- Right-sided leads - if inferior MI, obtain V4R to check RV involvement
- Hyperacute T waves? - even without STE, can indicate early STEMI equivalent
- Q waves? - estimate timing (new vs old)
- Dynamic changes? - compare to prior ECGs; serial tracings every 15-30 min in high-suspicion cases
Sources: Rosen's Emergency Medicine (9th ed.), p. 999-1000 | Frameworks for Internal Medicine, p. 33-34 | Fourth Universal Definition of Myocardial Infarction (ESC/ACC/AHA/WHF)
This is a shared conversation. Sign in to Orris to start your own chat.