
Explain me 10 common heart diseases with ecg changes and ecg images of those diseases.
Reading File
Now let me search the library and images in parallel:
Finding Sources
Searching Images
ECG changes myocardial infarction ST elevation
Finding Sources
Searching Images
atrial fibrillation ECG irregular rhythm no P waves
Searching Images
heart block complete AV block ECG P waves QRS dissociation
Searching Images
ventricular tachycardia ECG wide QRS complex
Searching Images
left ventricular hypertrophy ECG voltage criteria tall R waves
Searching Images
pulmonary embolism ECG S1Q3T3 right heart strain
Searching Images
Wolff-Parkinson-White syndrome ECG delta wave short PR interval
Searching Images
pericarditis ECG saddle-shaped ST elevation diffuse
Searching Images
hypertrophic cardiomyopathy ECG deep Q waves left ventricular hypertrophy
Searching Images
long QT syndrome ECG prolonged QT interval Torsades de Pointes
I now have all the ECG images I need. Let me compile the comprehensive response.Here is a comprehensive guide to 10 common heart diseases with their ECG changes and images:
10 Common Heart Diseases: ECG Changes & Images
1. ST-Elevation Myocardial Infarction (STEMI)
Pathophysiology: Complete occlusion of a coronary artery (most commonly the LAD) causes full-thickness myocardial injury.
ECG Changes:
- Hyperacute T waves — earliest sign; tall, peaked, symmetrical T waves
- ST-segment elevation ≥1 mm in ≥2 contiguous leads (convex/tombstone morphology)
- Pathological Q waves — develop within hours (>40 ms wide, >25% of R-wave height)
- Reciprocal ST depression in leads opposite the infarct territory
- T-wave inversion in the subacute/chronic phase
- Lead localisation: Anterior (V1–V4 → LAD), Inferior (II, III, aVF → RCA), Lateral (I, aVL, V5–V6 → LCx)
Anterior STEMI ECG:
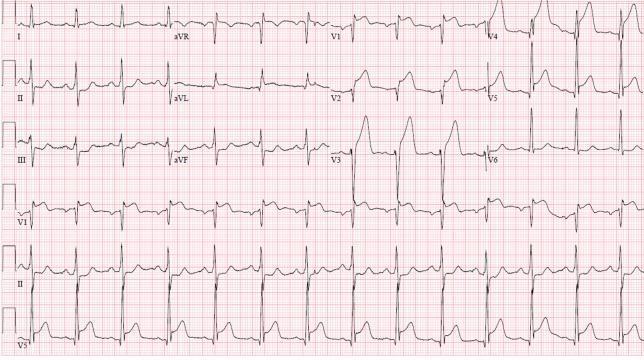
Anterolateral STEMI — convex ST elevation V1–V6 with hyperacute T waves; reciprocal depression in II, III, aVF. Consistent with proximal LAD occlusion.
Inferior STEMI ECG:
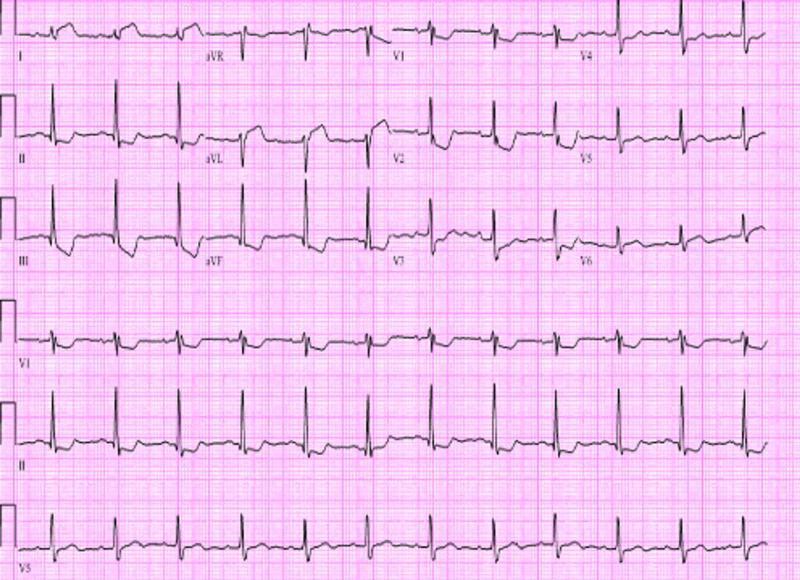
Inferior STEMI — ST elevation in II, III, aVF with reciprocal changes in I and aVL; prominent R waves and ST depression in V1–V3 suggest concurrent posterior wall involvement. Consistent with RCA or LCx occlusion.
2. Atrial Fibrillation (AF)
Pathophysiology: Chaotic, disorganised atrial electrical activity (400–600 impulses/min) from multiple re-entrant wavelets. The AV node filters the impulses, causing an irregular ventricular response.
ECG Changes:
- Absent P waves — replaced by fine/coarse fibrillatory (f) waves
- Irregularly irregular R-R intervals — the hallmark
- Narrow QRS complexes (unless aberrant conduction/pre-excitation)
- Ventricular rate varies: controlled (<100 bpm) or fast response (>100 bpm)
- f-waves best seen in V1 and inferior leads
AF ECG:
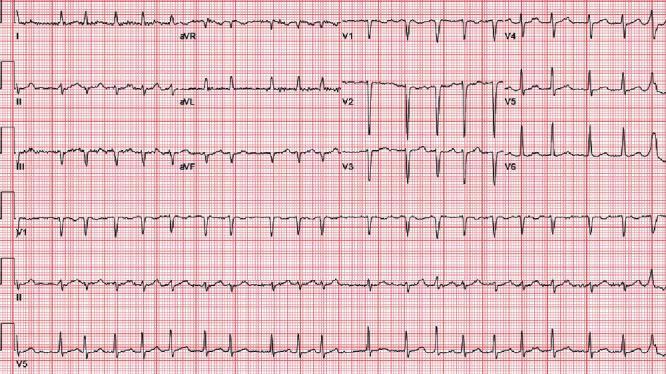
Classic AF — complete absence of P waves, fine fibrillatory baseline (best in V1), irregularly irregular narrow QRS complexes at ~126 bpm.
3. Complete (Third-Degree) AV Heart Block
Pathophysiology: Total failure of conduction through the AV node or His-Purkinje system. Atria and ventricles beat independently — the ventricles are driven by a slow escape rhythm.
ECG Changes:
- AV dissociation — P waves and QRS complexes have no relationship
- P waves — regular at a faster rate (SA node activity intact)
- QRS complexes — slow and regular (escape rhythm)
- Narrow QRS (~40–60 bpm) → junctional escape
- Wide QRS (~20–40 bpm) → ventricular escape
- Fixed, slow ventricular rate (bradycardia)
- P waves may march through or overlap QRS complexes
Complete Heart Block ECG:
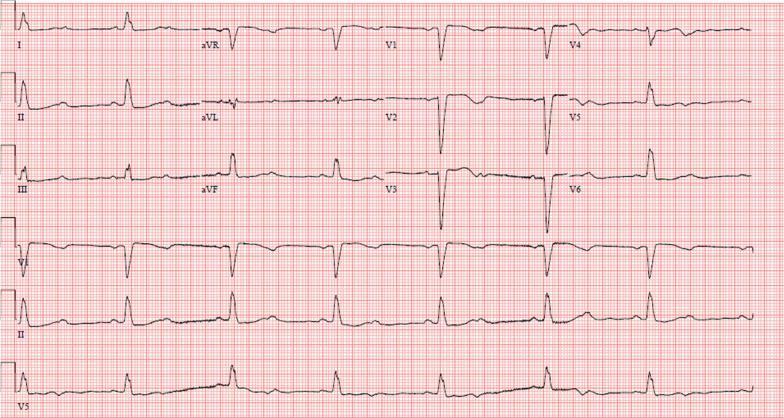
Complete heart block — regular P waves at a faster atrial rate with no fixed PR interval; wide QRS complexes at ~30–40 bpm indicating ventricular escape rhythm. AV dissociation is complete.
4. Ventricular Tachycardia (VT)
Pathophysiology: Rapid, life-threatening rhythm originating from the ventricular myocardium or Purkinje system, usually in the context of structural heart disease or ischaemia.
ECG Changes:
- Wide QRS complex tachycardia (QRS >120 ms, often >160 ms)
- Rate typically 100–250 bpm, regular or slightly irregular
- AV dissociation — P waves visible but unrelated to QRS
- Fusion beats and capture beats (pathognomonic for VT)
- Concordance — all precordial leads positive or negative (strongly suggests VT)
- Extreme axis deviation ("northwest axis" — negative in I and aVF)
- Morphology: Monomorphic (uniform QRS) or Polymorphic (changing QRS)
VT ECG:
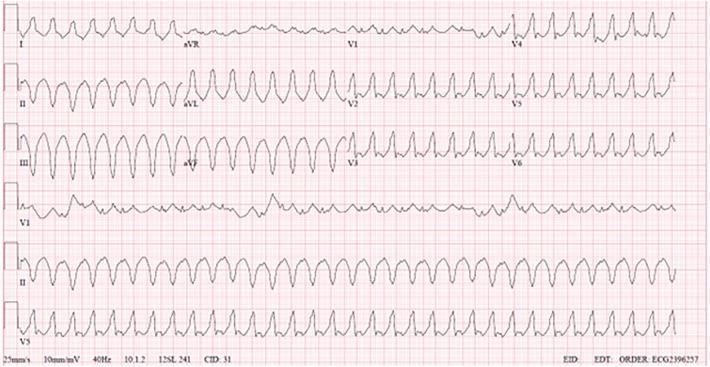
Monomorphic VT — rapid wide-complex tachycardia with positive concordance across precordial leads and superior axis. No visible P waves, consistent with ventricular origin.
5. Left Ventricular Hypertrophy (LVH) / Hypertensive Heart Disease
Pathophysiology: Chronic pressure or volume overload (most commonly systemic hypertension) causes myocardial hypertrophy, increasing electrical mass and altering repolarisation.
ECG Changes:
- High QRS voltage — Sokolow-Lyon criteria: S in V1 + R in V5 or V6 ≥35 mm
- Left axis deviation
- Strain pattern — ST depression + asymmetric T-wave inversion in I, aVL, V5–V6 (lateral leads)
- Prolonged QRS (may approach 110 ms)
- Left atrial enlargement — broad, notched P wave (P mitrale) in II; biphasic P in V1
LVH ECG:
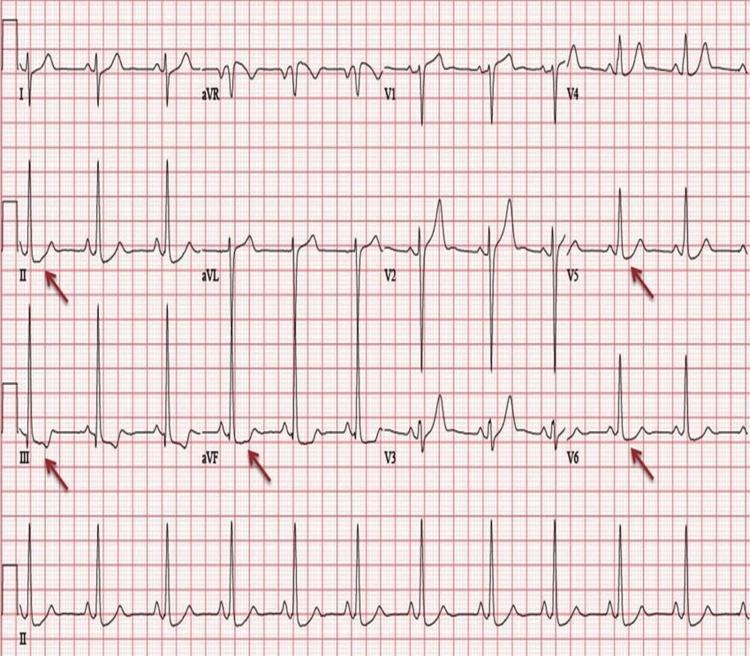
Classic LVH with strain pattern — high QRS voltage meeting Sokolow-Lyon criteria, with ST depression and T-wave inversions in inferolateral leads (II, III, aVF, V5–V6). Consistent with hypertensive heart disease.
6. Pulmonary Embolism (PE)
Pathophysiology: Acute obstruction of the pulmonary vasculature increases right ventricular afterload, causing acute cor pulmonale. The right ventricle dilates and shifts the interventricular septum, altering electrical axis.
ECG Changes:
- Sinus tachycardia — most common finding (>70%)
- S1Q3T3 pattern — deep S in I, Q wave in III, inverted T in III (McGinn-White sign)
- Right bundle branch block (RBBB) — complete or incomplete
- Right axis deviation
- T-wave inversions in V1–V4 — right ventricular strain pattern
- P pulmonale — peaked P waves >2.5 mm in inferior leads (right atrial enlargement)
- Atrial fibrillation or flutter (less common)
PE with S1Q3T3 ECG:
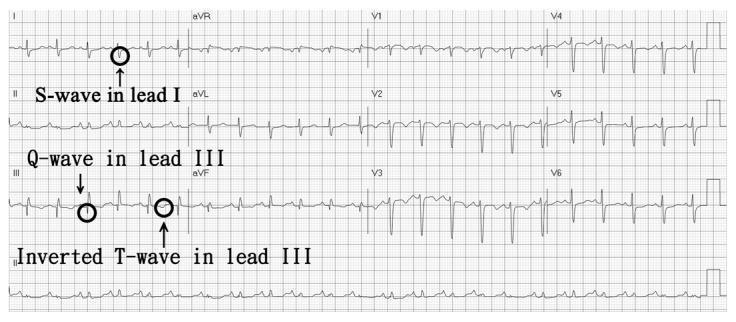
Acute PE — sinus tachycardia with the classic S1Q3T3 pattern annotated: deep S wave in Lead I, Q wave in Lead III, inverted T wave in Lead III. Reflects acute right ventricular strain.
PE with full RV strain pattern:
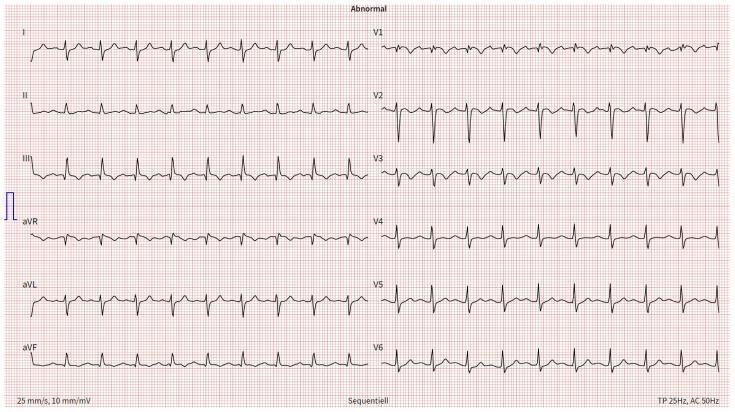
Acute PE — sinus tachycardia at 116 bpm, S1Q3T3, T-wave inversions V1–V3, incomplete RBBB with prolonged QRS (110 ms). Classic electrocardiographic signature of acute pulmonary vascular obstruction.
7. Wolff-Parkinson-White (WPW) Syndrome
Pathophysiology: An accessory pathway (Bundle of Kent) bypasses the AV node, causing ventricular pre-excitation. The ventricle begins to depolarise early via the accessory pathway (slow conduction → delta wave) before normal His-Purkinje activation.
ECG Changes:
- Short PR interval (<120 ms) — bypassing AV node delay
- Delta wave — slurred upstroke at the beginning of QRS (pre-excitation)
- Widened QRS (>120 ms) due to delta wave
- Secondary ST and T-wave changes (discordant repolarisation)
- Pseudo-infarction patterns — negative delta waves in inferior leads may mimic Q waves
- Paroxysmal SVT — narrow-complex orthodromic AVRT most common
- Risk: If AF develops → very rapid conduction via accessory pathway → VF
WPW ECG:
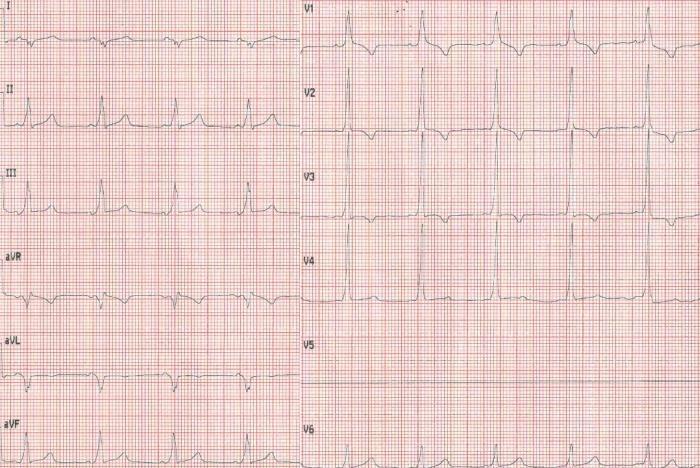
WPW syndrome — short PR interval (<120 ms), prominent delta waves slurring the QRS onset in II, III, aVF and V2–V6, with widened QRS and secondary ST-T changes. Classic triad of pre-excitation.
8. Acute Pericarditis
Pathophysiology: Inflammation of the pericardium causes epicardial myocardial irritation, producing diffuse repolarisation changes. Unlike MI, changes are not localised to a single coronary territory.
ECG Changes (4 Stages):
- Stage 1 (acute):
- Diffuse concave ("saddle-shaped") ST elevation in nearly all leads except aVR and V1
- PR-segment depression (most specific finding) in I, II, V4–V6
- PR elevation in aVR (reciprocal)
- Spodick's sign — downsloping TP segment
- Stage 2: ST normalises; T waves flatten
- Stage 3: T-wave inversions
- Stage 4: ECG normalises
Key differentiator from STEMI: Diffuse (not localised) ST elevation; concave not convex morphology; PR depression; no reciprocal changes (except aVR).
Pericarditis ECG:
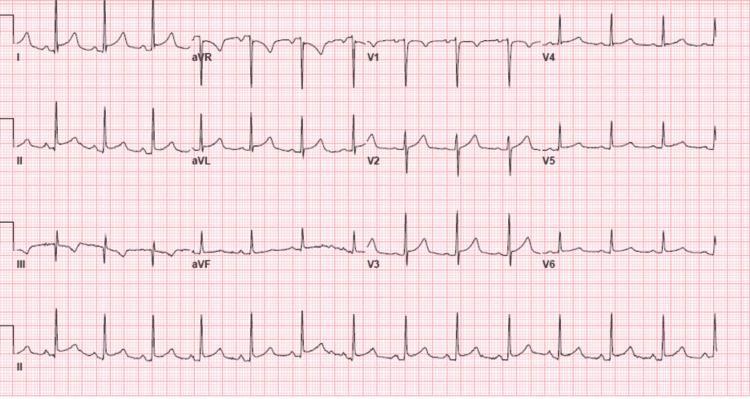
Acute pericarditis — diffuse concave ST elevation in I, II, III, aVF, V2–V6 with PR-segment depression in inferior and lateral leads, PR elevation in aVR. No reciprocal depression (unlike STEMI).
9. Hypertrophic Cardiomyopathy (HCM)
Pathophysiology: Genetic sarcomere protein mutations (MYH7, MYBPC3) cause asymmetric myocardial hypertrophy with myofiber disarray, creating abnormal depolarisation and repolarisation — particularly in the interventricular septum and apex.
ECG Changes:
- LVH voltage criteria — Sokolow-Lyon ≥35 mm
- Deep, narrow ("dagger") Q waves in I, aVL, V5–V6 (septal depolarisation away from lateral leads)
- ST depression and T-wave inversions in lateral leads (strain pattern)
- Apical HCM (Yamaguchi syndrome):
- "Giant" T-wave inversions (>10 mm, deeply symmetric) in V3–V6 — hallmark finding
- No significant Q waves
- Left axis deviation
- Atrial fibrillation (common complication)
- PR shortening may occur
HCM ECG:
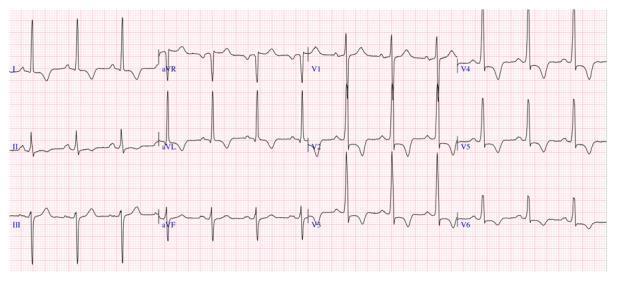
Septal HCM — high R-wave voltage V2–V4 meeting LVH criteria, lateral strain pattern with ST depression and deep T-wave inversions V2–V6 and I, aVL. Note absence of septal Q waves.
Apical HCM (Yamaguchi syndrome) ECG:
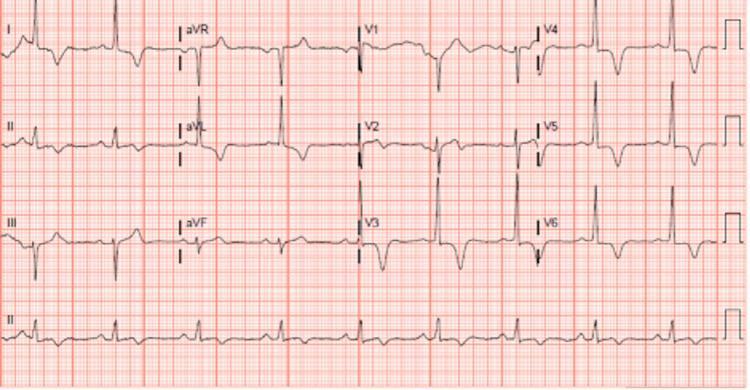
Apical HCM — giant, deep symmetric T-wave inversions most prominent in V3–V5 with high QRS voltage. This pattern ("Yamaguchi sign") is pathognomonic for apical variant HCM.
10. Long QT Syndrome (LQTS)
Pathophysiology: Inherited or acquired defects in cardiac ion channels (K⁺ or Na⁺) prolong the ventricular action potential repolarisation phase. This creates a vulnerable window for early afterdepolarisations, predisposing to Torsades de Pointes (TdP) → VF → sudden cardiac death.
ECG Changes:
- Prolonged QTc interval — the defining feature
- QTc >440 ms (men), >460 ms (women) — abnormal
- QTc >500 ms — high risk for TdP
- Abnormal T-wave morphology: broad, notched, or bifid T waves (LQT1: broad; LQT2: notched; LQT3: long isoelectric segment then peaked T)
- T-wave alternans — beat-to-beat variation in T-wave amplitude/polarity (marker of instability)
- Bradycardia (especially LQT1)
- Torsades de Pointes — polymorphic VT with "twisting" QRS complexes around the isoelectric baseline; initiated by R-on-T phenomenon
Long QT + Torsades de Pointes ECG:
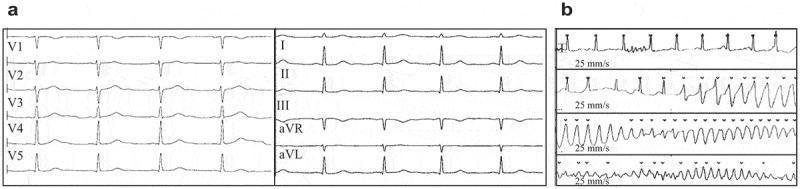
LQTS — panel (a) shows markedly prolonged QTc (478 ms) in sinus rhythm; panel (b) shows onset of Torsades de Pointes with characteristic polymorphic "twisting" QRS complexes around the isoelectric line.
Quick Reference Summary Table
| Disease | Key ECG Finding | Rhythm | Rate |
|---|---|---|---|
| STEMI | ST elevation (convex) + Q waves + reciprocal changes | Sinus | Variable |
| Atrial Fibrillation | Absent P waves, irregularly irregular | AF | Variable |
| Complete Heart Block | AV dissociation, P independent of QRS | Escape | Slow (20–40) |
| Ventricular Tachycardia | Wide QRS >120 ms, AV dissociation | VT | 100–250 |
| LVH / Hypertensive HD | Sokolow-Lyon ≥35 mm, lateral strain | Sinus | Normal |
| Pulmonary Embolism | S1Q3T3, sinus tachycardia, RBBB | Sinus tach | Fast |
| WPW Syndrome | Short PR, delta wave, wide QRS | Sinus ± SVT | Variable |
| Acute Pericarditis | Diffuse concave ST elevation, PR depression | Sinus | Normal/fast |
| Hypertrophic CM | Deep Q waves / giant T inversions (apical) | Sinus ± AF | Variable |
| Long QT Syndrome | QTc >480 ms, T alternans → Torsades | Sinus → TdP | Bradycardia |
Clinical Pearl: ECG interpretation always requires clinical context. Many of these patterns can overlap — for example, WPW with AF can mimic VT, and early pericarditis can superficially resemble STEMI. Serial ECGs and correlation with symptoms, troponins, and echocardiography are essential.Here's a complete guide to 10 common heart diseases with ECG changes and real ECG images from peer-reviewed medical literature:
The guide covers:
- STEMI — Convex ST elevation, hyperacute T waves, Q waves, reciprocal changes (anterior + inferior ECG images shown)
- Atrial Fibrillation — Absent P waves, irregularly irregular rhythm, fibrillatory baseline
- Complete AV Heart Block — P-QRS dissociation, slow escape rhythm, wide QRS
- Ventricular Tachycardia — Wide complex tachycardia, AV dissociation, concordance
- LVH / Hypertensive Heart Disease — Sokolow-Lyon voltage criteria, lateral strain pattern
- Pulmonary Embolism — S1Q3T3, sinus tachycardia, right ventricular strain (two ECG examples)
- WPW Syndrome — Short PR, delta wave, widened QRS, secondary ST-T changes
- Acute Pericarditis — Diffuse concave ST elevation, PR depression (differentiating from STEMI)
- Hypertrophic Cardiomyopathy — Deep Q waves (septal), giant T-wave inversions in apical variant
- Long QT Syndrome — Prolonged QTc, T alternans, Torsades de Pointes initiation
Each entry includes pathophysiology, specific ECG criteria, and authentic clinical ECG images with annotated descriptions. The summary table at the end provides a rapid reference for the key differentiating ECG feature of each disease.
This is a shared conversation. Sign in to Orris to start your own chat.