
Teach me ECG from the beginning, think you're teaching a donkey
Reading File
Now let me search the library for ECG content and web search in parallel.
Finding Sources
Searching the Web
ECG basics beginner guide P wave QRS T wave explained
Reading File
Finding Sources
Reading File
Loading Image
Reading File
Finding Sources
Loading Image
Reading File
I now have everything I need. Let me also grab the lead placement diagram image and then deliver the full lesson.
Loading Image
Alright, sit down and listen carefully. We're going to build this up from absolutely zero.
🫏 ECG From Scratch - For the Absolute Beginner
CHAPTER 1: What Even IS an ECG?
Your heart is basically a pump. But before it pumps, it needs an electrical spark to tell the muscle "squeeze now." That spark travels through the heart in a very specific path every single beat.
An ECG (ElectroCardioGram) - also called an EKG - is just a recording of those electrical sparks picked up from the skin surface. It does NOT measure blood flow, pressure, or squeezing strength directly. It measures electricity.
Think of it like this: if you put a microphone next to a drum kit, you'd hear the rhythm of the drums. An ECG is like putting "electrical microphones" (stickers called electrodes) on your skin to record the rhythm of your heart's electrical activity.
CHAPTER 2: The Heart's Electrical Highway
Before you can read an ECG, you need to know where the electricity goes. Here is the path, every single beat:
SA Node → Both Atria → AV Node → Bundle of His
        → Left & Right Bundle Branches → Purkinje Fibers → Ventricles
Let's translate that into donkey-friendly language:
-
SA Node (sinoatrial node) - the "boss." Sits in the right atrium. Fires spontaneously and starts every beat. This is the natural pacemaker. Normal rate: 60-100 times/min.
-
Both Atria light up - the electrical signal spreads across the top chambers (atria), making them contract and push blood down into the ventricles.
-
AV Node (atrioventricular node) - a "speed bump" at the junction between atria and ventricles. It DELIBERATELY slows the signal down by about 0.1 seconds to give the ventricles time to fill with blood before they squeeze.
-
Bundle of His → Bundle Branches → Purkinje Fibers - the electrical "motorway" that spreads the signal rapidly to all ventricular muscle cells so they contract in a coordinated, efficient way.
-
Ventricles contract - the main pumping chambers squeeze blood to the lungs (right ventricle) and body (left ventricle).
This full cycle repeats 60-100 times every minute in a healthy person.
CHAPTER 3: The Waves - P, QRS, T
Here is the cardiac cycle from the textbook, showing exactly how the ECG waves relate to what the heart is physically doing:
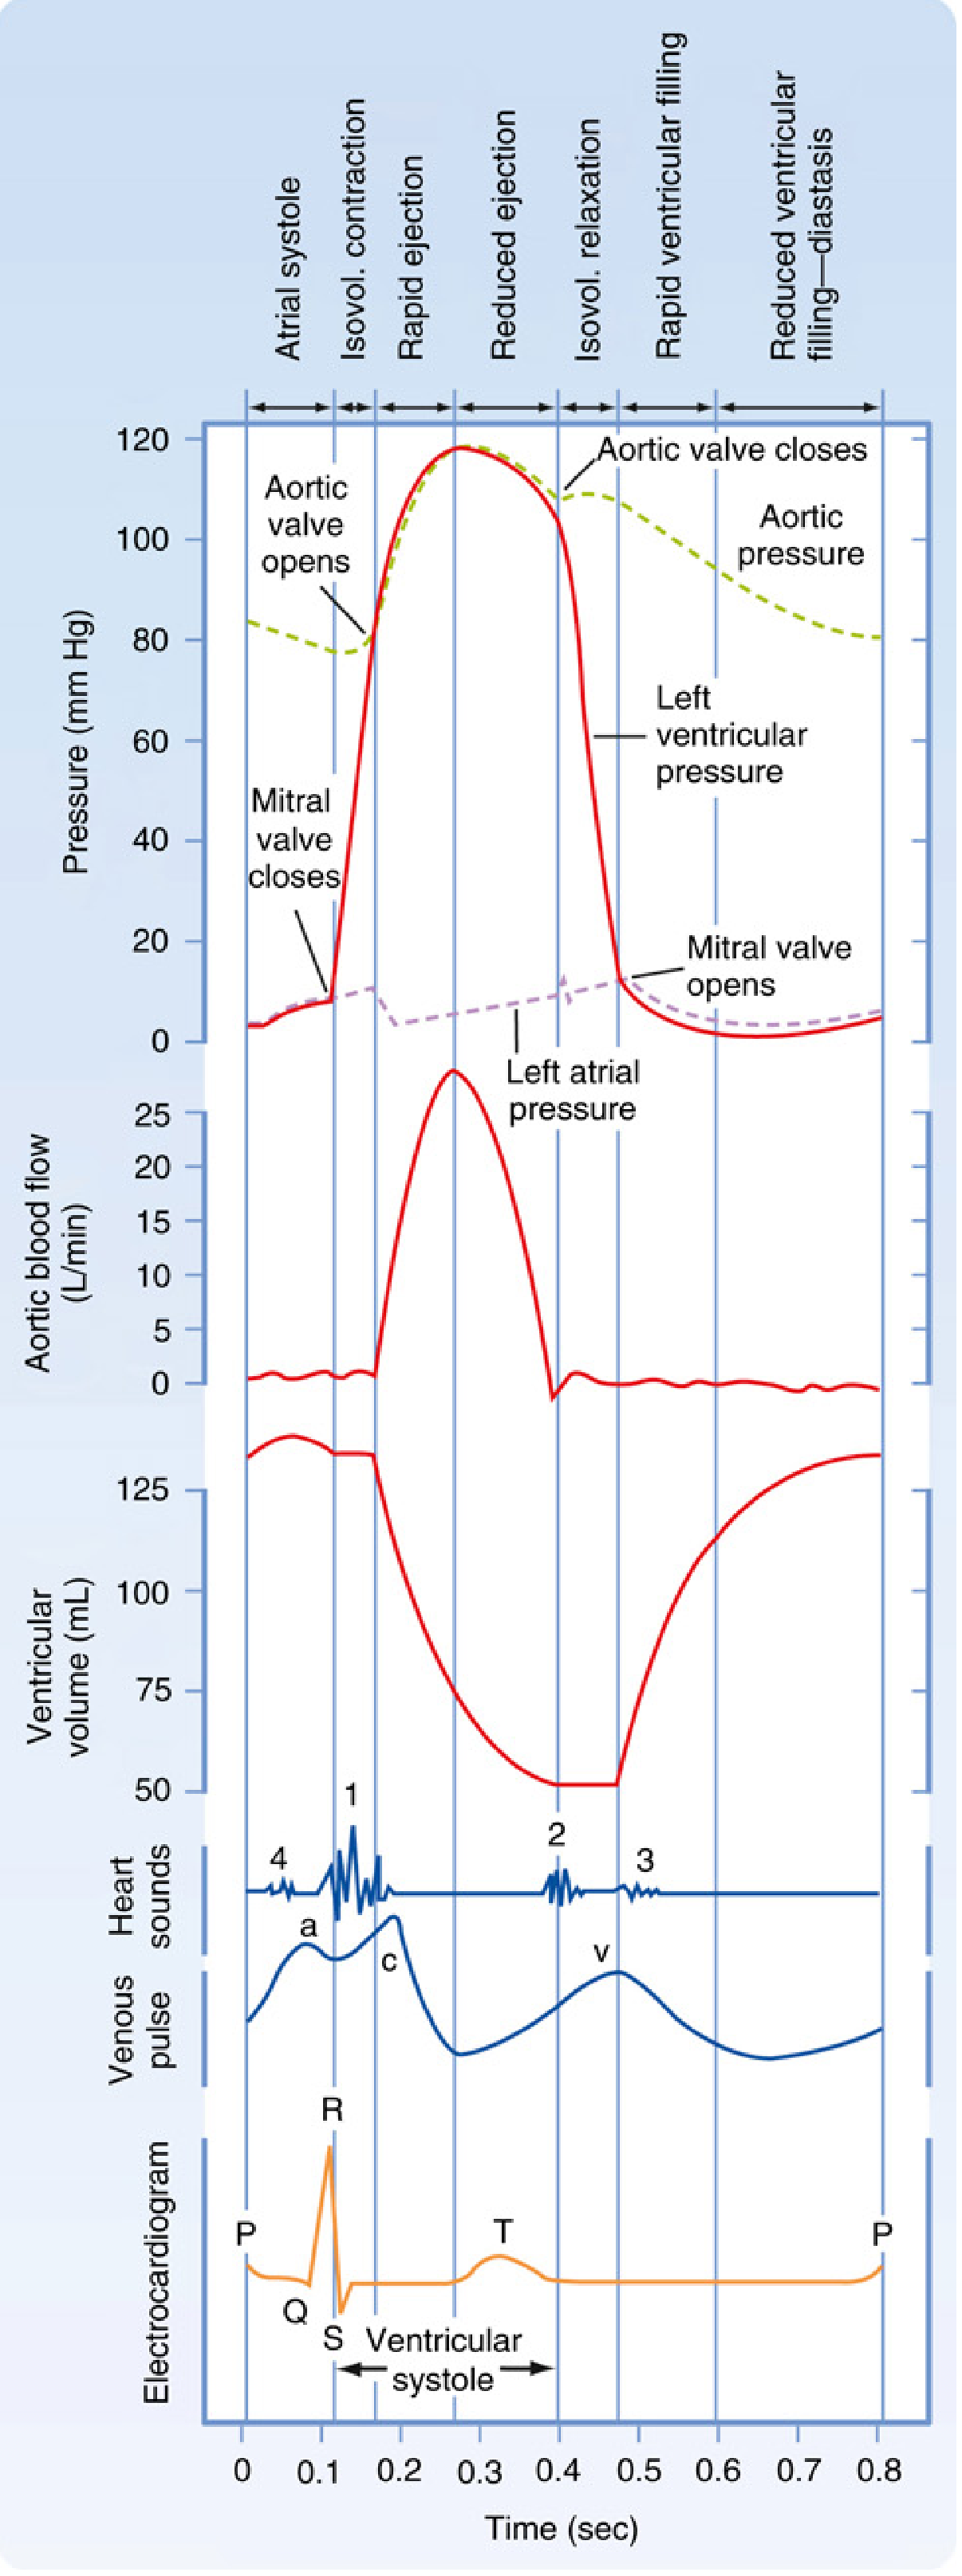
Every heartbeat on an ECG looks like this sequence:
P Wave - "The Atria Are Firing"
- Caused by atrial depolarization (atria receiving the electrical signal and contracting)
- Should be small, rounded, and upright (in lead II)
- Duration: 0.06 - 0.12 seconds (1.5 to 3 small boxes)
- Height: 2-3 mm
- No P wave = the SA node is not in charge (trouble!)
PR Interval - "The Speed Bump Delay"
- From start of P wave to start of QRS
- This is the time the signal spends at the AV node
- Normal: 0.12 - 0.20 seconds (3-5 small boxes)
- Too long (>0.20s) = heart block
- Too short (<0.12s) = signal bypassing the AV node (e.g. WPW syndrome)
QRS Complex - "The Ventricles Are Firing"
- Caused by ventricular depolarization (both ventricles receiving the signal and contracting - this is the main squeeze that pushes blood out)
- It's normally narrow and sharp because the Purkinje system distributes electricity very fast
- Normal duration: <0.12 seconds (less than 3 small boxes)
- Wide QRS (≥0.12s) = bundle branch block or abnormal conduction path
- Q wave: small downward deflection (first)
- R wave: the big upward spike (tallest, most obvious)
- S wave: downward deflection after the R
ST Segment - "The Ventricles Are Still Charged"
- Flat line between QRS and T wave
- Should be at baseline (isoelectric)
- ST elevation = myocardial infarction (heart attack) until proven otherwise
- ST depression = ischemia or other pathology
T Wave - "The Ventricles Are Resetting"
- Caused by ventricular repolarization (ventricles resetting electrically for the next beat)
- Normally upright and slightly asymmetric (gentle rise, steeper fall)
- Where is atrial repolarization? Hidden inside the QRS complex - too small to see.
QT Interval
- From start of QRS to end of T wave
- Represents total ventricular electrical activity
- Corrected QT (QTc): normally <440ms in men, <460ms in women
- Prolonged QT = risk of dangerous arrhythmia (Torsades de Pointes)
Here is what all of this looks like on actual ECG paper:
CHAPTER 4: The Paper - Reading the Grid
ECG paper is a grid of small and large boxes:
| Box type | Width | Height |
|---|---|---|
| Small box | 0.04 seconds (40 ms) | 0.1 mV |
| Large box (5 small boxes) | 0.20 seconds (200 ms) | 0.5 mV |
| 5 large boxes | 1.0 second | - |
The paper usually runs at 25 mm/second (standard speed).
How to calculate heart rate (the easy trick):
Count the number of large boxes between two consecutive R waves (R-R interval), then:
Heart Rate = 300 ÷ (number of large boxes)
| Large boxes between R waves | Heart Rate |
|---|---|
| 1 | 300 bpm |
| 2 | 150 bpm |
| 3 | 100 bpm |
| 4 | 75 bpm |
| 5 | 60 bpm |
| 6 | 50 bpm |
Memorize: 300 - 150 - 100 - 75 - 60 - 50
CHAPTER 5: The 12 Leads - 12 Camera Angles
Here is the part people get confused by. The electrodes stuck on your body are NOT 12 separate wires measuring 12 separate things. You only need 10 electrodes to get 12 leads.
Each "lead" is just a different camera angle looking at the heart's electrical activity. Like photographing a statue from 12 different angles - same statue, different perspectives.
The 10 electrode positions:
- 4 limb electrodes: Right arm (RA), Left arm (LA), Right leg (RL), Left leg (LL)
- 6 chest electrodes: V1 through V6
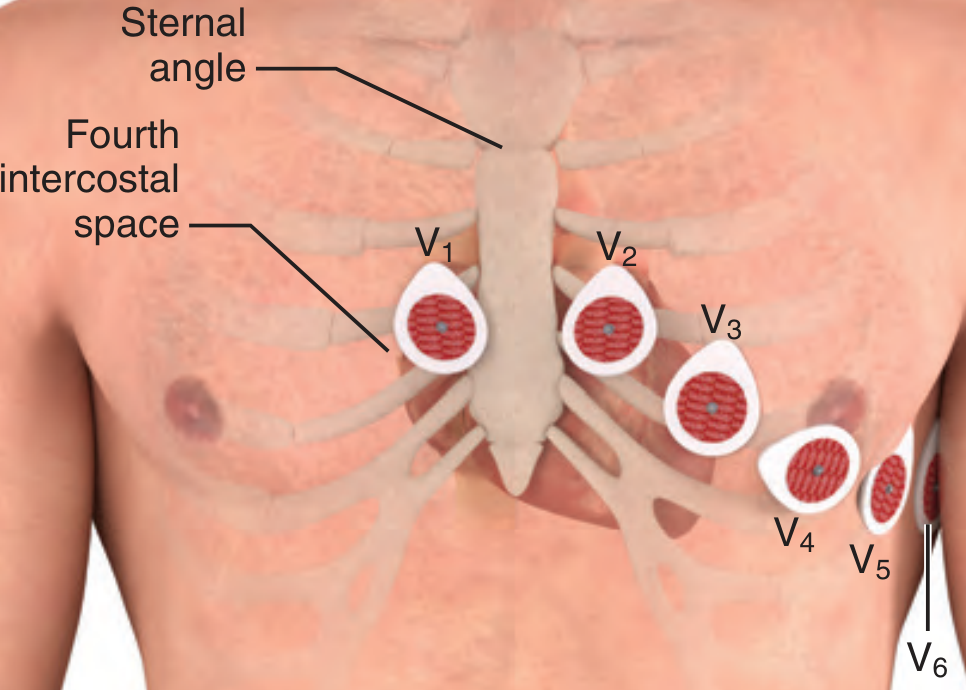
Chest lead positions:
- V1 - Right sternal border, 4th intercostal space
- V2 - Left sternal border, 4th intercostal space
- V3 - Between V2 and V4
- V4 - Left midclavicular line, 5th intercostal space
- V5 - Left anterior axillary line, same horizontal level as V4
- V6 - Left midaxillary line, same horizontal level as V4 and V5
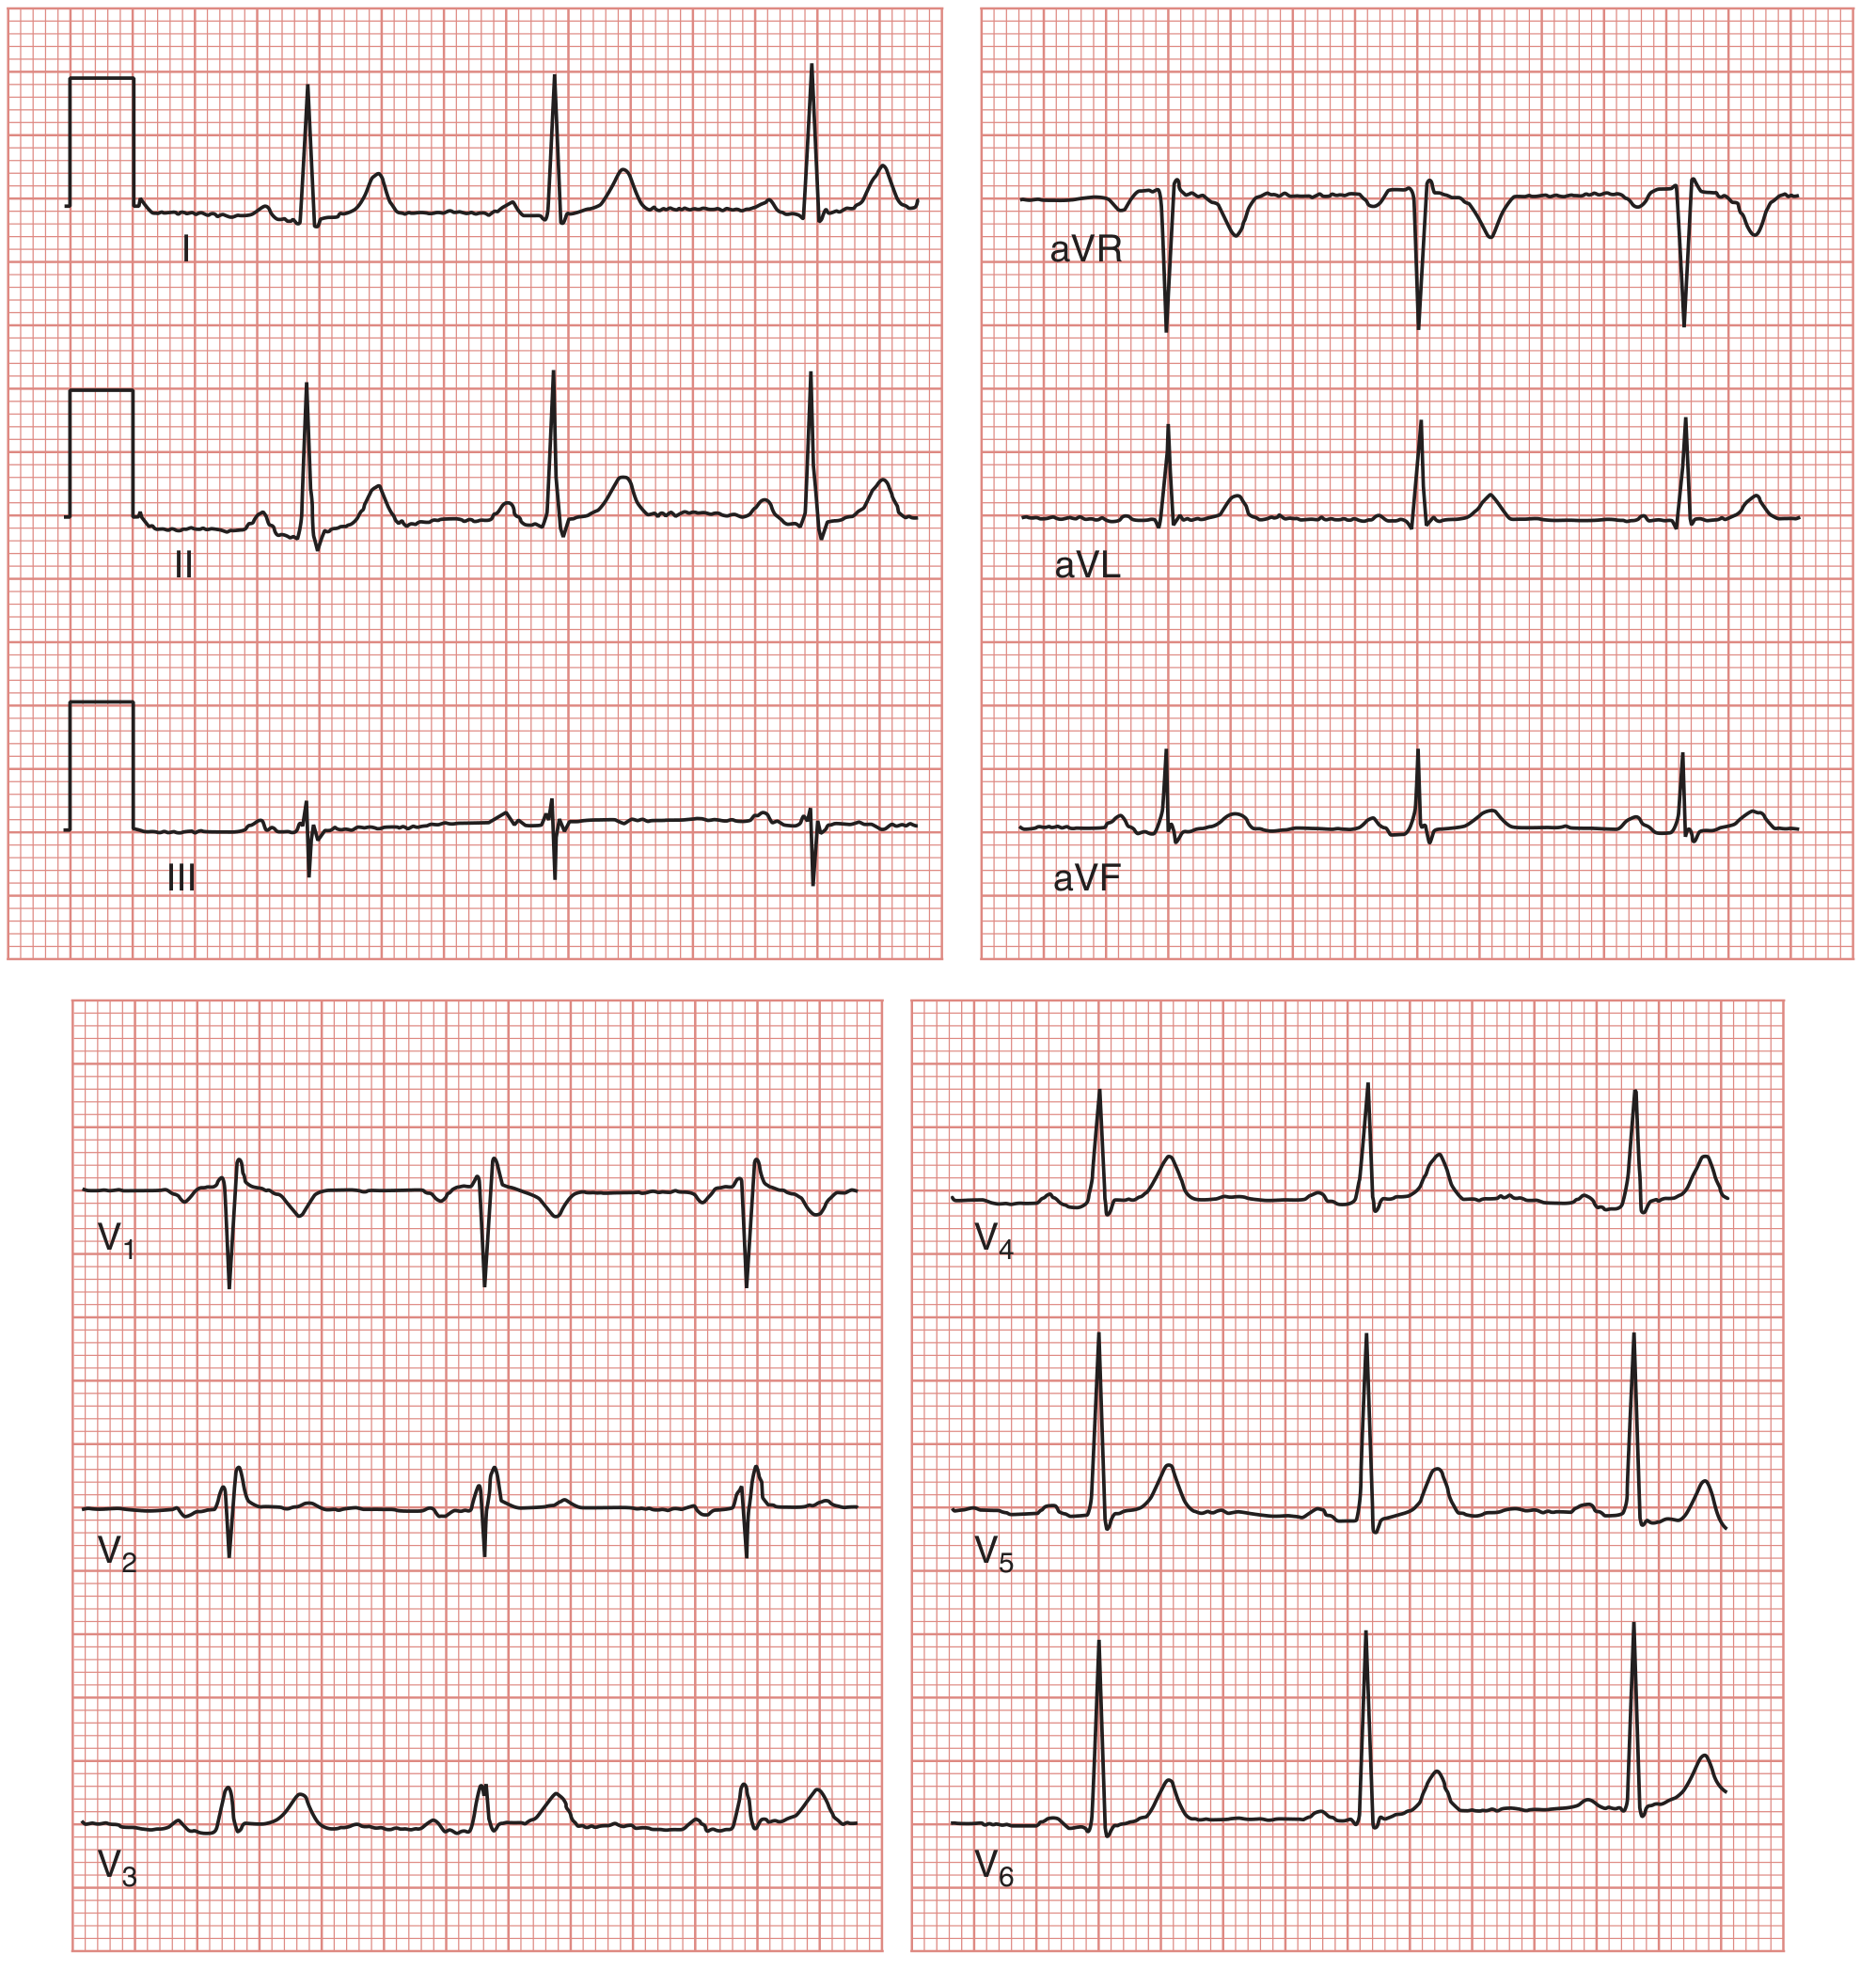
The 12 leads and what they "see":
| Leads | View of the heart |
|---|---|
| I, aVL | Lateral wall (left side) |
| II, III, aVF | Inferior wall (bottom, supplied by right coronary artery) |
| aVR | Right atrium / cavity - usually inverted, almost everything is negative here |
| V1 - V2 | Septal (between ventricles) |
| V3 - V4 | Anterior wall (front) |
| V5 - V6 | Lateral wall (left side) |
This is important for localizing a heart attack - changes in specific leads tell you which part of the heart is affected.
Here is what a normal 12-lead ECG looks like:
CHAPTER 6: The 8-Step Method - How to Read Every ECG Systematically
Never just "look at an ECG." Always use a systematic approach, or you'll miss things. Here is the method from Medical Physiology:
| Step | What to do |
|---|---|
| 1 | Search for P waves - Are they present? Are they normal-shaped? |
| 2 | Relationship of P to QRS - Does every P have a QRS after it? Is the PR interval constant? |
| 3 | Identify the pacemaker - Is it the SA node? AV node? Ventricle? |
| 4 | Measure the heart rate - Use the 300 trick |
| 5 | QRS shape - Narrow (<0.12s) or wide (≥0.12s)? |
| 6 | ST segment - Elevated, depressed, or flat? |
| 7 | QRS axis - Is it normal, left-deviated, or right-deviated? |
| 8 | Rhythm - Look at a long rhythm strip (lead II), is it regular? |
CHAPTER 7: Axis - Which Way is the Electricity Going?
The QRS axis tells you the average direction the electricity flows through the ventricles. Normally it flows downward and to the left (toward the left ventricle, the big pump).
The quick method: look at leads I and aVF
| Lead I | aVF | Axis |
|---|---|---|
| Positive (upright QRS) | Positive (upright QRS) | Normal (-30° to +90°) |
| Positive | Negative | Left axis deviation (LAD) |
| Negative | Positive | Right axis deviation (RAD) |
| Negative | Negative | Extreme axis ("no man's land") |
Causes of LAD: left ventricular hypertrophy, left bundle branch block, inferior MI
Causes of RAD: right ventricular hypertrophy, left posterior hemiblock, COPD, PE
CHAPTER 8: Normal Sinus Rhythm - What "Normal" Looks Like
When you look at an ECG and want to call it "normal sinus rhythm" (NSR), it must have ALL of these:
- ✅ Heart rate 60-100 bpm
- ✅ Every QRS preceded by a P wave
- ✅ Every P wave followed by a QRS
- ✅ PR interval 0.12-0.20 seconds
- ✅ QRS duration <0.12 seconds
- ✅ Regular rhythm (R-R intervals roughly equal)
- ✅ P waves upright in lead II, inverted in aVR
CHAPTER 9: The Most Common Abnormalities (Just the Concepts)
Atrial Fibrillation (AF)
- No P waves at all - replaced by chaotic "fibrillatory" baseline
- Irregularly irregular rhythm (no pattern to the R-R intervals)
- Most common arrhythmia in clinical practice
Bundle Branch Block (BBB)
- Wide QRS (≥0.12s) because the signal detours through muscle instead of the fast Purkinje highway
- LBBB (Left BBB): broad notched QRS in V5/V6, pattern "WiLLiaM" (W in V1, M in V6)
- RBBB (Right BBB): RSR' ("rabbit ears") in V1, pattern "MoRRoW" (M in V1, W in V6)
STEMI (ST Elevation Myocardial Infarction - Heart Attack)
- ST elevation ≥1mm in 2 or more contiguous leads
- The location of elevation tells you which artery is blocked
- This is a medical emergency - treat immediately
Heart Block
- 1st degree: PR interval >0.20s (just slow AV node, no beats dropped)
- 2nd degree Mobitz I (Wenckebach): PR interval gets longer and longer until a QRS is dropped, then resets
- 2nd degree Mobitz II: PR interval constant but some P waves suddenly not followed by QRS - dangerous
- 3rd degree (Complete heart block): P waves and QRS complexes are completely independent of each other, no communication between atria and ventricles at all
Quick Cheat Sheet
P wave      = Atria depolarizing         (duration: <0.12s)
PR interval = AV node delay              (normal: 0.12-0.20s)
QRS         = Ventricles depolarizing    (duration: <0.12s)
ST segment  = Ventricles charged         (should be flat/isoelectric)
T wave      = Ventricles repolarizing    (should be upright)
QT interval = Total ventricular activity (QTc <440ms men, <460ms women)

Heart rate  = 300 ÷ large boxes between R waves
Normal rate = 60-100 bpm

Small box   = 0.04 sec  |  Large box = 0.20 sec
That is ECG from the ground up. Start by memorizing the electrical pathway (SA node → AV node → bundle branches → Purkinje → ventricles), then the waves (P-QRS-T), then the paper, then the 12 leads, then use the 8-step method on every ECG you encounter. Practice is the only way to get fast at this.
Sources: Medical Physiology (Boron & Boulpaep), Miller's Anesthesia 10th ed., Roberts & Hedges' Clinical Procedures in Emergency Medicine
This is a shared conversation. Sign in to Orris to start your own chat.