
Fatty liver management
"nonalcoholic fatty liver disease" AND management
MASLD MAFLD fatty liver management guidelines 2025 2026
PMID: 41201884
PMID: 40089151
NAFLD MASLD fatty liver management algorithm spectrum steatosis steatohepatitis fibrosis
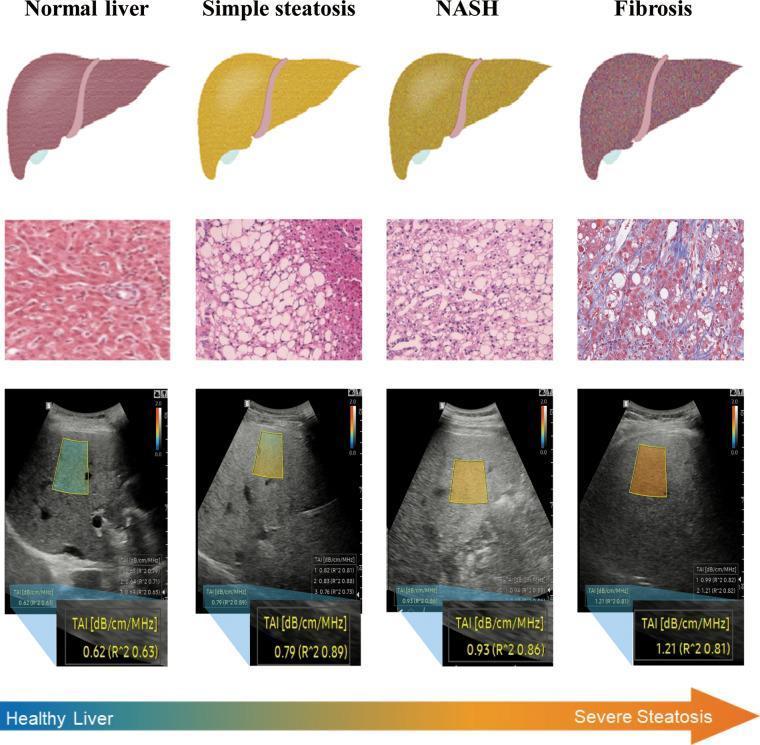
A multi-modal comparison chart illustrating the progression of Non-alcoholic Fatty Liver Disease (NAFLD) across four stages: Normal liver, Simple steatosis, Non-alcoholic steatohepatitis (NASH), and Fibrosis. The top row shows gross anatomical illustrations where the liver transitions from a healthy reddish-brown to a pale yellowish-orange (steatosis/NASH) and finally a mottled purplish-brown (fibrosis). The middle row presents histological micrographs (H&E and Masson's Trichrome staining), highlighting the emergence of clear macrovesicular fat droplets in steatosis, inflammatory infiltration in NASH, and blue-stained collagen deposition in the fibrosis stage. The bottom row displays B-mode ultrasound images with Tissue Attenuation Imaging (TAI) overlays. As the disease severity increases from healthy to severe steatosis, the liver parenchyma exhibits increased echogenicity (brightness) and the quantitative TAI value rises sequentially from 0.62 to 1.21 dB/cm/MHz. This infographic serves as an educational tool for medical professionals to correlate gross morphology, cellular pathology, and diagnostic ultrasound parameters in hepatology.
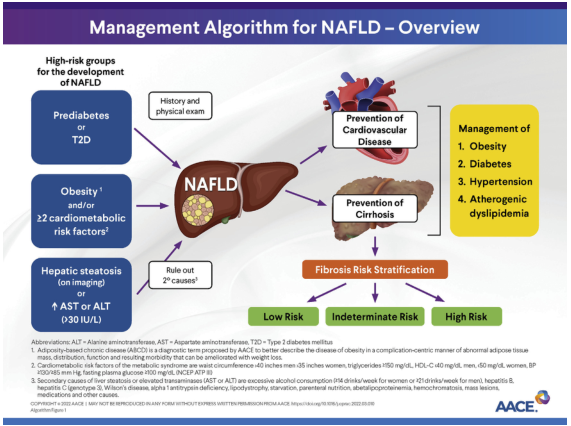
Summary : This flowchart presents an overview of the management algorithm for Nonalcoholic Fatty Liver Disease (NAFLD), highlighting high-risk groups, diagnostic steps, risk stratification, and management priorities. flowchart: # High-Risk Groups : • Prediabetes or T2D (rectangle) • Obesity¹ or ≥2 cardiometabolic risk factors² (rectangle) • Hepatic steatosis (on imaging) or ↑ AST or ALT (>30 IU/L) (rectangle) # Diagnostic Steps : • History and physical exam (arrow from high-risk groups to NAFLD) • Rule out 2° causes³ (rectangle, arrow from hepatic steatosis to this node) # Central Node : • NAFLD (liver illustration, central node) # Management Pathways : • Prevention of Cardiovascular Disease (rectangle, arrow from NAFLD) • Prevention of Cirrhosis (rectangle, arrow from NAFLD) • Management of: 1. Obesity 2. Diabetes 3. Hypertension 4. Atherogenic dyslipidemia (list, right side) # Fibrosis Risk Stratification : • Fibrosis Risk Stratification (rectangle, arrow from NAFLD) • Low Risk (green rectangle, arrow from stratification) • Indeterminate Risk (yellow rectangle, arrow from stratification) • High Risk (red rectangle, arrow from stratification) # Connectors : • Arrows connect high-risk groups to NAFLD via history/physical exam and diagnostic steps. • Arrows from NAFLD to prevention and management nodes. • Arrows from NAFLD to fibrosis risk stratification, then to risk categories. # Layout : • Left column: high-risk groups and diagnostic steps. • Center: NAFLD as the main node. • Right: management priorities and prevention. • Bottom: fibrosis risk stratification and risk categories. # Footnotes : • ¹ Adiposity-based chronic disease (ABCD) definition. • ² Cardiometabolic risk factors: waist circumference, triglycerides, HDL-C, BP, fasting glucose. • ³ Secondary causes: alcohol, hepatitis B/C, Wilson’s disease, etc. Analysis : • The algorithm emphasizes identifying high-risk individuals, confirming NAFLD, ruling out secondary causes, and stratifying fibrosis risk to guide management. • Management focuses on preventing cardiovascular disease and cirrhosis, and controlling obesity, diabetes, hypertension, and dyslipidemia. • The flowchart is linear with branching for risk stratification, supporting a stepwise clinical approach.
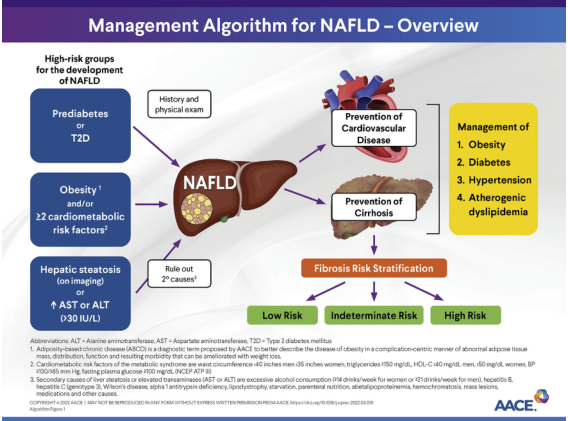
Summary : This flowchart presents the management algorithm for Nonalcoholic Fatty Liver Disease (NAFLD), highlighting risk groups, diagnostic steps, and management priorities. flowchart: # High-Risk Groups for NAFLD : • Prediabetes or Type 2 Diabetes (T2D) (rectangle) • Obesity (adiposity-based chronic disease) and/or ≥2 cardiometabolic risk factors (rectangle) • Hepatic steatosis (on imaging) or elevated AST or ALT (>30 IU/L) (rectangle) # Initial Assessment : • History and physical exam (rectangle) • Rule out secondary causes (rectangle) # Central Node : • NAFLD (liver illustration, central node) # Management Pathways : • Prevention of Cardiovascular Disease (rectangle, heart illustration) • Prevention of Cirrhosis (rectangle, cirrhotic liver illustration) • Management of: 1. Obesity 2. Diabetes 3. Hypertension 4. Atherogenic dyslipidemia (yellow box) # Fibrosis Risk Stratification : • Low Risk (green box) • Indeterminate Risk (yellow box) • High Risk (red box) # Connectors : • Arrows from high-risk group boxes to NAFLD central node. • Arrows from NAFLD to history/physical exam, rule out secondary causes, prevention of cardiovascular disease, prevention of cirrhosis, and management box. • Arrow from NAFLD to fibrosis risk stratification, which branches into low, indeterminate, and high risk. # Layout : • Flow is left-to-right and top-to-bottom, starting with risk groups, moving to NAFLD diagnosis, then branching to management and risk stratification. • Visual illustrations (liver, heart, cirrhotic liver) enhance key nodes. # Abbreviations & Footnotes : • ALT: Alanine aminotransferase; AST: Aspartate aminotransferase; T2D: Type 2 diabetes mellitus. • Footnotes clarify definitions for obesity, cardiometabolic risk factors, and secondary causes of liver enzyme elevation. # Analysis : • The algorithm emphasizes early identification of high-risk individuals, exclusion of secondary causes, and stratification by fibrosis risk. • Management focuses on metabolic comorbidities and prevention of cardiovascular and liver-related complications. • The flowchart visually organizes the stepwise approach to NAFLD care, integrating risk assessment and targeted interventions.
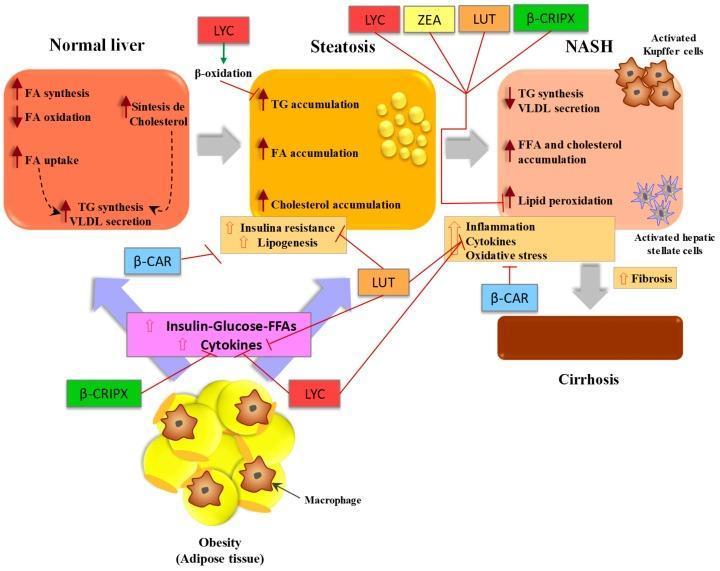
A pathophysiology diagram illustrating the progression of Non-Alcoholic Fatty Liver Disease (NAFLD) and the protective mechanisms of dietary carotenoids. The flow depicts the transition from a 'Normal Liver' to 'Steatosis' (characterized by triglyceride, fatty acid, and cholesterol accumulation), then to 'NASH' (Non-Alcoholic Steatohepatitis, marked by lipid peroxidation, activated Kupffer cells, and hepatic stellate cells), and finally to 'Cirrhosis' with advanced fibrosis. The diagram maps the systemic influence of obesity and adipose tissue, which contribute to increased insulin, glucose, free fatty acids (FFAs), and cytokines. Specific carotenoids are shown as therapeutic modulators: Lycopene (LYC) promotes beta-oxidation and inhibits inflammation; beta-carotene (beta-CAR) inhibits insulin resistance and the transition to cirrhosis; and Lutein (LUT), Zeaxanthin (ZEA), and beta-cryptoxanthin (beta-CRIPX) act as inhibitors of disease progression pathways between steatosis and NASH. Green arrows indicate promotion/increase, while red T-bars indicate inhibition or blocking of pathological pathways, emphasizing the antioxidant and anti-inflammatory roles of these nutrients in preventing hepatocyte damage and fibrosis.
Fatty Liver (MASLD/NAFLD) - Management
Nomenclature update (2023): The condition formerly called NAFLD/NASH is now officially renamed MASLD (Metabolic dysfunction-Associated Steatotic Liver Disease) and MASH (Metabolic dysfunction-Associated SteatoHepatitis). This reflects its close link to metabolic syndrome.
Disease Spectrum
- Isolated steatosis (IFL) progresses at ~0.07 fibrosis stages/year
- MASH progresses at ~0.14 stages/year (~1 stage per 7 years)
- ~11% of MASH patients progress to cirrhosis over 15-20 years
1. Diagnosis & Risk Stratification
- Ultrasound - first-line for hepatic steatosis
- FIB-4 score - preferred initial fibrosis risk stratification tool
- FIB-4 < 1.3 = low risk; FIB-4 1.3-2.67 = indeterminate; FIB-4 > 2.67 = high risk
- VCTE (FibroScan): 8-10 kPa = F2; 10-15 kPa = F3; >15 kPa = cirrhosis
- MR Elastography (MRE): 3.1-4.4 kPa = F2-F3
- ELF (Enhanced Liver Fibrosis test): 9.2-10.5 = F2-F3
- Liver biopsy - reserved for cases where NIT results are discordant or diagnosis is uncertain
2. Lifestyle Modification (CORNERSTONE for all stages)
Weight Loss
- 5% weight loss - reduces hepatic steatosis
- 7-10% weight loss - improves MASH histology (inflammation + ballooning)
- >10% weight loss - may improve fibrosis
- Rate: 0.5-1.0 kg/week; crash dieting/rapid weight loss can worsen disease
Diet
- Mediterranean diet - the most evidence-based dietary pattern for MASLD
- Reduce: fructose (especially high-fructose corn syrup), simple carbohydrates, saturated fats, processed foods, sugar-sweetened beverages
- Increase: fiber, olive oil, omega-3-rich fish, whole grains, vegetables
- Avoid alcohol entirely in patients with significant fibrosis
Physical Activity
- 150-200 min/week moderate-intensity aerobic exercise (e.g., brisk walking, cycling)
- Resistance training is also beneficial
- Exercise improves steatosis and insulin sensitivity even without weight loss
3. Management of Metabolic Comorbidities
| Comorbidity | Target / Approach |
|---|---|
| Obesity | 7-10% weight loss; consider pharmacotherapy/bariatric surgery |
| T2DM | HbA1c < 7%; prefer GLP-1 RA or SGLT2 inhibitors |
| Hypertension | BP < 130/80 mmHg |
| Dyslipidemia | Statins are safe and beneficial; lower LDL |
| Insulin Resistance | Addressed via weight loss + exercise |
4. Pharmacological Therapy
FDA-Approved Drugs (as of 2025-2026)
✅ Resmetirom (Rezdiffra) - approved March 2024
- Thyroid hormone receptor-beta (THR-β) agonist
- Indication: MASH with moderate-to-advanced fibrosis (F2-F3)
- Dose: 80 mg or 100 mg orally once daily (weight-based)
- MAESTRO-NASH trial: 24% MASH resolution without fibrosis worsening (vs 14.2% placebo); 26% achieved ≥1 stage fibrosis improvement (vs 14% placebo)
- Side effects: nausea, diarrhea, pruritis; drug interactions (CYP3A4)
✅ Semaglutide (Wegovy 2.4 mg/week) - FDA accelerated approval August 2025
- GLP-1 receptor agonist
- Indication: MASH with F2-F3 fibrosis
- ESSENCE trial (72 weeks): MASH resolution 62.9% vs 34.3% placebo (p<0.001); ≥1 stage fibrosis reduction 36.8% vs 22.4% (p<0.001)
- Patient selection: VCTE 8-15 kPa, MRE 3.1-4.4 kPa, or ELF 9.2-10.5
- Monitor: GI side effects (nausea, diarrhea, vomiting - usually transient), gallbladder disease, pancreatitis, renal function
- Final approval pending long-term outcomes data
- Per 2026 AASLD Practice Guidance, lifestyle modification remains the cornerstone even alongside semaglutide
Off-label/Other Pharmacological Options
| Drug | Evidence | Notes |
|---|---|---|
| Pioglitazone 30-45 mg/day | Improves MASH histology, possible fibrosis benefit | Side effects: weight gain, fluid retention, bone loss, bladder cancer risk; useful in T2DM |
| Vitamin E 800 IU/day | Improves MASH in non-diabetic patients; modest effect, no fibrosis benefit | Possible prostate cancer risk in men (long-term high dose); avoid in diabetics |
| SGLT2 inhibitors (empagliflozin, dapagliflozin) | Reduce steatosis and liver enzymes; emerging fibrosis data | Preferred if T2DM + MASLD |
| GLP-1 RA (liraglutide, dulaglutide) | Reduce steatosis; off-label for MASLD | Useful if obesity + T2DM |
| Obeticholic acid | Failed phase 3 (REGENERATE) - FDA declined approval 2023 | Not recommended |
5. Bariatric / Metabolic Surgery
- Considered for MASLD patients with obesity (BMI ≥35, or BMI ≥27 with comorbidities) unresponsive to lifestyle + medical therapy
- Can achieve sustained >25% weight loss and significant histologic improvement
- Roux-en-Y gastric bypass and sleeve gastrectomy both shown to reduce MASH and fibrosis
- Not recommended in decompensated cirrhosis
6. Management by Stage
| Stage | Priority |
|---|---|
| Simple steatosis (no MASH) | Lifestyle modification + metabolic risk factor control; reassess every 1-3 years |
| MASH (F0-F1) | Intensive lifestyle; consider pharmacotherapy if not responding |
| MASH with F2-F3 fibrosis | Pharmacotherapy (resmetirom or semaglutide) + lifestyle; refer hepatology |
| Compensated cirrhosis (F4) | 6-monthly HCC surveillance (ultrasound ± AFP); variceal screening; carvedilol for portal hypertension; avoid nephrotoxins/hepatotoxins |
| Decompensated cirrhosis | Liver transplant evaluation; manage complications (ascites, encephalopathy, varices) |
7. Cardiovascular Risk - A Key Priority
- Lipid-lowering therapy (statins are safe)
- BP control
- Glycemic management
- Smoking cessation
- Routine cardiovascular risk assessment
8. HCC Surveillance
- All cirrhotic MASLD patients - ultrasound ± AFP every 6 months
- Consider in non-cirrhotic advanced fibrosis (F3) based on individual risk
- HCC can rarely develop in MASH without cirrhosis
Key Recent Evidence
| Source | Key Finding |
|---|---|
| AASLD 2026 - Semaglutide (PMID 41201884) | Semaglutide 2.4 mg/week FDA-approved August 2025 for MASH F2-F3; 62.9% MASH resolution vs 34.3% placebo |
| ALEH 2025 Guidelines (PMID 40089151) | Mediterranean diet + 7-10% weight loss; resmetirom and incretins for MASH with fibrosis |
| AGA 2023 NIT Update (PMID 37542503) | FIB-4 preferred for initial stratification; VCTE/MRE/ELF for advanced assessment |
Summary Algorithm
- Identify - Steatosis on imaging or elevated ALT in high-risk patient (obesity, T2DM, metabolic syndrome)
- Rule out - Secondary causes (alcohol, viral hepatitis, drugs)
- Stratify - FIB-4 → if indeterminate/high, proceed to VCTE/MRE/ELF
- All patients - Lifestyle modification (Mediterranean diet, weight loss, exercise), control metabolic comorbidities
- MASH + F2-F3 - Add resmetirom or semaglutide; refer hepatology
- Cirrhosis - HCC surveillance, varices screening, transplant evaluation if decompensated