
Fever in detail
"fever" AND "pathophysiology" AND "management"
fever pathophysiology hypothalamus pyrogens cytokines mechanism diagram
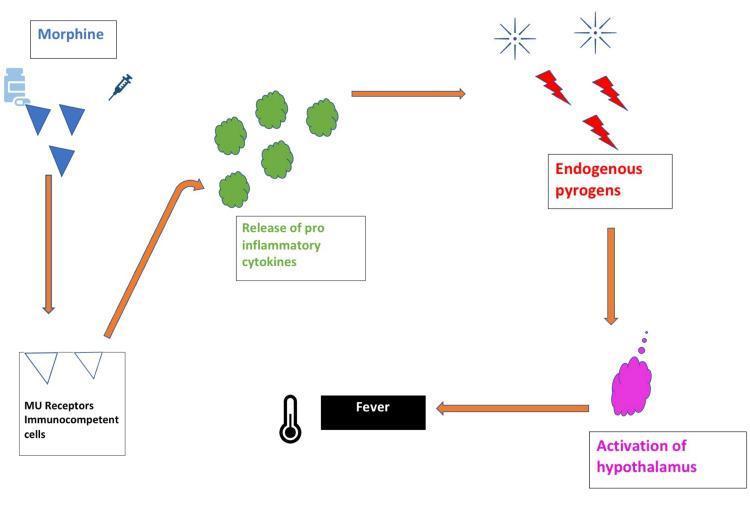
This pathophysiology diagram illustrates the biological mechanism of opioid-induced fever. The pathway is depicted as a series of steps connected by orange directional arrows. It begins with morphine (represented by blue triangles, a pill bottle, and a syringe icon) binding to Mu (μ) receptors on immunocompetent cells. This interaction triggers the release of pro-inflammatory cytokines, visualized as green spherical clusters. These cytokines promote the production of endogenous pyrogens, depicted by red lightning bolts and sunburst icons. The pyrogens act upon the central nervous system, specifically leading to the activation of the hypothalamus (shown as a purple anatomical cloud). The final physiological outcome is fever, symbolized by a black box labeled 'Fever' and a clinical thermometer icon. This schematic is designed for medical education to explain the rare adverse effect where opioids bypass typical thermoregulation to induce a febrile state via immune system mediation.
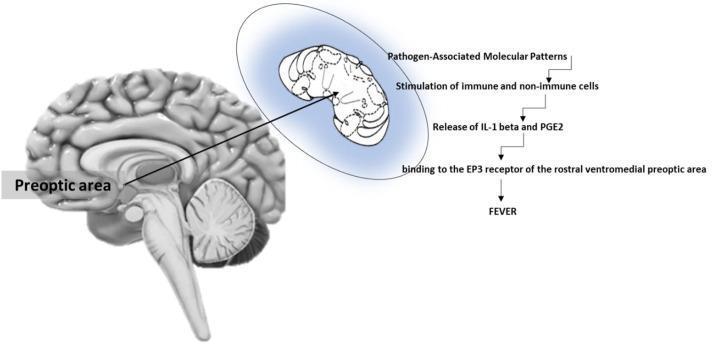
This medical illustration depicts the pathophysiology of fever induction at the brain level. On the left, a sagittal view of the human brain identifies the preoptic area (POA) within the hypothalamus, positioned anterior to the brainstem. An inset zoom highlights the rostral ventromedial preoptic area (rvmPOA) as the specific target for pyrogenic mediators. To the right, a sequential flowchart outlines the molecular mechanism: 1) Exposure to Pathogen-Associated Molecular Patterns (PAMPs); 2) Stimulation of immune and non-immune cells; 3) Release of pro-inflammatory cytokines, specifically Interleukin-1 beta (IL-1 beta), and Prostaglandin E2 (PGE2); 4) Binding of PGE2 to EP3 receptors in the rvmPOA. This signaling cascade leads to the clinical manifestation of fever. The diagram serves as an educational summary of the endocrine and neural pathways involved in thermoregulation and the systemic inflammatory response, highlighting the critical role of the hypothalamus and EP3 receptor signaling in pyrogenesis.
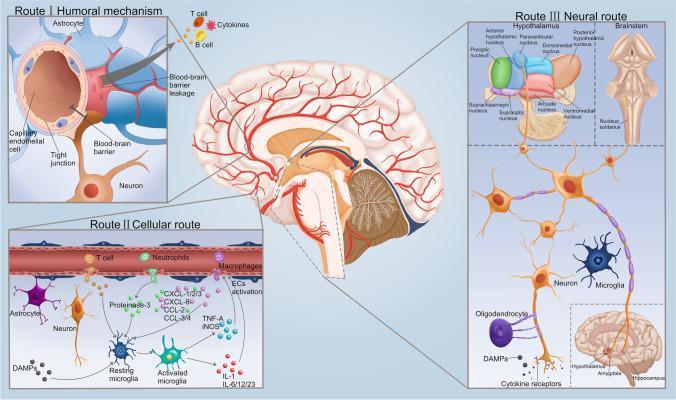
A medical pathophysiology diagram illustrating three primary routes by which cytokines and inflammatory signals enter the brain from the systemic circulation, specifically in the context of sepsis. Route I (Humoral mechanism) depicts the breakdown of the blood-brain barrier (BBB), showing capillary endothelial cells with disrupted tight junctions, allowing T cells, B cells, and cytokines to leak into the parenchyma near astrocytes and neurons. Route II (Cellular route) details the infiltration of peripheral immune cells, including neutrophils and macrophages, and the activation of cerebral endothelial cells (ECs). This section highlights the transition of resting microglia to activated microglia, mediated by DAMPs and proteinase-3, leading to the release of pro-inflammatory mediators such as TNF-alpha, iNOS, interleukins (IL-1, IL-6/12/23), and various chemokines (CXCL and CCL families). Route III (Neural route) illustrates the transmission of cytokine signals via autonomic nerve fibers and cytokine receptors, particularly affecting the hypothalamus, brainstem nuclei (nucleus solitarius), amygdala, and hippocampus. The central illustration provides anatomical context within a sagittal view of the human brain, mapping these pathways to specific neuroanatomical structures.
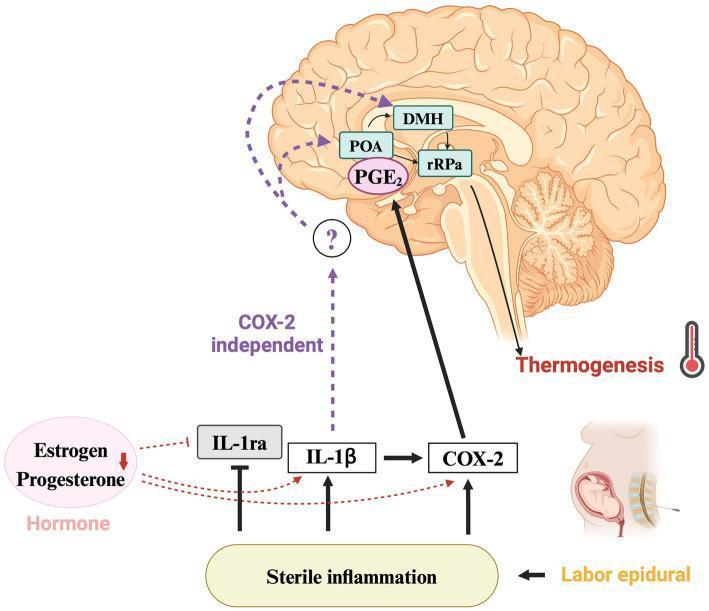
This pathophysiology diagram illustrates the thermoregulatory pathway implicated in epidural-related maternal fever (ERMF). The visual is divided into a molecular/hormonal section and a neuroanatomical section within a midsagittal view of the human brain. The lower portion depicts that 'Labor epidural' triggers 'Sterile inflammation,' which increases levels of IL-1̠ and COX-2 while suppressing the anti-inflammatory cytokine IL-1ra. Simultaneously, declining levels of estrogen and progesterone further inhibit IL-1ra and promote IL-1̠ and COX-2 expression. In the neuroanatomical section, the pathway shows PGE2 acting upon the preoptic area (POA), which then signals the dorsomedial hypothalamus (DMH). The DMH projects to the rostral raphe pallidus (rRPa) in the brainstem, ultimately leading to thermogenesis. A dashed line representing a COX-2 independent pathway from IL-1̠ to the hypothalamus is marked with a question mark, indicating a mechanism under investigation. This diagram serves as an educational tool for understanding the endocrine and immunological modulation of the central nervous system's febrile response during childbirth.
fever types patterns continuous remittent intermittent hectic chart
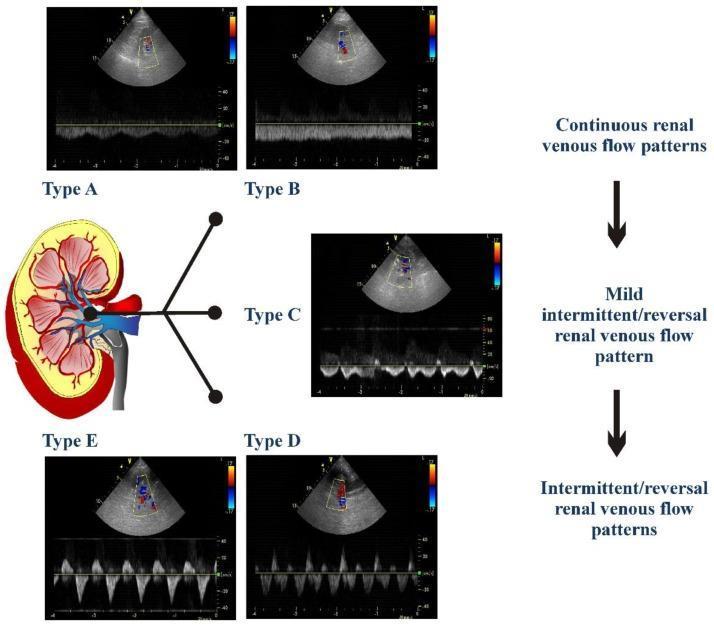
This diagnostic comparison chart illustrates five distinct renal venous Doppler flow patterns (Type A to Type E) used to assess renal congestion and cardiovascular health. The central anatomical diagram of a kidney highlights the segmental and interlobar veins where pulsed-wave Doppler measurements are obtained. The patterns are categorized into three clinical groups: 1) Continuous renal venous flow (Types A and B), which show biphasic or nearly constant forward flow; 2) Mild intermittent/reversal flow (Type C), characterized by short telediastolic interruptions or brief reversal waves; and 3) Intermittent/reversal flow patterns (Types D and E), which demonstrate progressive severity from biphasic interruptions to a monophasic intermittent pattern with prominent reversal waves. Each type includes a color Doppler ultrasound view of the kidney and a corresponding spectral Doppler waveform, mapping the transition from normal venous return to significant pulsatility and flow reversal associated with right-sided heart failure and elevated central venous pressure.
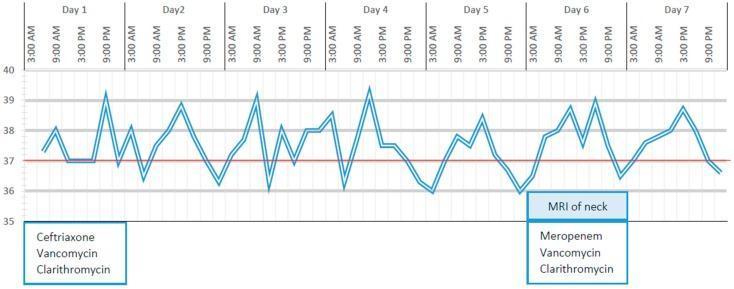
A clinical timeline chart documenting body temperature fluctuations and antibiotic therapy for a patient over the first 7 days of hospitalization. The upper section features a line graph representing core body temperature in degrees Celsius (ranging from 35°C to 40°C), with a red horizontal reference line at 37°C. The graph illustrates a spiking fever pattern (remittent or intermittent) with peaks reaching approximately 39.5°C and troughs dropping to 36°C. The x-axis is divided into 7 days, with sub-markers for 3:00 AM, 9:00 AM, 3:00 PM, and 9:00 PM. Below the graph, text boxes indicate pharmacological interventions and diagnostic imaging: Day 1 identifies the initiation of triple antibiotic therapy with Ceftriaxone, Vancomycin, and Clarithromycin. On Day 6, the regimen is modified, showing the replacement of Ceftriaxone with Meropenem, coinciding with a notation for a 'MRI of neck'. This clinical progression chart is used to visualize the relationship between diagnostic findings, therapeutic adjustments, and the patient's physiological response in a case of complex infection or inflammatory condition such as Kawasaki Disease.
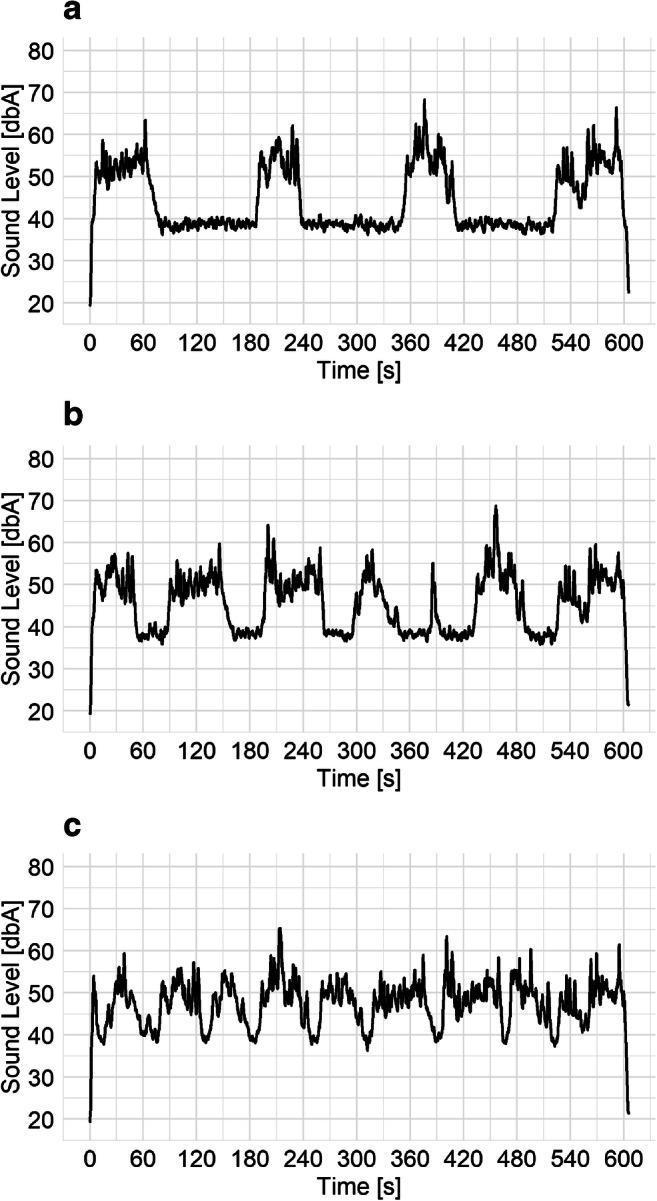
This Comparison Chart consists of three line graphs (a, b, and c) illustrating sound level variations over a 600-second (10-minute) duration, used in environmental health research to evaluate human noise annoyance and psychoacoustics. Each graph plots A-weighted sound levels (dBA) on the y-axis (20–80 dBA) against time on the x-axis. Graph (a) demonstrates intermittent sound patterns with a 50% proportion, showing distinct high-amplitude clusters reaching 60–70 dBA separated by stable baseline 'quiet' periods of 40 dBA. Graph (b) represents a 75% proportion, showing more frequent peaks with shorter intervals of background noise. Graph (c) illustrates a 100% continuous proportion, characterized by constant fluctuations between 40 and 65 dBA without stable baseline periods. The visual data is clinically relevant for studying auditory perception, environmental stressors, and the physiological impact of traffic-related noise. It specifically highlights the concepts of 'intermittency' and 'roughness' in sound stimuli, providing a basis for understanding how different temporal patterns of noise exposure influence subjective human annoyance levels and potential occupational or environmental health outcomes.
Fever - A Detailed Overview
Definition
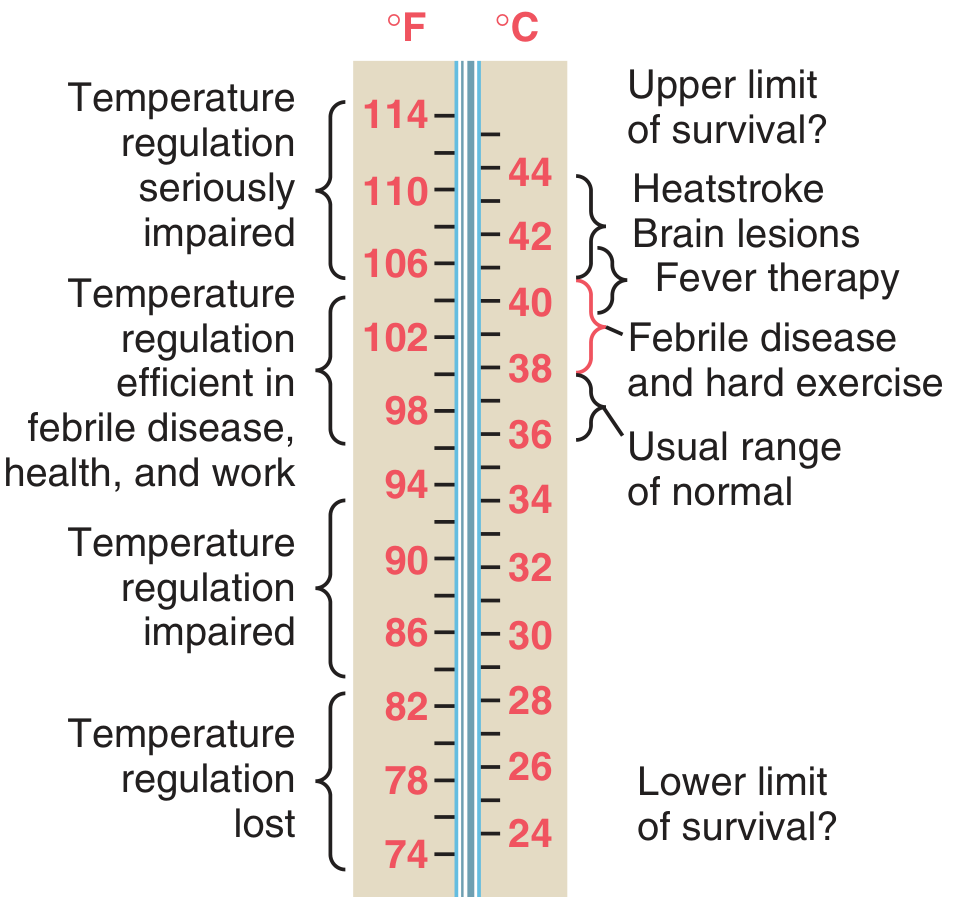
Body Temperature Reference Ranges
Pathophysiology
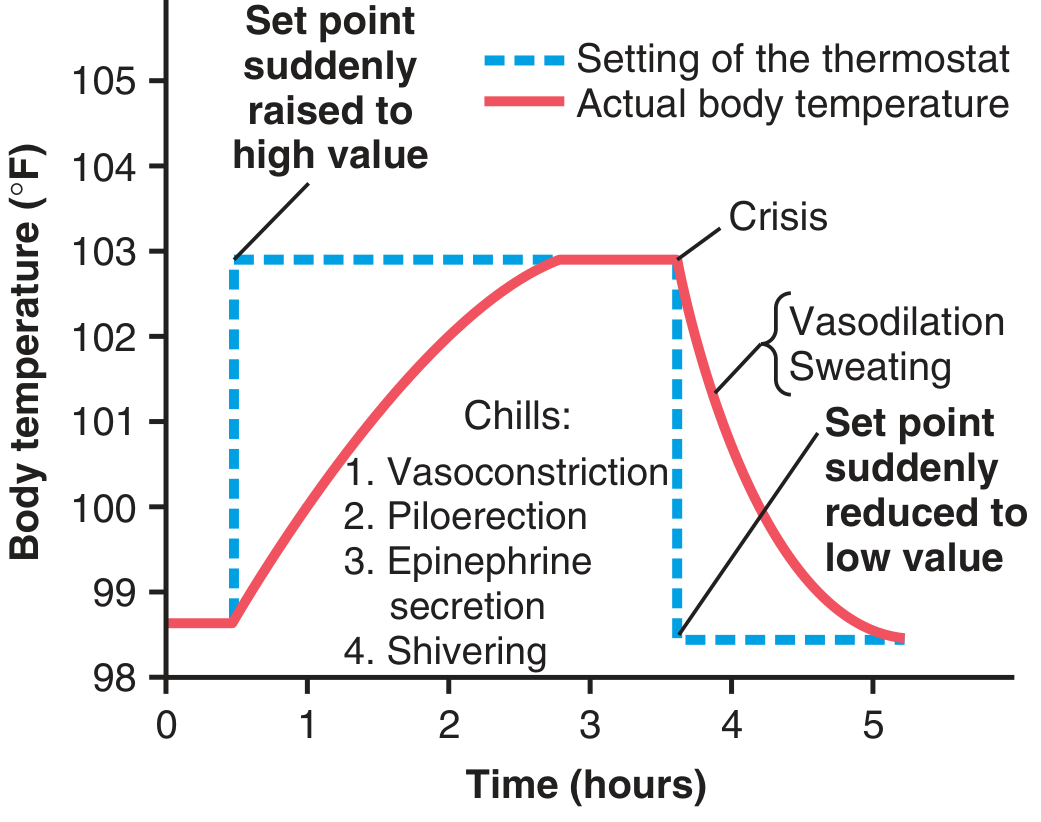
The Hypothalamic Thermostat
- If temperature is below the set point: vasoconstriction, shivering, piloerection, epinephrine secretion
- If temperature is above the set point: vasodilation, sweating
Pyrogens - The Fever Trigger
- Bacterial lipopolysaccharide (LPS / endotoxin) from gram-negative bacteria - the most potent
- Gram-positive bacterial cell wall products (peptidoglycan, lipoteichoic acid)
- Viral antigens
- Fungal polysaccharides
- Interleukin-1 (IL-1) - also called leukocyte pyrogen; the most important. Released from macrophages, leukocytes, and large granular killer lymphocytes after phagocytosis. As little as a few nanograms can cause fever within 8-10 minutes.
- IL-6, TNF-alpha (cachectin), IL-8, IFN-gamma
Molecular Cascade
Infection / Tissue damage
        ↓
Phagocytosis by macrophages, leukocytes, NK cells
        ↓
Release of endogenous pyrogens (IL-1, IL-6, TNF-α)
        ↓
Act on anterior hypothalamus (preoptic area / rvmPOA)
        ↓
↑ Local prostaglandin E2 (PGE2) synthesis via cyclooxygenase (COX)
        ↓
PGE2 binds EP3 receptors → ↑ cAMP in thermosensitive neurons
        ↓
Hypothalamic set point raised
        ↓
Heat conservation + heat production activated (chills, shivering)
        ↓
FEVER
Phases of Fever
Phase 1 - Chill (Rigor / Cold Stage)
- Peripheral vasoconstriction (pale, cold skin)
- Piloerection ("goosebumps")
- Shivering (muscle thermogenesis)
- Epinephrine secretion (increased metabolic rate)
- Patient feels intensely cold and shivery
Phase 2 - Fastigium (Hot / Sustained Stage)
- Feels hot and flushed
- Stops shivering
- Has warm, vasodilated skin
- Tachycardia (heart rate rises ~10 bpm per 1°C rise in temperature)
- Increased respiratory rate
Phase 3 - Crisis / Defervescence ("The Flush")
- Peripheral vasodilation (flushed, warm skin)
- Profuse sweating
- Temperature falls to normal
Types / Patterns of Fever
| Pattern | Description | Classic Cause |
|---|---|---|
| Continuous | Temperature stays elevated >38°C, daily variation <1°C | Lobar pneumonia, typhoid, UTI |
| Remittent | Elevated throughout, daily variation >1°C but never reaches normal | Most bacterial infections, infective endocarditis |
| Intermittent | Fever spikes with return to normal in between | Malaria, pyogenic abscess |
| Quotidian | Daily spike | P. vivax, P. ovale (48-hr cycle); drug fever |
| Tertian | Spike every 48 hrs | P. vivax / P. ovale |
| Quartan | Spike every 72 hrs | P. malariae |
| Hectic / Septic | Wide swings (>2°C), profuse sweating | Pyogenic abscess, septicemia |
| Relapsing / Undulant | Periods of fever alternating with afebrile periods | Brucellosis, Borrelia, Hodgkin's |
| Pel-Ebstein | Regular cycles of fever lasting days followed by afebrile days | Hodgkin's lymphoma |
| Saddle-back / Biphasic | Two separate fever peaks | Dengue, leptospirosis |
Causes of Fever
Infections (most common, ~50% of FUO cases)
- Bacterial: pneumonia, UTI, septicemia, tuberculosis, endocarditis, meningitis, typhoid
- Viral: influenza, COVID-19, EBV, CMV, HIV, dengue
- Fungal: histoplasmosis, candidiasis (esp. in immunocompromised)
- Parasitic: malaria, visceral leishmaniasis (kala-azar)
Inflammatory / Autoimmune (~15-20%)
- Rheumatoid arthritis, SLE, Still's disease (adult-onset)
- Vasculitides: giant cell arteritis, polyarteritis nodosa
- Inflammatory bowel disease
- Sarcoidosis
Malignancy (~15-20%)
- Lymphomas (Hodgkin's, non-Hodgkin's)
- Leukaemia
- Renal cell carcinoma ("internist's tumor")
- Hepatocellular carcinoma
- Solid tumors with necrosis
Other causes
- Drug fever - antibiotics (beta-lactams, sulphonamides), anticonvulsants, allopurinol, heparin
- Endocrine: thyroid storm, adrenal insufficiency (Addisonian crisis)
- CNS causes: hypothalamic lesions, hemorrhage, brain tumors
- Postoperative fever - the "Five Ws": Wind (atelectasis/pneumonia), Water (UTI), Wound infection, Walking (DVT), Wonder drugs (drug fever) (Tintinalli's Emergency Medicine)
- Transfusion reactions
- Factitious fever (self-induced)
- Malignant hyperthermia (triggered by inhalation anesthetics in susceptible individuals)
Fever of Unknown Origin (FUO)
- Temperature >38.3°C (101°F) on multiple occasions
- Duration >3 weeks
- No diagnosis after 3 days of in-hospital investigation or 3 outpatient visits
- Classic FUO - in an immunocompetent patient
- Nosocomial FUO - in a hospitalized patient
- Immune-deficient FUO - in HIV/AIDS or neutropenic patients
- Travel-associated FUO
- Infections: TB, endocarditis, occult abscess, CMV, EBV
- Malignancy: lymphoma, leukemia, renal cell carcinoma
- Non-infectious inflammatory: adult Still's disease, SLE, vasculitis
- Miscellaneous: drug fever, factitious fever, familial Mediterranean fever
- ~10-15% remain undiagnosed even after thorough workup
Clinical Features
- Elevated temperature (the cardinal sign)
- Tachycardia (pulse rises ~10 bpm per 1°C temperature increase)
- Tachypnea
- Diaphoresis (sweating)
- Chills and rigors
- Headache, malaise, myalgia, arthralgia
- Loss of appetite, nausea
- Dehydration
- In children: febrile convulsions (usually in ages 6 months-5 years, at temperatures >38.5°C)
- High fever (>40°C): confusion, delirium, hallucinations
- Inhibits bacterial and viral replication (many pathogens replicate poorly at elevated temperatures)
- Enhances neutrophil and lymphocyte activity
- Promotes acute-phase protein synthesis (CRP, fibrinogen)
- Stimulates cytokine production and immune response
Investigations
- Full blood count (FBC) - leukocytosis suggests infection; leukopenia in viral infections, typhoid
- ESR, CRP - markers of inflammation
- Blood cultures (ideally before antibiotics) - at least 2-3 sets
- Urine analysis and culture
- Chest X-ray
- Malaria smear / RDT / PCR (travel history)
- Liver function tests, serum LDH
- Blood film for parasites
- Sputum culture (if respiratory symptoms)
- Echocardiogram (if infective endocarditis suspected)
- CT scan abdomen/thorax (abscesses, lymphadenopathy)
- Bone marrow biopsy (haematological malignancy, TB, kala-azar)
- Autoimmune panel: ANA, anti-dsDNA, ANCA, rheumatoid factor
- Serology: EBV, CMV, hepatitis, HIV, Brucella, Q fever, Legionella urinary antigen
Management
Non-pharmacological
- Adequate hydration - fever significantly increases insensible water losses
- Nutritional support (especially with prolonged fever)
- Tepid sponging (physical cooling for very high temperatures)
- Fan therapy
- Rest
Pharmacological - Antipyretics
| Drug | Class | Dose (Adult) | Notes |
|---|---|---|---|
| Paracetamol (Acetaminophen) | Analgesic/antipyretic | 500-1000 mg q4-6h (max 4g/day) | First-line; safest; no anti-inflammatory effect; hepatotoxic in overdose |
| Ibuprofen | NSAID (COX-1/2 inhibitor) | 200-400 mg q6-8h | Anti-inflammatory + antipyretic; avoid in renal impairment, peptic ulcer |
| Aspirin | NSAID / salicylate | 300-600 mg q4-6h | Avoid in children <16 (Reye's syndrome risk); avoid in dengue (bleeding risk) |
| Naproxen | NSAID | 250-500 mg q12h | Longer-acting; good for inflammatory causes |
| Diclofenac | NSAID | 50 mg q8h | Available IV/IM for severe fever |
| Metamizole | Non-opioid analgesic | 500-1000 mg | Used in some countries; risk of agranulocytosis |
Treat the Underlying Cause
- Bacterial infections: appropriate antibiotics based on culture and sensitivity
- Malaria: antimalarials (chloroquine, artemisinin-based combination therapy)
- Autoimmune: corticosteroids, DMARDs
- Malignancy: specific oncological management
- Drug fever: discontinue the offending drug
When NOT to treat fever aggressively:
- Mild-moderate fever (38-39°C) in otherwise healthy adults may be beneficial (enhances immune response)
- Avoid antipyretics in dengue and viral hemorrhagic fevers with bleeding risk (use paracetamol only, avoid NSAIDs/aspirin)
Hyperthermia vs. Fever
| Feature | Fever | Hyperthermia |
|---|---|---|
| Mechanism | Raised hypothalamic set point | Heat gain exceeds heat loss; set point is normal |
| Cause | Pyrogens (infection, inflammation) | Heat stroke, malignant hyperthermia, serotonin syndrome, anticholinergic toxidrome |
| Response to antipyretics | Yes - effective | No - antipyretics do NOT work |
| Skin | Vasoconstricted initially (chills), then vasodilated | Usually vasodilated throughout |
| Treatment | Antipyretics + treat cause | Physical cooling is the mainstay |
Special Situations
Fever in the Surgical Patient (Postoperative)
- Wind (0-48 hrs): Atelectasis, pneumonia
- Water (2-5 days): UTI
- Wound (3-7 days): Surgical site infection
- Walking (4-7 days): Deep vein thrombosis
- Wonder drugs (any time): Drug fever, pseudomembranous colitis (C. difficile)
Fever in Children
- Febrile convulsions are common (2-5% of children) - usually benign, self-limiting
- Risk of serious bacterial infection (SBI) is higher in neonates/infants <3 months (any fever requires urgent evaluation)
- Paracetamol or ibuprofen (not aspirin) for symptomatic relief
Fever in the Immunocompromised
- Neutropenic fever (ANC <500/μL + temp >38.3°C): medical emergency - requires immediate broad-spectrum antibiotics
- HIV patients: consider opportunistic infections (PCP, cryptococcal meningitis, TB, MAC)
Fever in Pregnancy
- Fever can cause neural tube defects and preterm labor
- Paracetamol is the only safe antipyretic
- NSAIDs and aspirin should be avoided, especially in third trimester
Key Summary
- Fever = raised hypothalamic set point driven by pyrogens (exogenous or endogenous cytokines)
- Core mediator: IL-1 → PGE2 → hypothalamus reset
- Antipyretics work by COX inhibition → block PGE2
- Three phases: chill → fastigium → crisis (defervescence)
- Common causes: infections (most common), malignancy, autoimmune
- Distinguish fever from hyperthermia (different mechanism, different treatment)
- Always treat the underlying cause; antipyretics provide symptomatic relief only