
Eythropoesis
erythropoiesis stages red blood cell development bone marrow
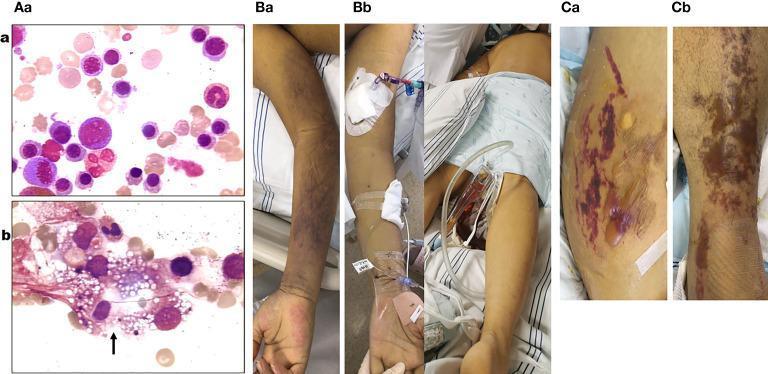
This composite medical image includes bone marrow smears and clinical photographs documenting the progression of a systemic illness, likely Parvovirus B19 infection. Diagnostic Images (Aa, Ab): Bone marrow smears (400x magnification) demonstrate a transition from hyperplastic marrow with active erythropoiesis (Aa) to a significant decrease in erythroblast density and maturation inhibition (Ab). Image Ab prominently displays a phagocytic cell containing numerous vacuoles and cellular debris (black arrow), indicative of hemophagocytic syndrome. Clinical Photographs (Ba-Cb): Serial photographs show evolving cutaneous manifestations. Initial findings (Ba, Bb) demonstrate blue-purple ecchymosis and diffuse mottling on the limbs and trunk. Later stages (Ca, Cb) reveal progressive purple-red ecchymotic lesions associated with the development of large, strained bullae filled with serous fluid on an erythematous base. The images illustrate the clinical and pathological manifestations of acute aplastic crisis and hemophagocytic lymphohistiocytosis (HLH) within the context of hematologic and infectious disease.
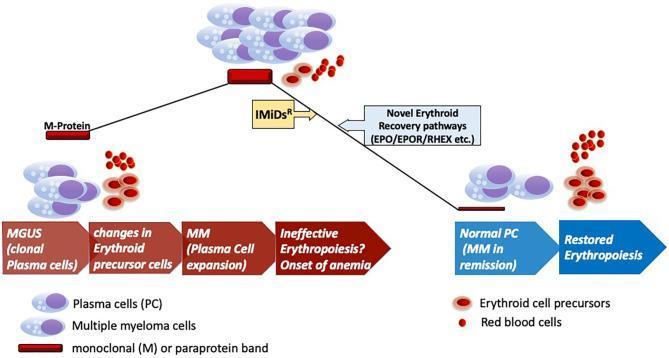
A pathophysiology diagram illustrating the disease progression of monoclonal gammopathy of undetermined significance (MGUS) to multiple myeloma (MM) and the subsequent impact on erythropoiesis. The visual follows a peak-like trajectory: the left side shows the progression from MGUS (clonal plasma cells) to MM (plasma cell expansion), characterized by a thickening M-protein band and increasingly ineffective erythropoiesis leading to anemia. At the peak, malignant multiple myeloma cells dominate the bone marrow environment alongside sparse red blood cells and erythroid precursors. The downward right slope depicts therapeutic intervention using immunomodulatory drugs (IMiDsR) and the engagement of novel erythroid recovery pathways involving EPO, EPOR, and RHEX. This phase represents MM in remission (Normal PC) and the clinical restoration of erythropoiesis, visualized by the return of mature red blood cells and normal erythroid precursor levels. Key components include plasma cells, monoclonal (M) paraprotein bands, and the sequential maturation stages of the erythroid lineage.
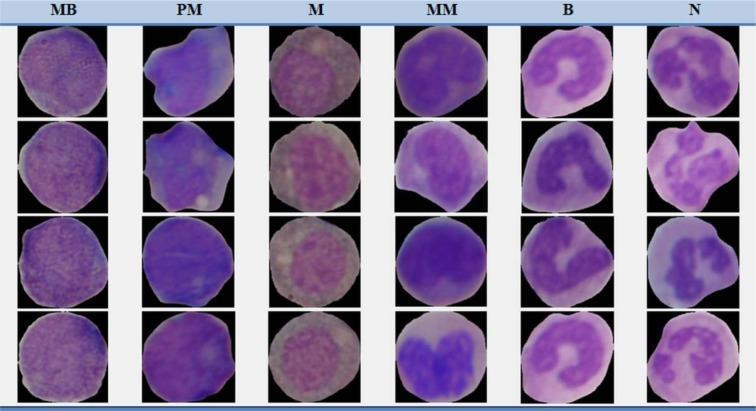
This composite diagnostic image displays a comparison chart of hematological cells from non-cancerous bone marrow aspirations, organized to show the maturation stages of the myeloid series. The visual consists of a grid with six columns, each representing a specific stage of development: Myeloblast (MB), Promyelocyte (PM), Myelocyte (M), Metamyelocyte (MM), Band (B), and Neutrophil (N). The cells are stained with Giemsa, revealing characteristic morphological changes in nuclear and cytoplasmic structure. Early stages (MB, PM) show large, round to oval nuclei with high nuclear-to-cytoplasmic (N:C) ratios and basophilic cytoplasm. As maturation progresses through the Myelocyte and Metamyelocyte stages, the nuclei become smaller and more indented. The Band (B) stage is characterized by an elongated, curved, non-segmented nucleus. The terminal stage, the Neutrophil (N), demonstrates distinct nuclear lobulation (typically 2-3 lobes) and increased cytoplasmic granularity. This image serves as an educational reference for identifying white blood cell precursors in the context of healthy hematopoiesis and chronic myelogenous leukemia (CML) classification.
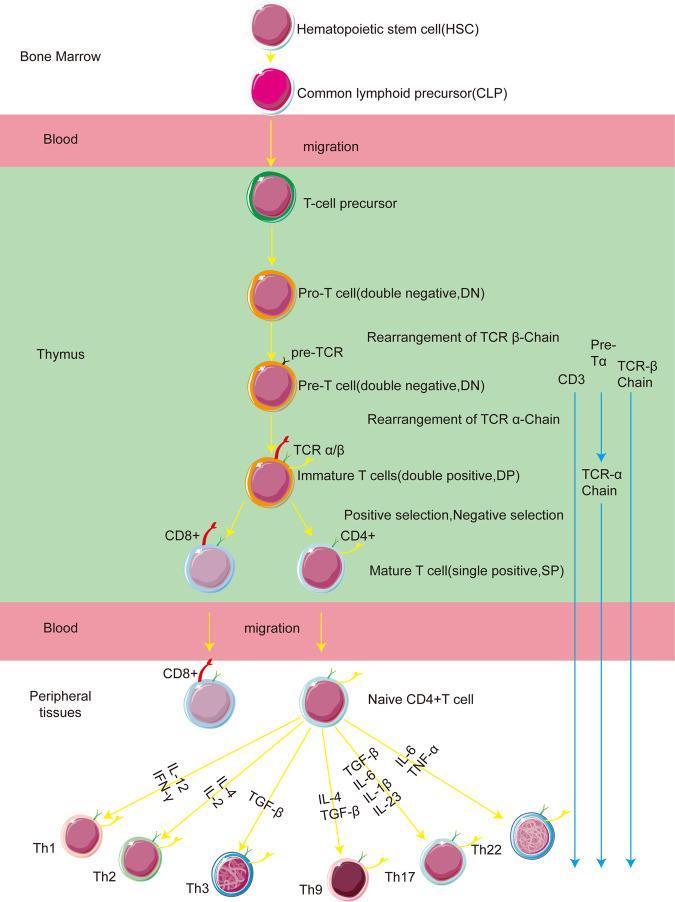
A pathophysiology diagram illustrating the stages of T-cell development and differentiation across anatomical compartments. The flow begins in the Bone Marrow with Hematopoietic Stem Cells (HSC) and Common Lymphoid Precursors (CLP), which migrate through the Blood to the Thymus. Within the thymus, the diagram details successive developmental stages: T-cell precursor, Pro-T cell (Double Negative, DN), Pre-T cell (DN), and Immature T cells (Double Positive, DP). Key molecular events are labeled, including TCR β-chain and α-chain rearrangements, pre-TCR formation, and positive/negative selection. The cells transition from DP to Mature T cells (Single Positive, SP), categorized as either CD8+ or CD4+. Following a second migration through the Blood to Peripheral Tissues, the Naive CD4+ T cell undergoes terminal differentiation. The diagram maps the cytokine-driven pathways (including IL-12, IFN-γ, IL-4, TGF-β, IL-6, IL-1β, IL-23, and TNF-α) that lead to specific T-helper (Th) cell subsets: Th1, Th2, Th3, Th9, Th17, and Th22. The visual uses color-coded spheres to represent maturing cells and directional arrows to denote cellular migration and lineage progression.
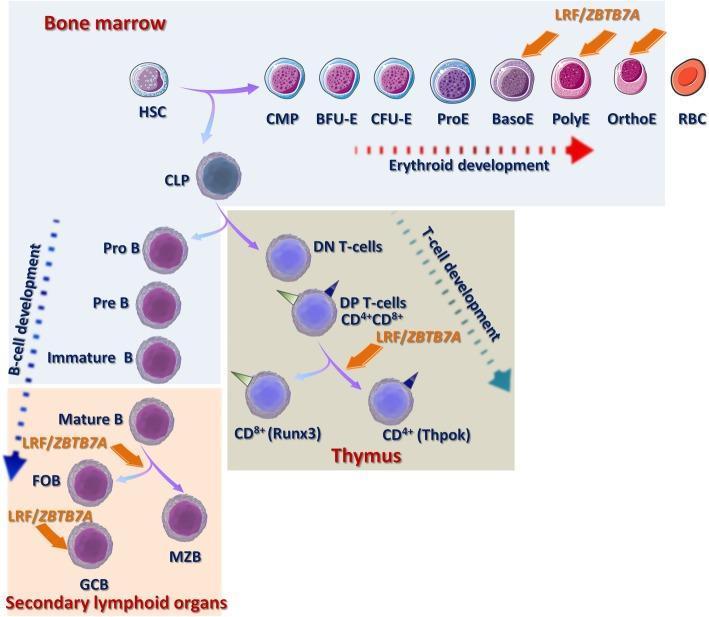
A pathophysiology diagram illustrating the role of the transcription factor LRF/ZBTB7A in human hematopoiesis, specifically in erythroid and lymphoid development. The diagram shows the differentiation of Hematopoietic Stem Cells (HSCs) into three main lineages. 1) Erythroid Development: Occurring in the bone marrow, the pathway progresses from CMP to BFU-E, CFU-E, and through erythroid precursors (ProE, BasoE, PolyE, OrthoE) to mature RBCs. LRF/ZBTB7A is shown regulating the terminal stages of erythropoiesis. 2) B-cell Development: Traces maturation from CLP through Pro-B, Pre-B, and Immature B cells in the bone marrow, continuing to Mature B cells in secondary lymphoid organs, where LRF/ZBTB7A facilitates differentiation into Follicular B cells (FOB) and Germinal Center B cells (GCB). 3) T-cell Development: Located in the thymus, it shows transitions from DN T-cells to DP T-cells (CD4+/CD8+). LRF/ZBTB7A is associated with the lineage choice between CD8+ (Runx3) and CD4+ (Thpok) T-cells. The visual emphasizes nuclear condensation and cytoplasm changes during erythroid maturation.
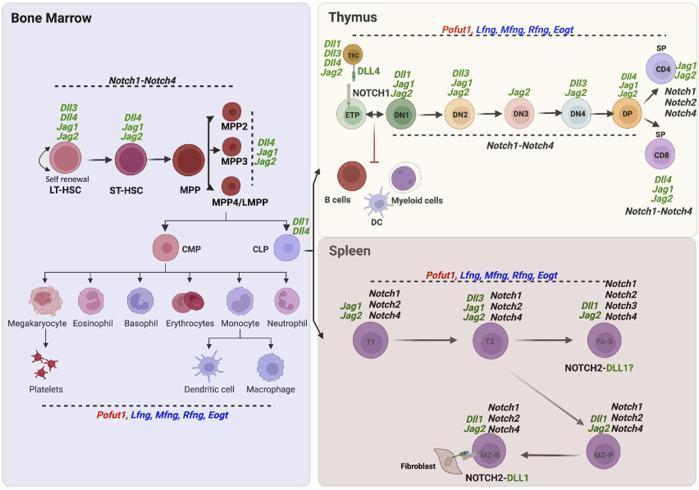
This medical educational diagram illustrates the hematopoietic cell development pathways across three primary compartments: bone marrow, thymus, and spleen, specifically focusing on the expression of Notch receptors, ligands, and glycosyltransferases. In the Bone Marrow, the lineage progresses from Long-Term Hematopoietic Stem Cells (LT-HSC) through Multipotent Progenitors (MPP) to Common Myeloid Progenitors (CMP) and Common Lymphoid Progenitors (CLP), giving rise to various blood cells like megakaryocytes and erythrocytes. The Thymus section depicts T-cell maturation from Early Thymic Progenitors (ETP) through Double-Negative (DN1-4) and Double-Positive (DP) stages to CD4+ and CD8+ Single-Positive (SP) cells. The Spleen section details B-cell differentiation from transitional stages (T1, T2) to Follicular (Fo-B) and Marginal Zone (MZ-B) B cells. Throughout these pathways, the diagram maps the specific involvement of Notch1-4 receptors and ligands (Dll1, Dll3, Dll4, Jag1, Jag2), alongside key O-glycan glycosyltransferases like Pofut1, Lfng, Mfng, Rfng, and Eogt, highlighting their regulatory roles in lymphopoiesis and myelopoiesis.
erythropoiesis EPO erythropoietin regulation stages proerythroblast reticulocyte
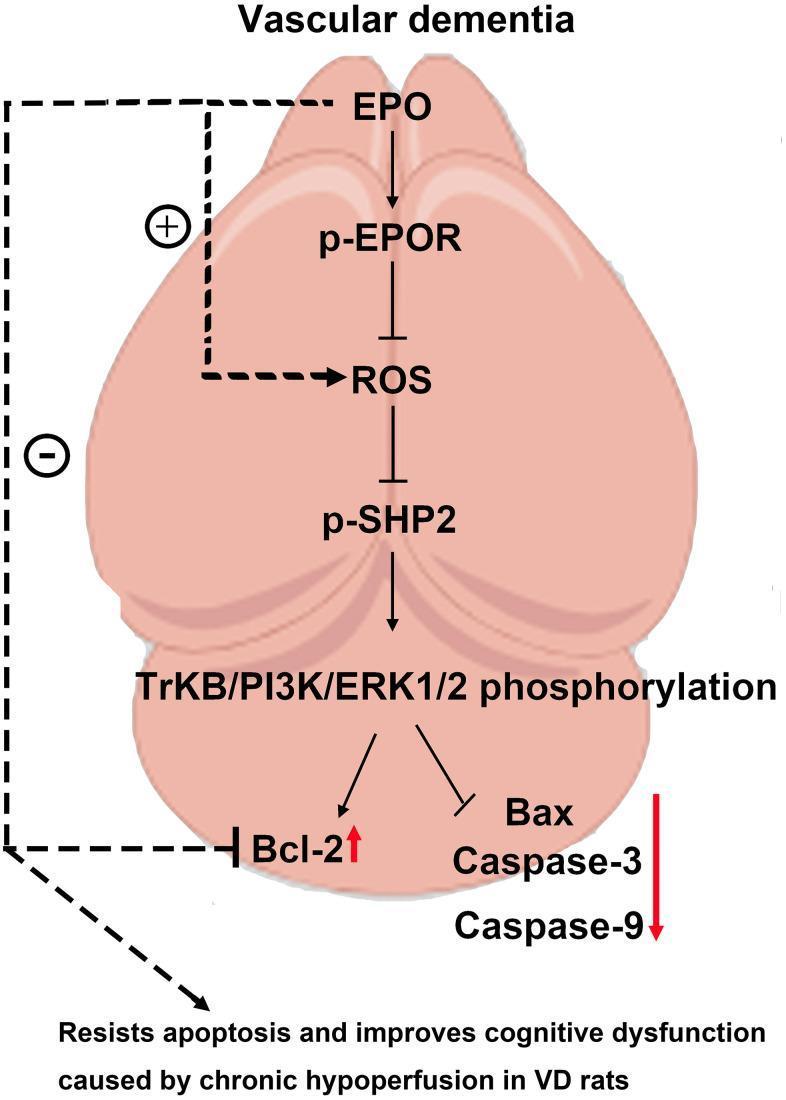
A pathophysiology diagram illustrating the molecular signaling pathway of Erythropoietin (EPO) in the context of vascular dementia (VD). The diagram is set against a stylized background of the brain, specifically the hippocampus. The pathway begins with EPO activating p-EPOR (phosphorylated erythropoietin receptor), which subsequently inhibits reactive oxygen species (ROS). The reduction in ROS leads to the activation of p-SHP2, which further triggers the phosphorylation of the BDNF/TrKB/PI3K/ERK1/2 axis. This signaling cascade results in downstream anti-apoptotic effects: an up-regulation of the anti-apoptotic protein Bcl-2 (indicated by a red upward arrow) and a down-regulation/inhibition of pro-apoptotic factors Bax, Caspase-3, and Caspase-9 (indicated by a red downward arrow). The final outcome of this mechanism is described as resisting apoptosis and improving cognitive dysfunction caused by chronic hypoperfusion. This visual resource is intended for educational purposes regarding neuroprotection and the therapeutic potential of EPO in neurodegenerative conditions.
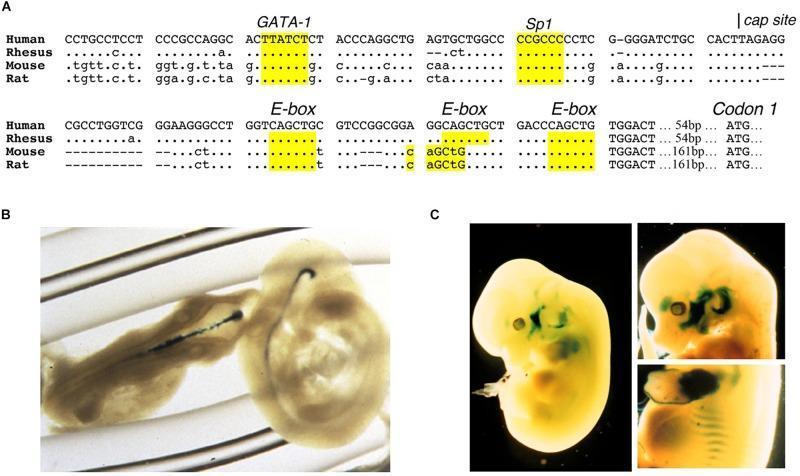
This composite educational graphic details the genetic regulation and spatial expression of the Erythropoietin Receptor (EPOR) gene during development. Panel A displays a genomic sequence alignment comparison between Human, Rhesus, Mouse, and Rat EPOR proximal promoter regions. It highlights conserved regulatory binding sites, including GATA-1, Sp1, and multiple E-box motifs, which are critical for erythroid and non-hematopoietic gene expression. Panels B and C present clinical laboratory photographs of transgenic mouse embryos using a beta-galactosidase reporter system (blue staining) to visualize EPOR promoter activity. Panel B shows expression in the developing embryonic brain at day E9.5. Panel C illustrates a broader expression pattern at embryonic days E12.5 and E13.5, with prominent staining in the visceral (branchial) arches, the bases of the developing forelimbs and hindlimbs, the intercostal rib regions (showing a characteristic striped pattern), and the fetal liver. This image demonstrates that while EPOR is vital for erythropoiesis, its expression is also localized in neural and musculoskeletal tissues during gestation.
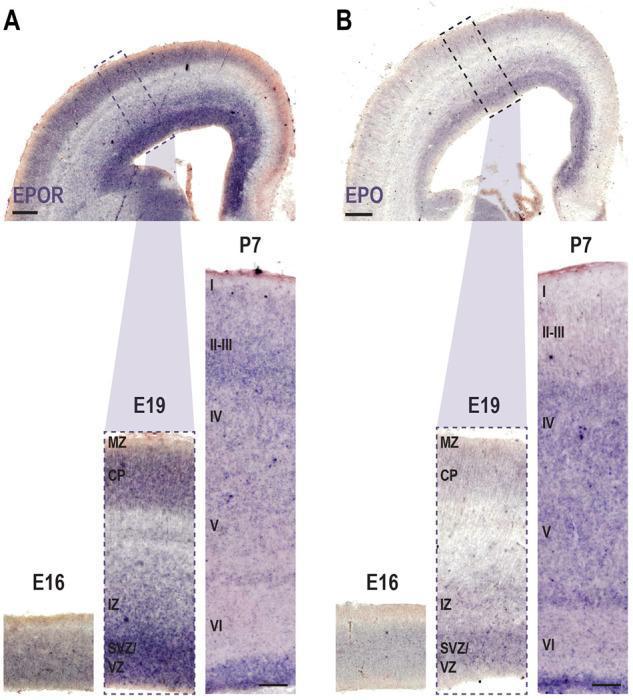
This diagnostic image illustrates the spatial and temporal expression patterns of Erythropoietin (EPO) and its receptor (EPOR) in the developing mammalian (rat) somatosensory cortex using in situ hybridization (ISH). The panels are divided into EPOR (A) and EPO (B) across three developmental stages: Embryonic day 16 (E16), E19, and Postnatal day 7 (P7). At E16, both transcripts show generalized expression, except in the marginal zone (MZ). By E19, a more differentiated laminar pattern emerges; EPOR and EPO labeling is concentrated in the ventricular zone (VZ), subventricular zone (SVZ), lower intermediate zone (IZ), and cortical plate (CP). At P7, coronal sections and high-magnification cortical columns demonstrate layer-specific distribution. EPOR is prominently expressed in the upper cortical layers and proximal to the ventricle, whereas EPO transcript peaks in deep layers (V-VI) and the periventricular area. These images highlight the regulatory role of EPO signaling during radial neuronal migration and the formation of the barrel cortex. Labels identify anatomical zones (MZ, CP, IZ, SVZ, VZ) and postnatal cortical layers (I-VI).
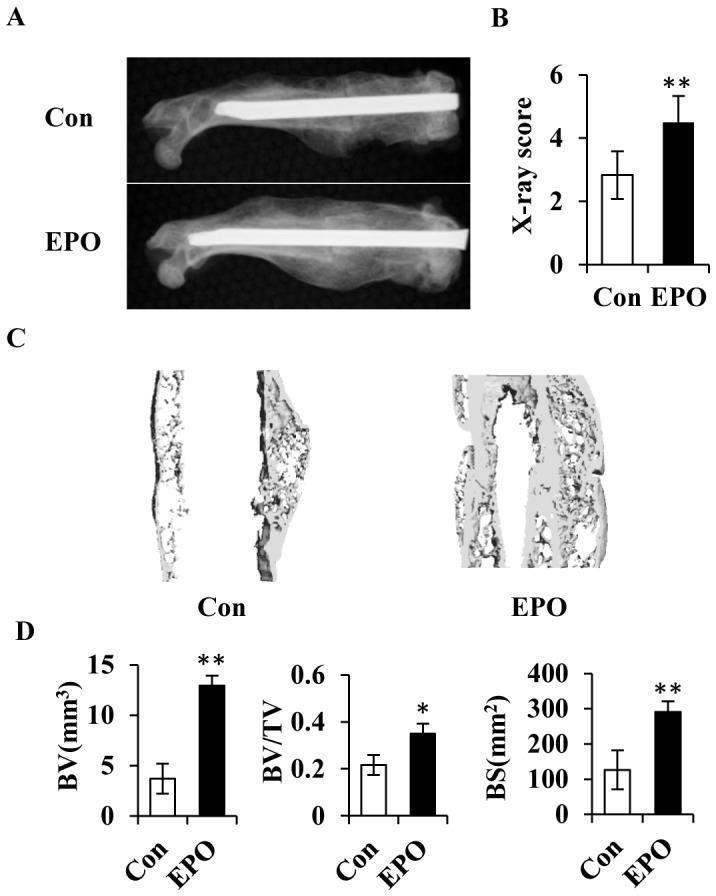
Educational panel illustrating the effect of Erythropoietin (EPO) on bone fracture healing at day 28 post-surgery in a femur model. (A) Radiological Comparison: Lateral X-rays of the femur showing a control (Con) group and an EPO-treated group. The EPO-treated femur demonstrates a more robust, radiopaque bony callus at the fracture site compared to the control. (B) Bar Graph: Quantitative X-ray scores indicating a significantly higher healing score for the EPO group (p < 0.01). (C) Micro-CT Analysis: 3D micro-computed tomography reconstructions of the new bone regenerates. The EPO images show increased bone bridging, greater spatial distribution of mineralized tissue, and a more complex trabecular network than the control. (D) Quantitative Histomorphometry: Three bar graphs showing significant increases (p < 0.05 or p < 0.01) in bone microstructure parameters for the EPO group, including bone volume (BV), bone volume/total volume (BV/TV), and bone surface (BS). The content demonstrates EPO's role as a pro-osteogenic factor in enhancing bone consolidation and mineral density during orthopedic repair.
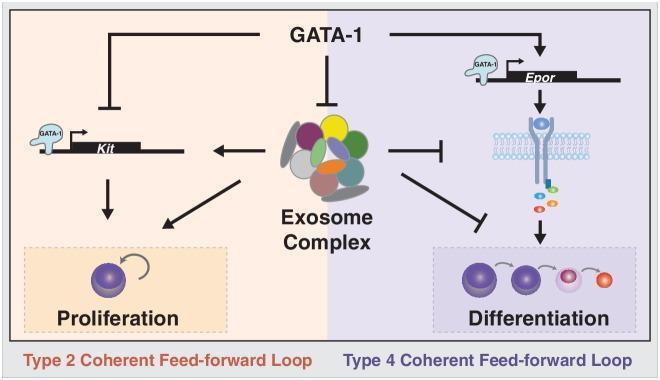
This pathophysiology diagram illustrates the regulatory signaling pathways governing the balance between erythroid precursor proliferation and differentiation. The visual is divided into two thematic sections: a peach-colored 'Proliferation' panel on the left and a light purple 'Differentiation' panel on the right. Centrally, GATA-1 acts as a master regulator. On the proliferation side, GATA-1 inhibits the expression of Kit, while the Exosome Complex positively influences Kit transcription, maintaining a 'Type 2 Coherent Feed-forward Loop' for self-renewal. On the differentiation side, GATA-1 promotes the expression of EpoR (Erythropoietin Receptor), which activates downstream signaling to drive erythroid maturation. The Exosome Complex is shown to inhibit differentiation and EpoR signaling; however, GATA-1 also represses the Exosome Complex subunits, thereby lifting this inhibition to facilitate maturation. This 'Type 4 Coherent Feed-forward Loop' orchestrates the developmental switch from SCF-induced Kit signaling to pro-differentiation Epo signaling during erythropoiesis.
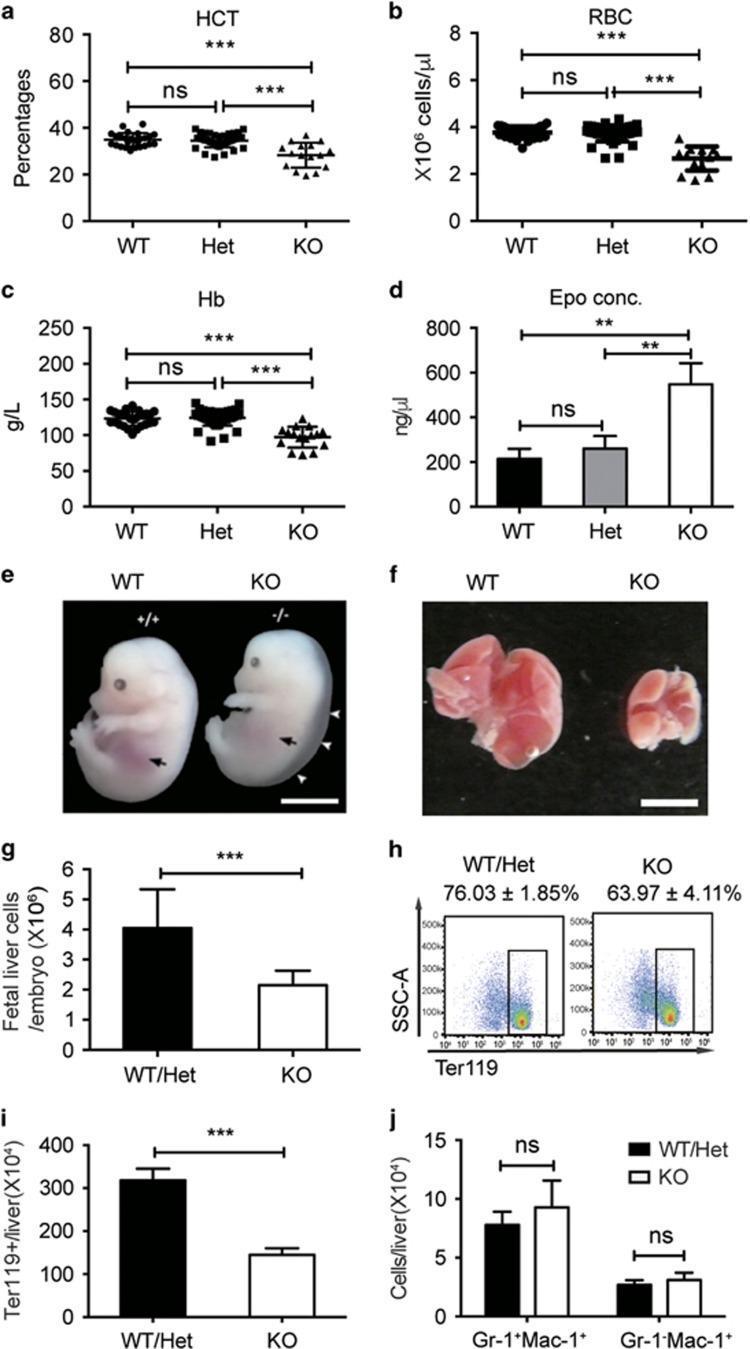
This composite educational image illustrates the hematopoietic and morphological effects of Stk40 knockout (KO) in mouse embryos. (a-d) Scatter and bar graphs display hematological indices: the KO group shows a significant reduction in hematocrit (HCT), red blood cell (RBC) count, and hemoglobin (Hb) concentration, while erythropoietin (Epo) levels are significantly elevated compared to wild-type (WT) and heterozygous (Het) controls. (e) Comparative clinical photographs of E14.5 embryos show that the Stk40 KO embryo exhibits severe subcutaneous edema (white arrowheads) and a diminished fetal liver shadow (black arrows) relative to the WT. (f) Macroscopic images of harvested fetal livers demonstrate marked hypoplasia in the KO liver compared to the WT. (g-j) Quantitative analysis and flow cytometry data show a decrease in total fetal liver cellularity and absolute numbers of Ter119+ erythroid cells in KO embryos, indicating impaired definitive erythropoiesis. Collectively, the data demonstrate that Stk40 deficiency leads to fetal anemia, edema, and hepatic hematopoietic defects.
Erythropoiesis
1. Sites of Erythropoiesis
| Life Stage | Primary Site |
|---|---|
| Early embryo (up to 6 weeks) | Yolk sac (primitive erythropoiesis) |
| Fetal life (6 weeks - birth) | Liver, then spleen |
| Adults | Red bone marrow (vertebrae, ribs, sternum, pelvis, proximal long bones) |
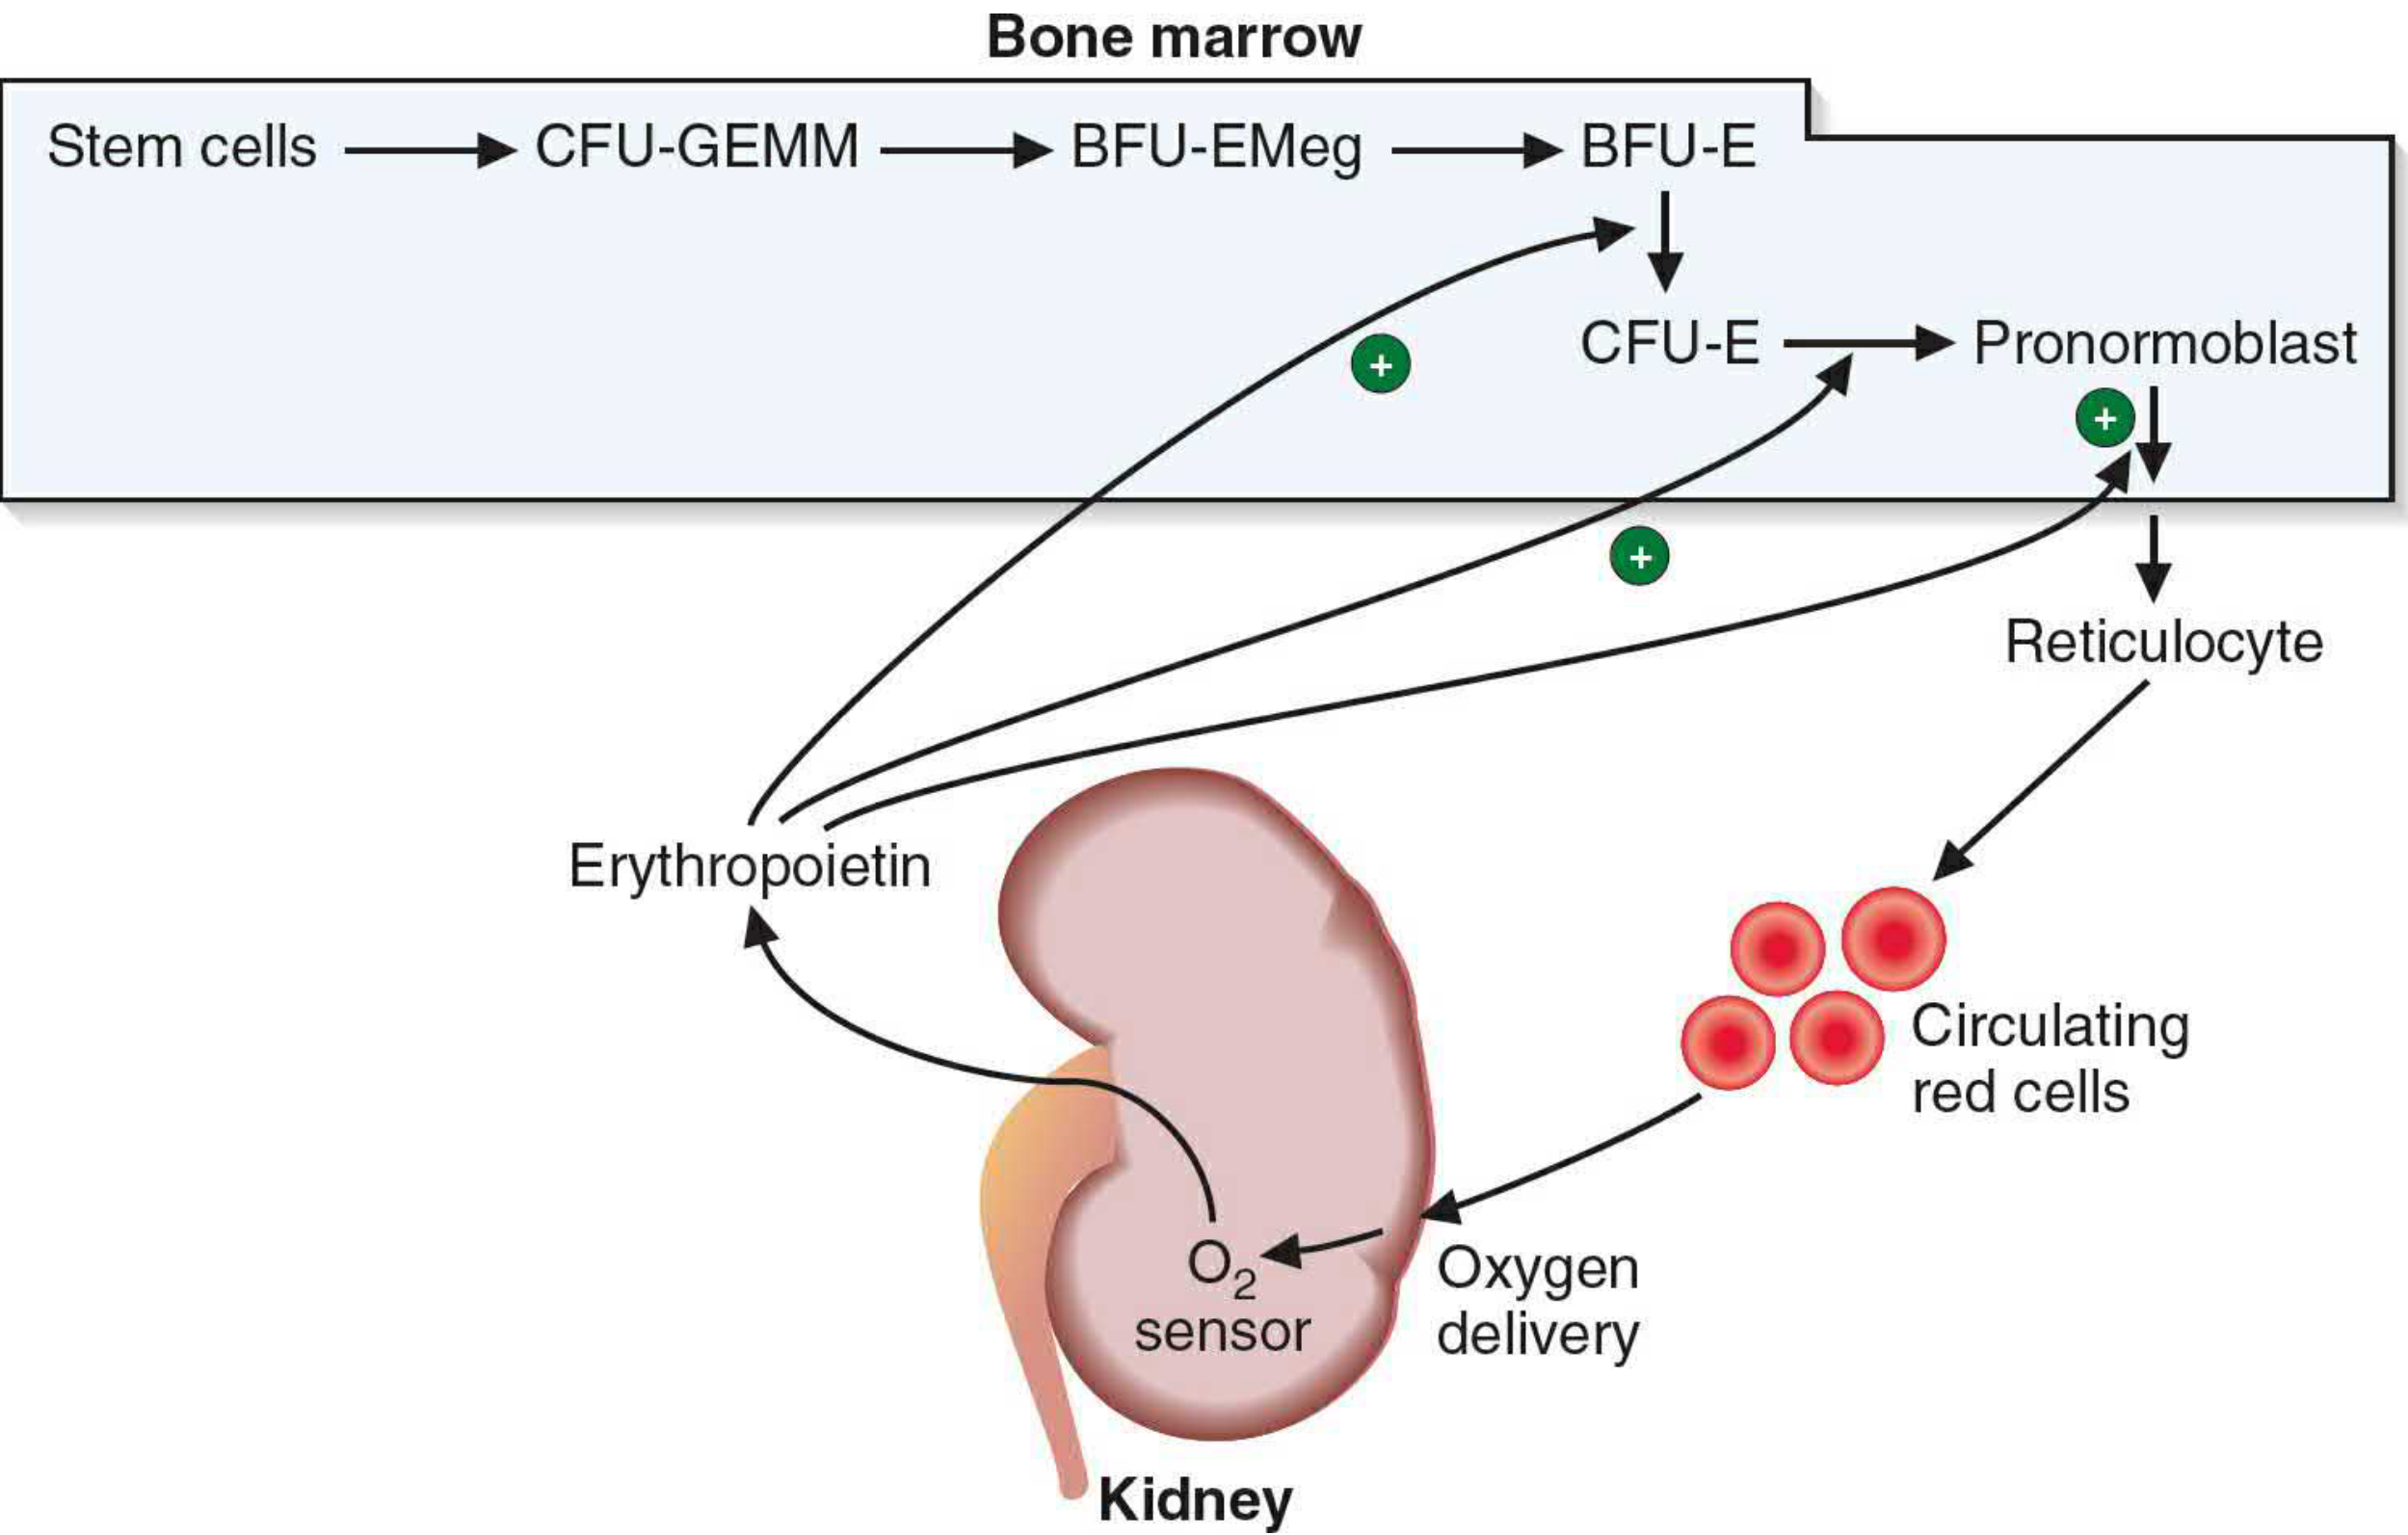
2. Stages of Erythroid Development
Progenitor (Non-morphologically distinct) Stages
Pluripotent Hematopoietic Stem Cell (HSC)
↓
Common Myeloid Progenitor (CMP / CFU-GEMM)
↓
BFU-EMeg (Burst-Forming Unit - Erythroid/Megakaryocyte)
↓
BFU-E (Burst-Forming Unit - Erythroid) ← EPO acts here
↓
CFU-E (Colony-Forming Unit - Erythroid) ← EPO acts here (strongly)
Morphologically Recognizable (Erythroblast) Stages
| Stage | Key Features | Division Capable? |
|---|---|---|
| Proerythroblast (Pronormoblast) | Largest cell; large nucleus with nucleoli; basophilic cytoplasm; NO hemoglobin | Yes |
| Basophilic Erythroblast | Smaller; nucleoli absent; deeply basophilic cytoplasm from ribosomes; Hb synthesis begins | Yes |
| Polychromatophilic Erythroblast | Hb accumulates; cytoplasm stains blue-gray (mixed basophilia + eosinophilia); nucleus smaller & condensed | Yes (last stage to divide) |
| Orthochromatic Erythroblast (Normoblast) | Nucleus very small & densely pyknotic; cytoplasm predominantly eosinophilic (pink); near mature RBC size | No |
| Reticulocyte | Nucleus extruded; residual ribosomes + mRNA present (still synthesizes Hb); slight basophilia; released into circulation | No |
| Mature Erythrocyte | Biconcave disc; no nucleus, no organelles; pure eosinophilic | No |
3. Key Cellular Changes During Maturation
- Cell size: progressively decreases
- Nucleus: progressively smaller, chromatin condenses, ultimately extruded at normoblast stage
- Cytoplasm: shifts from basophilic (ribosomes) → polychromatic → eosinophilic (hemoglobin)
- Hemoglobin synthesis: begins at the basophilic erythroblast stage, peaks at polychromatophilic stage
- Nuclear-to-cytoplasmic ratio: decreases with each division
4. Regulation by Erythropoietin (EPO)
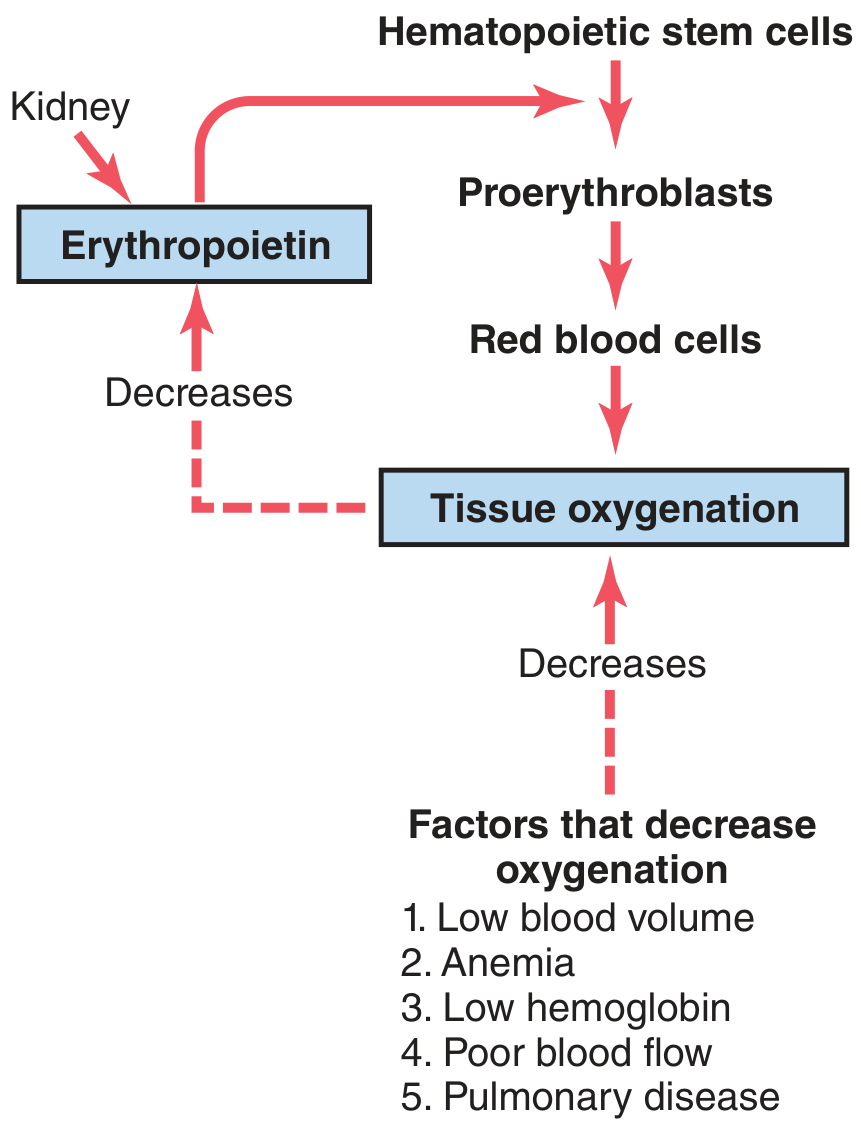
- Hypoxia stabilizes the transcription factor HIF-1α (hypoxia-inducible factor-1α)
- HIF-1α binds to the hypoxia response element (HRE) in the EPO gene promoter
- This drives transcription and synthesis of EPO
- ~90% from the kidneys (fibroblast-like interstitial cells in the renal cortex/outer medulla surrounding peritubular capillaries)
- ~10% from the liver
- Stimulates CFU-E and BFU-E progenitors to proliferate
- Drives proerythroblast formation from hematopoietic stem cells
- Accelerates maturation through the erythroblast stages
- Prevents apoptosis of erythroid precursors
- Low blood volume
- Anemia
- Low hemoglobin
- Poor blood flow
- Pulmonary disease
- High altitude
5. The Reticulocyte
- The reticulocyte is the polychromatophilic erythrocyte - a red cell that has just extruded its nucleus
- It still contains ribosomes, remnants of Golgi, and mitochondria
- With special stains (e.g., new methylene blue), residual ribosomes clump to form a visible reticular network - hence the name
- Reticulocytes circulate for 1-2 days, then mature in the spleen where ribosomes/mRNA are lost
- Normal reticulocyte count: <1% of circulating RBCs
- Elevated reticulocyte count = sign of active bone marrow erythropoiesis (e.g., hemolytic anemia, hemorrhage)
6. RBC Lifespan and Destruction
- Mature erythrocytes live approximately 120 days
- Senescent RBCs are phagocytosed by macrophages in the spleen, bone marrow, and liver (the mononuclear phagocyte system)
- Heme is broken down: iron is recycled to the storage pool (ferritin/hemosiderin), the porphyrin ring is degraded to bilirubin → conjugated in the liver → excreted in bile
- Globin chains are hydrolyzed to amino acids and recycled
7. Nutritional Requirements for Erythropoiesis
| Nutrient | Role |
|---|---|
| Iron (Fe²⁺) | Essential for heme synthesis; deficiency causes microcytic hypochromic anemia |
| Vitamin B12 | Required for DNA synthesis (thymidine synthesis); deficiency causes megaloblastic anemia |
| Folate (B9) | Required for DNA synthesis; deficiency causes megaloblastic anemia |
| Vitamin B6 | Co-factor in heme synthesis |
| Copper | Required for iron mobilization |
| Vitamin C | Enhances iron absorption |
| Erythropoietin | Hormonal driver (see above) |
8. Quick Summary Diagram
HSC → CFU-GEMM → BFU-E → CFU-E
↓ (EPO acts strongly here)
Proerythroblast (pronormoblast)
↓ (4 mitotic divisions)
Basophilic erythroblast
↓ (Hb synthesis begins)
Polychromatophilic erythroblast
↓ (last mitosis)
Orthochromatic erythroblast (normoblast)
↓ (nucleus extruded)
Reticulocyte → released into blood
↓ (1-2 days in circulation)
Mature erythrocyte (RBC)
↓ (120 days lifespan)
Destruction by macrophages → iron recycled
Anemia
anemia classification microcytic normocytic macrocytic blood smear peripheral
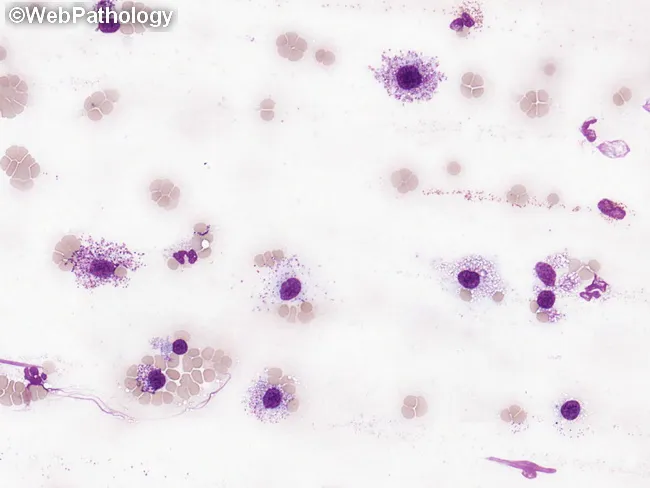
This peripheral blood smear was prepared and stained with Wright-Giemsa and examined by bright-field light microscopy to assess circulating hematopoietic cells in suspected systemic mastocytosis (SM). The smear shows rare, but conspicuous, mast cells with round to polygonal shapes and abundant cytoplasmic granules that impart a deep purple, metachromatic appearance. Nuclei are generally round to ovoid and may be slightly irregular or bilobed in some cells; granules occupy most of the cytoplasm and may obscure nuclear detail. The surrounding leukocytes include eosinophils and neutrophils, and the erythrocyte background is normocytic with occasional anisocytosis. In SM, circulating mast cells are typically infrequent; when they constitute a substantial fraction of leukocytes (≥10%), the finding is highly suggestive of mast cell leukemia (MCL). The image exemplifies an increased mast cell burden consistent with aggressive SM or MCL, often accompanied by cytopenias such as anemia or thrombocytopenia and potential associated hematologic neoplasms (e.g., CMML, MDS/MPN). This morphologic snapshot supports integration with phenotypic assays (CD117/c-KIT), flow cytometry, and molecular testing for KIT mutations, to establish diagnosis, prognostication, and therapeutic planning. Relevant keywords: systemic mastocytosis, mast cell leukemia, circulating mast cells, metachromatic granules, Wright-Giemsa, toluidine blue, KIT D816V, CD117, SM-AHN. This description emphasizes morphology guiding diagnosis appropriately.
This image depicts a peripheral blood smear prepared with Wright-Giemsa stain and examined under light microscopy at high magnification. The predominant features are small, mature-appearing lymphocytes with scant cytoplasm and discrete basophilic nuclei interspersed among erythrocytes. A characteristic subset of circulating lymphocytes displays short, polarity-restricted cytoplasmic villi (finger-like projections) consistent with splenic marginal zone lymphoma (SMZL) involvement of peripheral blood. The villi are typically slender and localized to one pole of the cell, unlike the longer, circumferential villous extensions seen in hairy cell leukemia, which aids in differential diagnosis. Some lymphocytes appear slightly irregular or irregular nuclear contours; occasional larger atypical cells may be present but are less common. The background shows normocytic red cells with normal distribution; platelets are not prominent. This cytomorphology supports SMZL in the context of known splenomegaly or lymphoproliferative disease and is often corroborated by immunophenotyping and molecular studies. Clinically, peripheral blood involvement occurs in roughly half to two-thirds of SMZL cases and helps establish disease burden. The image illustrates the diagnostic utility of meticulous peripheral smear review for small-vessel lymphocytosis and villous lymphocytes, informing differential diagnoses, guiding flow cytometry panels, and contributing to monitoring and prognosis.
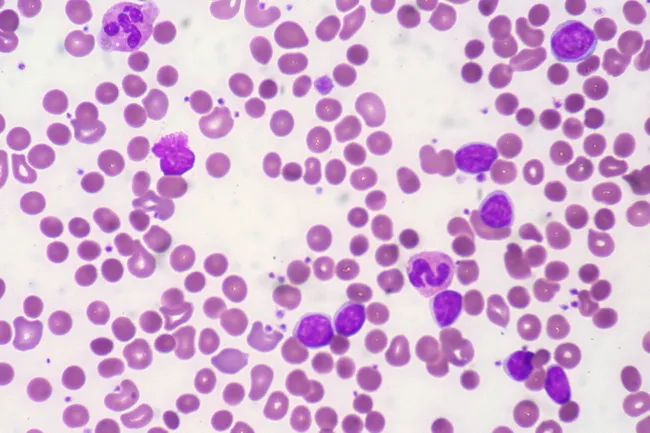
Peripheral blood smear from a patient with known chronic lymphocytic leukemia (CLL) showing autoimmune hemolytic anemia (AIHA). Brightfield microscopy of Wright-Giemsa stained smear at 1000x (oil immersion) reveals two dominant cell populations: numerous small mature lymphocytes typical of CLL and red blood cells showing spherocytic deformation. A smudge cell is evident just left of center, a classical clue for CLL. Red cells display reduced central pallor consistent with spherocytes, indicating intravascular or extravascular hemolysis driven by autoantibodies. The background shows mild polychromasia and rare nucleated RBCs, consistent with a robust reticulocyte response; the corrected reticulocyte count in this case is markedly elevated (>7%). Platelets are not significantly abnormal. These features collectively support autoimmune destruction of erythrocytes in the setting of CLL. Diagnostic significance lies in recognizing AIHA as a common autoimmune complication in CLL, with a clinical picture of sudden Hb decline and compensatory erythropoiesis. Differential considerations include drug-induced hemolysis, other causes of hemolytic anemia, or marrow infiltration by CLL. Clinical correlation includes therapy implications (steroids, rituximab) and close monitoring of hemolysis markers. This image is a valuable teaching resource for hematology morphology, AIHA in CLL, and differential diagnosis in anemia.
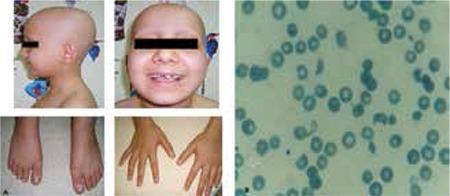
This composite image consists of clinical photographs and a diagnostic peripheral blood smear. Figure 1a (left) shows a pediatric patient with clinical signs including total alopecia (complete absence of scalp hair) and nail pitting affecting both hands and feet, characterized by small punctate depressions on the nail plates. Figure 1b (right) is a microscopic view of a peripheral blood smear demonstrating microangiopathic hemolytic anemia. Visible are numerous schistocytes—fragmented, irregular red blood cells including helmet cells and triangular forms—alongside some normal erythrocytes showing central pallor. The educational focus is on the multi-systemic manifestations of a medical condition, likely a microangiopathic process such as Hemolytic Uremic Syndrome (HUS) or similar systemic pathology, illustrating the correlation between dermatological signs (hair and nail changes) and hematological abnormalities (hemolysis and schistocytosis).
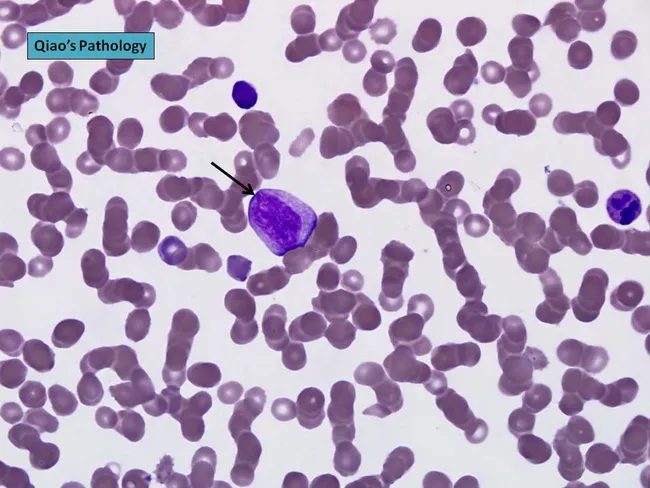
Comprehensive description: Brightfield light microscopy image of a peripheral blood smear stained with Wright-Giemsa, captured at high magnification to visualize circulating plasma cells. The central plasmablast shows an enlarged, irregular nucleus with a prominent nucleolus; the cytoplasm is moderately basophilic. This cell appears larger than surrounding erythrocytes and is consistent with malignant plasma cells typical of plasma cell leukemia. The background demonstrates rouleaux formation of red blood cells, a common feature in paraproteinemias due to increased serum proteins. The smear illustrates plasmacytosis that, when exceeding 20% of leukocytes, supports a diagnosis of plasma cell leukemia. In PCL, neoplastic plasma cells may be CD56 negative and often secrete monoclonal immunoglobulin with IgD or IgE isotypes or light-chain restriction; cytogenetic abnormalities are frequently observed. Morphology alone cannot definitively distinguish PCL from aggressive myeloma; immunophenotyping and cytogenetic studies are essential for precise classification. This image is valuable for hematology education, cytology review, and discussions of malignant plasma cell disorders, including primary versus secondary PCL, and their prognostic significance. Potential clinical utilities include morphologic confirmation in suspected PCL, training in recognition of plasmablasts, and correlation with CBC abnormalities and clinical features such as anemia, thrombocytopenia, lymphadenopathy, and organomegaly.
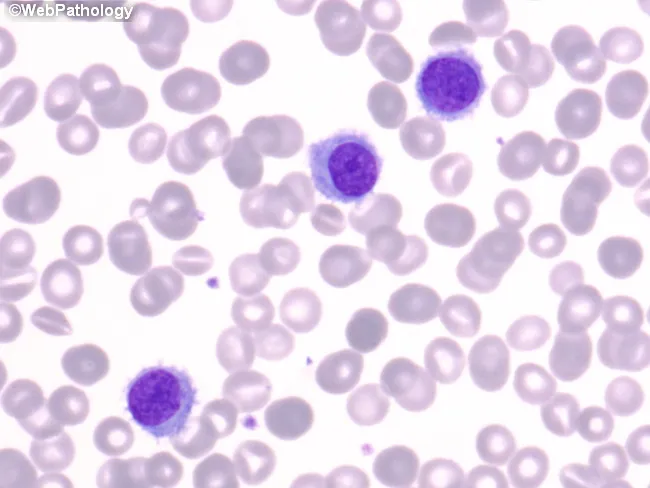
Imaging modality and technique: Light microscopy on peripheral blood smear stained with Wright-Giemsa. Specimen type: peripheral blood smear. Primary subject: Hairy cells. Anatomical context: hematopoietic peripheral blood. Observed morphology: Hairy cells are larger than small lymphocytes, about 1.5–2× the size; nuclei are oval to bean-shaped with open, coarse chromatin and inconspicuous nucleoli. Cytoplasm is moderate in volume, pale blue, with fine, hair-like cytoplasmic projections that extend from the cell surface. Chromatin is evenly dispersed; nucleoli are not prominent. The smear shows scattered hairy cells among a background of normocytic erythrocytes and neutrophils. In some cases cytoplasm may appear flocculent; proplate-like projections are best seen in well-prepared thin areas of smear. This morphology is best appreciated on peripheral smear preparations rather than aspirate smears, where hair projections may be less evident. Diagnostic significance: characteristic hairy cell features suggest a diagnosis of hairy cell leukemia (HCL) in appropriate clinical context; TRAP positivity, CD11c, CD25, and CD103 expression support the diagnosis. Clinical correlation includes cytopenias, splenomegaly, and exposure to risk factors; differential includes other lymphoid and myeloid disorders with cytoplasmic projections or atypical lymphocytes. Utility in education and differential diagnosis: hematology teaching, smear interpretation, cellular morphologic recognition, and confirmation with flow cytometry.
iron deficiency anemia microcytic hypochromic blood smear RBC pencil cells
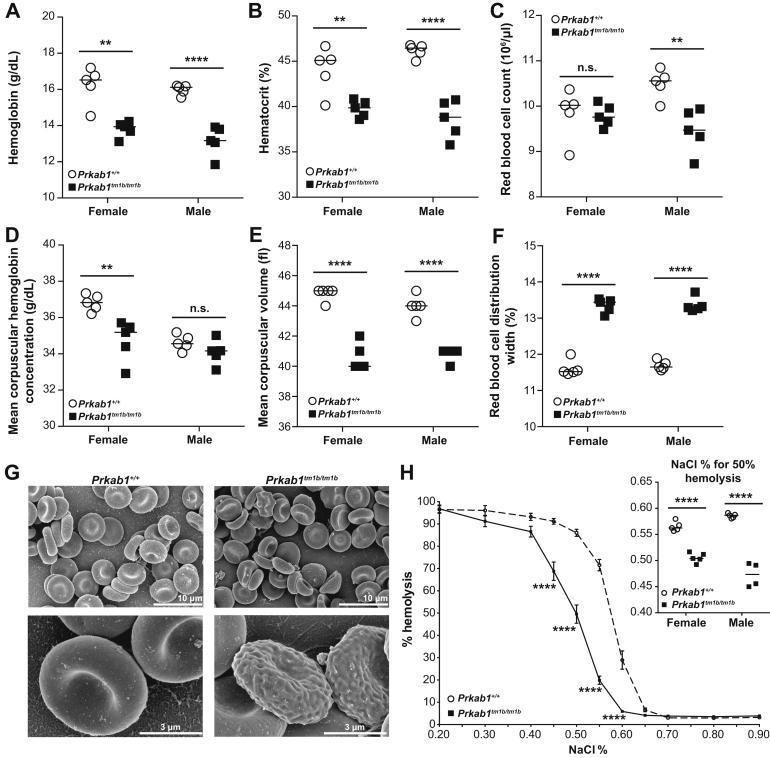
Educational figure illustrating hematological abnormalities in a murine model of Prkab1 deficiency, serving as a surrogate for studying human hemolytic anemia and microcytosis. Panels A-F present dot plots of hematological indices for wild-type (Prkab1+/+) and deficient (Prkab1tm1b/tm1b) mice, showing significant reductions in hemoglobin (A), hematocrit (B), and mean corpuscular volume (E), with a concomitant increase in red blood cell distribution width (F), indicating microcytic anemia with anisocytosis. Panel G contains high-resolution Scanning Electron Microscopy (SEM) images comparing erythrocyte morphology; wild-type cells show standard biconcave discocyte morphology, whereas Prkab1-deficient cells exhibit poikilocytosis with numerous abnormal forms, including acanthocytes, schistocytes, and echinocytes with irregular surface protrusions. Panel H displays an osmotic resistance curve, where Prkab1-deficient erythrocytes demonstrate a left-ward shift, signifying increased osmotic resistance (delayed hemolysis) compared to wild-type controls. The inset confirms a lower NaCl percentage required for 50% hemolysis in deficient cells, indicating altered membrane stability.
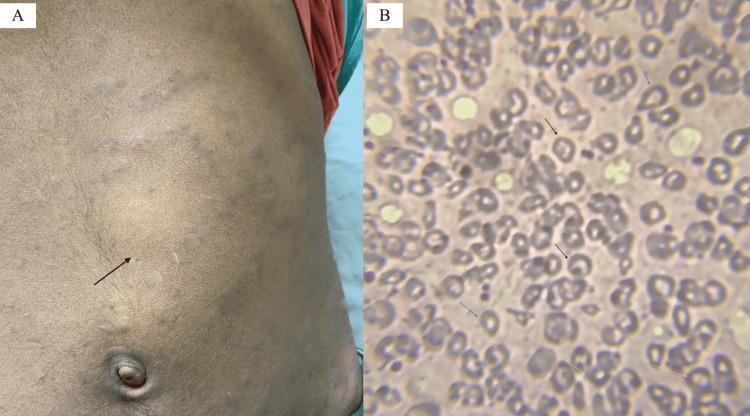
Educational medical image panel consisting of a clinical photograph and a diagnostic pathology image illustrating physical and hematological findings of a hemoglobinopathy such as Hb E/beta-thalassemia. Panel A is a clinical photograph of a patient's abdomen showing a prominent bulge in the left upper quadrant and mid-abdomen, with a black arrow indicating the anterior notch of a massively enlarged spleen (splenomegaly). The overlying skin shows subtle striae or discoloration. Panel B is a peripheral blood smear (Leishman stain, 200x) showing significant red blood cell (RBC) dysmorphology. Key findings include target cells (codocytes) marked by black arrows, teardrop cells (dacrocytes) marked by blue arrows, and basophilic stippling within microcytic, hypochromic RBCs marked by yellow arrows. These visual markers are classic indicators of disordered erythropoiesis and hemoglobin synthesis abnormalities, providing a diagnostic bridge between clinical examination (splenomegaly) and laboratory hematopathology.
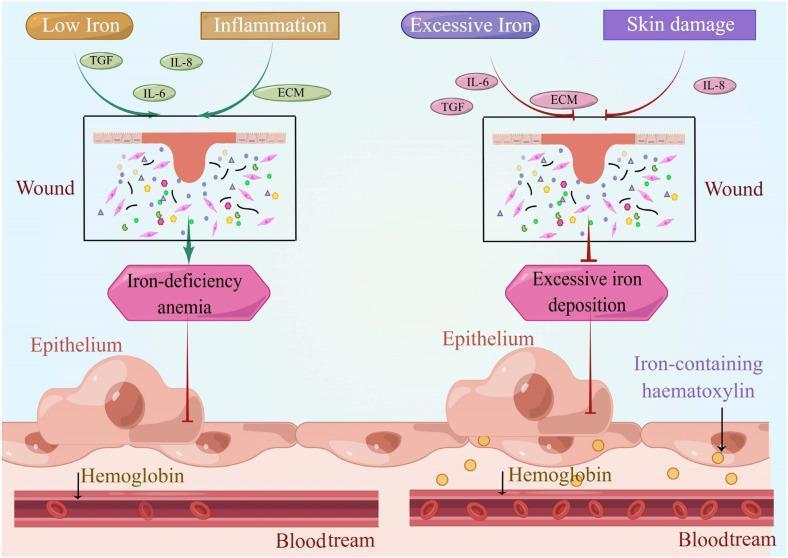
A comparative medical illustration detailing the effects of iron dysregulation on wound healing and systemic states. The left panel depicts a 'Low Iron' and 'Inflammation' scenario where a cutaneous wound is associated with 'Iron-deficiency anemia'. Key signaling molecules shown include TGF, IL-6, IL-8, and ECM components within a wound bed containing fibroblasts and matrix elements. An arrow indicates the downstream impact on the underlying epithelium and hemoglobin within the bloodstream. The right panel depicts an 'Excessive Iron' and 'Skin damage' scenario characterized by 'Excessive iron deposition'. This state is visually distinguished by an inhibitory symbol (red T-bar) directed at the epithelium, suggesting impaired regenerative capacity. Notably, the epithelium in the high-iron state contains yellow granules labeled as 'Iron-containing haematoxylin' (hemosiderin), which serve as a histological marker of iron overload. Both panels show the anatomical relationship between the cutaneous wound, underlying epithelial cells, and the intravascular space (bloodstream) containing red blood cells and hemoglobin, illustrating how iron homeostasis is critical for normal dermatological repair and systemic oxygen transport.
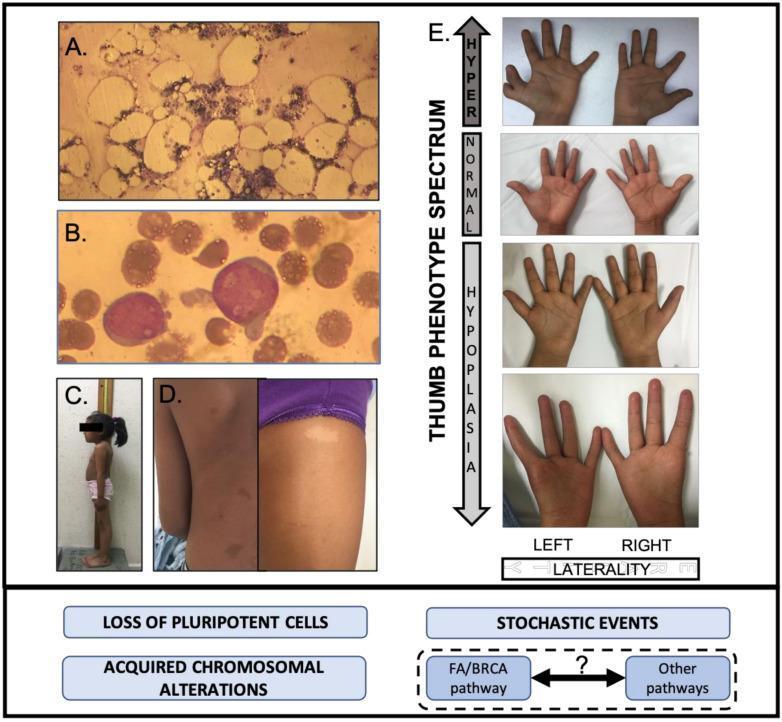
This composite educational image illustrates the multisystem clinical and pathological manifestations of Fanconi Anemia (FA), highlighting the impact of FA/BRCA pathway deficits. (A) Histological micrograph of bone marrow showing hypocellularity and attrition of hematopoietic progenitors, indicative of bone marrow failure. (B) High-power microscopy of a blood smear or marrow showing blast cells with chromosomal aberrations, representing acute myeloblastic leukemia (AML). (C) Clinical photograph demonstrating somatometric features, specifically short stature and microcephaly. (D) Clinical photographs of skin showing pigmentary abnormalities, including hyperpigmented café au lait macules (left) and hypopigmented (hypochromic) macules (right). (E) A series of clinical photographs depicting the 'Thumb Phenotype Spectrum,' ranging from hyperplasia (top) to normal, and descending into degrees of hypoplasia and aplasia (bottom), with labels for left and right hand laterality. The bottom panel provides a conceptual framework linking these features to the loss of pluripotent cells, acquired chromosomal alterations, and stochastic events within the FA/BRCA and related developmental pathways.
Peripheral blood smear from a patient with known chronic lymphocytic leukemia (CLL) showing autoimmune hemolytic anemia (AIHA). Brightfield microscopy of Wright-Giemsa stained smear at 1000x (oil immersion) reveals two dominant cell populations: numerous small mature lymphocytes typical of CLL and red blood cells showing spherocytic deformation. A smudge cell is evident just left of center, a classical clue for CLL. Red cells display reduced central pallor consistent with spherocytes, indicating intravascular or extravascular hemolysis driven by autoantibodies. The background shows mild polychromasia and rare nucleated RBCs, consistent with a robust reticulocyte response; the corrected reticulocyte count in this case is markedly elevated (>7%). Platelets are not significantly abnormal. These features collectively support autoimmune destruction of erythrocytes in the setting of CLL. Diagnostic significance lies in recognizing AIHA as a common autoimmune complication in CLL, with a clinical picture of sudden Hb decline and compensatory erythropoiesis. Differential considerations include drug-induced hemolysis, other causes of hemolytic anemia, or marrow infiltration by CLL. Clinical correlation includes therapy implications (steroids, rituximab) and close monitoring of hemolysis markers. This image is a valuable teaching resource for hematology morphology, AIHA in CLL, and differential diagnosis in anemia.
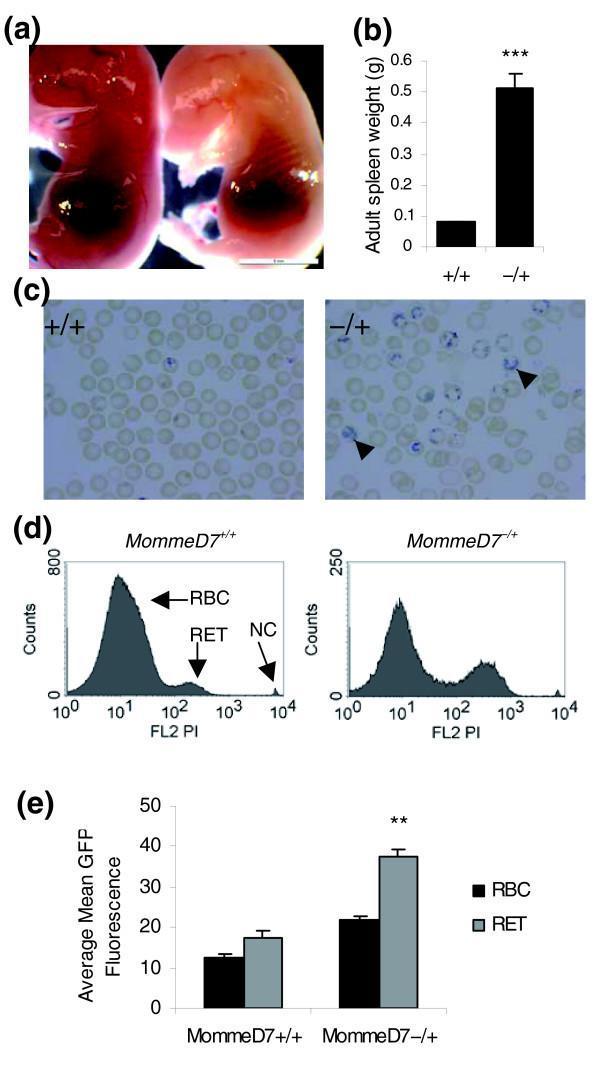
This composite educational graphic illustrates hematopoietic abnormalities in MommeD7 mutant mice across multiple modalities. Panel (a) contains clinical photographs of 17.5 dpc embryos, comparing a phenotypically normal (red/vascularized) embryo with an abnormal, pale embryo suggestive of severe anemia or a red cell defect. Panel (b) is a bar graph showing significant splenomegaly in adult heterozygous (-/+) mice compared to wild-type (+/+). Panel (c) presents light microscopy of peripheral blood smears; the mutant smear (-/+) displays a high frequency of reticulocytes—identified by characteristic punctate blue staining (arrowheads)—indicating a compensatory response to anemia. Panel (d) shows flow cytometry histograms of propidium iodide fluorescence, quantifying the shift from mature red blood cells (RBC) to an increased reticulocyte (RET) population in the mutant. Panel (e) uses a bar chart to compare average mean GFP fluorescence, demonstrating higher expression levels in reticulocytes versus RBCs, particularly in the heterozygous line. Collectively, these images illustrate the pathophysiology of a hematopoietic mutation leading to embryonic pallor, adult splenomegaly, and increased reticulocytosis.
sickle cell anemia peripheral blood smear sickle cells target cells
Peripheral blood smear from a patient with known chronic lymphocytic leukemia (CLL) showing autoimmune hemolytic anemia (AIHA). Brightfield microscopy of Wright-Giemsa stained smear at 1000x (oil immersion) reveals two dominant cell populations: numerous small mature lymphocytes typical of CLL and red blood cells showing spherocytic deformation. A smudge cell is evident just left of center, a classical clue for CLL. Red cells display reduced central pallor consistent with spherocytes, indicating intravascular or extravascular hemolysis driven by autoantibodies. The background shows mild polychromasia and rare nucleated RBCs, consistent with a robust reticulocyte response; the corrected reticulocyte count in this case is markedly elevated (>7%). Platelets are not significantly abnormal. These features collectively support autoimmune destruction of erythrocytes in the setting of CLL. Diagnostic significance lies in recognizing AIHA as a common autoimmune complication in CLL, with a clinical picture of sudden Hb decline and compensatory erythropoiesis. Differential considerations include drug-induced hemolysis, other causes of hemolytic anemia, or marrow infiltration by CLL. Clinical correlation includes therapy implications (steroids, rituximab) and close monitoring of hemolysis markers. This image is a valuable teaching resource for hematology morphology, AIHA in CLL, and differential diagnosis in anemia.
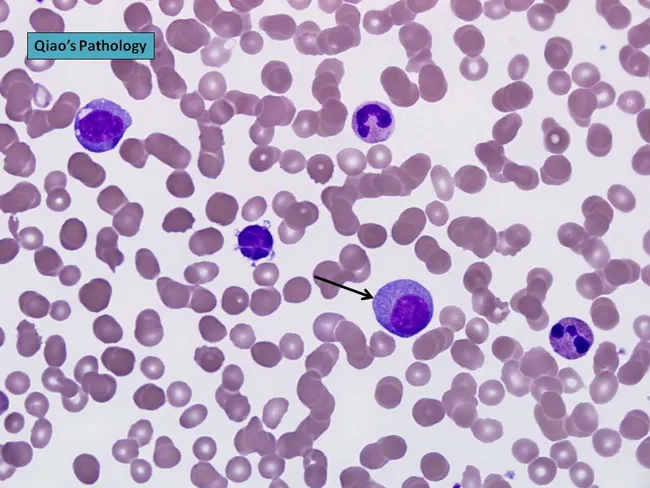
Peripheral blood smear prepared with Wright-Giemsa stain and examined under brightfield illumination using a 100× oil immersion objective reveals a single large plasma cell among a field of mature erythrocytes. The plasma cell displays features typical of clonal plasma cells: basophilic cytoplasm, an eccentrically placed round nucleus, and a conspicuous perinuclear hof; background shows rouleaux formation of red cells. This image exemplifies hematologic involvement by a plasma cell dyscrasia. In plasma cell leukemia, circulating plasma cells constitute more than 20% of leukocytes, a hallmark distinguishing it from conventional multiple myeloma, although both conditions share monoclonal plasma cell proliferation. The presence of circulating plasma cells is associated with younger patient age, higher incidence of anemia, thrombocytopenia, organomegaly, and possible lymphadenopathy; however lytic bone lesions may be less common. Immunophenotypic patterns often include lack of CD56 expression relative to myeloma. Clinically, this morphological finding warrants confirmation with complete blood count, peripheral smear review, quantitative plasma cell percentage, serum protein electrophoresis, and immunofixation to identify monoclonal immunoglobulin isotype (IgD/IgE or light-chain predominance). Early detection of circulating plasma cells supports prognosis assessment and guides therapy decisions in plasma cell dyscrasia management and monitoring, including risk stratification and treatment response evaluation for practice in clinics.
This peripheral blood smear was prepared and stained with Wright-Giemsa and examined by bright-field light microscopy to assess circulating hematopoietic cells in suspected systemic mastocytosis (SM). The smear shows rare, but conspicuous, mast cells with round to polygonal shapes and abundant cytoplasmic granules that impart a deep purple, metachromatic appearance. Nuclei are generally round to ovoid and may be slightly irregular or bilobed in some cells; granules occupy most of the cytoplasm and may obscure nuclear detail. The surrounding leukocytes include eosinophils and neutrophils, and the erythrocyte background is normocytic with occasional anisocytosis. In SM, circulating mast cells are typically infrequent; when they constitute a substantial fraction of leukocytes (≥10%), the finding is highly suggestive of mast cell leukemia (MCL). The image exemplifies an increased mast cell burden consistent with aggressive SM or MCL, often accompanied by cytopenias such as anemia or thrombocytopenia and potential associated hematologic neoplasms (e.g., CMML, MDS/MPN). This morphologic snapshot supports integration with phenotypic assays (CD117/c-KIT), flow cytometry, and molecular testing for KIT mutations, to establish diagnosis, prognostication, and therapeutic planning. Relevant keywords: systemic mastocytosis, mast cell leukemia, circulating mast cells, metachromatic granules, Wright-Giemsa, toluidine blue, KIT D816V, CD117, SM-AHN. This description emphasizes morphology guiding diagnosis appropriately.
Anemia - Comprehensive Overview
1. Definition
| Measurement | Males | Females |
|---|---|---|
| Hemoglobin (g/dL) | 13.6 - 17.2 | 12.0 - 15.0 |
| Hematocrit (%) | 39 - 49 | 33 - 43 |
| RBC count (×10⁶/µL) | 4.3 - 5.9 | 3.5 - 5.0 |
| MCV (fL) | 82 - 96 | |
| MCH (pg) | 27 - 33 | |
| MCHC (g/dL) | 33 - 37 | |
| Reticulocyte count (%) | 0.5 - 1.5 |
2. Pathophysiologic Classification
A. Blood Loss
- Acute: Trauma, surgery - initially normocytic/normochromic; reticulocytosis at 7 days (up to 10-15%)
- Chronic: GI lesions, gynecologic causes - eventually leads to iron deficiency anemia
B. Increased RBC Destruction (Hemolytic Anemias)
- RBC membrane defects: Hereditary spherocytosis, hereditary elliptocytosis
- Enzyme deficiencies: G6PD deficiency, pyruvate kinase deficiency
- Hemoglobin abnormalities: Thalassemia syndromes, sickle cell disease
- Antibody-mediated: Autoimmune hemolytic anemia, hemolytic disease of the newborn, transfusion reactions
- Microangiopathic: HUS, DIC, TTP
- Infections: Malaria, babesiosis
- PNH (paroxysmal nocturnal hemoglobinuria)
C. Decreased RBC Production
- Nutritional deficiencies: Iron, B12, folate
- EPO deficiency: Anemia of chronic kidney disease
- Bone marrow failure: Aplastic anemia, infiltration by malignancy
- Chronic inflammation: Anemia of chronic disease
- Primary hematopoietic neoplasms: Leukemia, MDS
3. Morphologic Classification by MCV
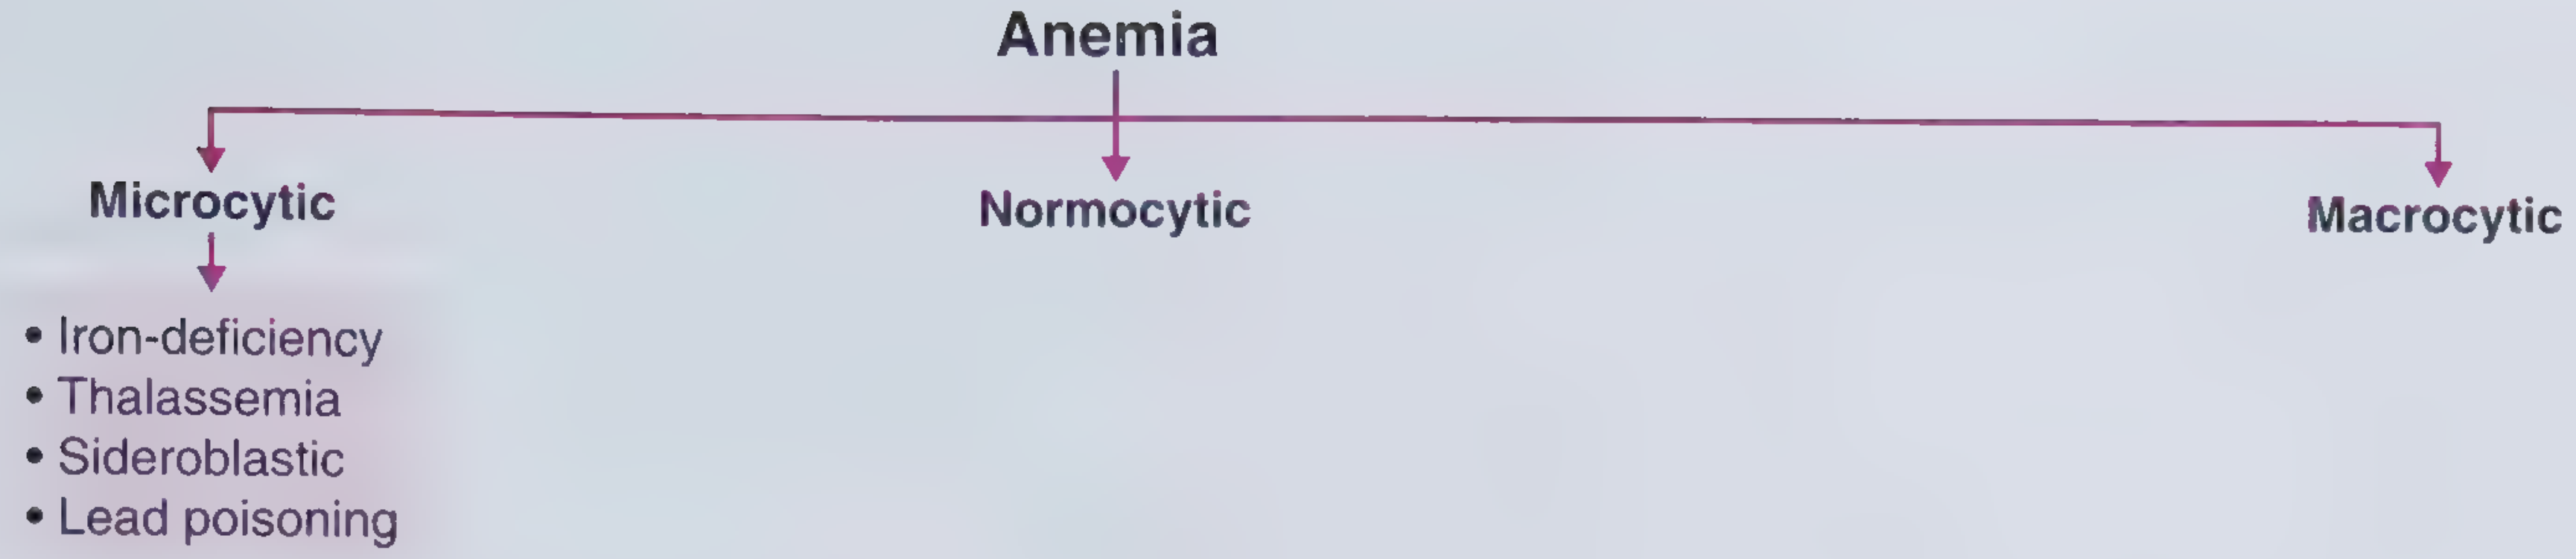
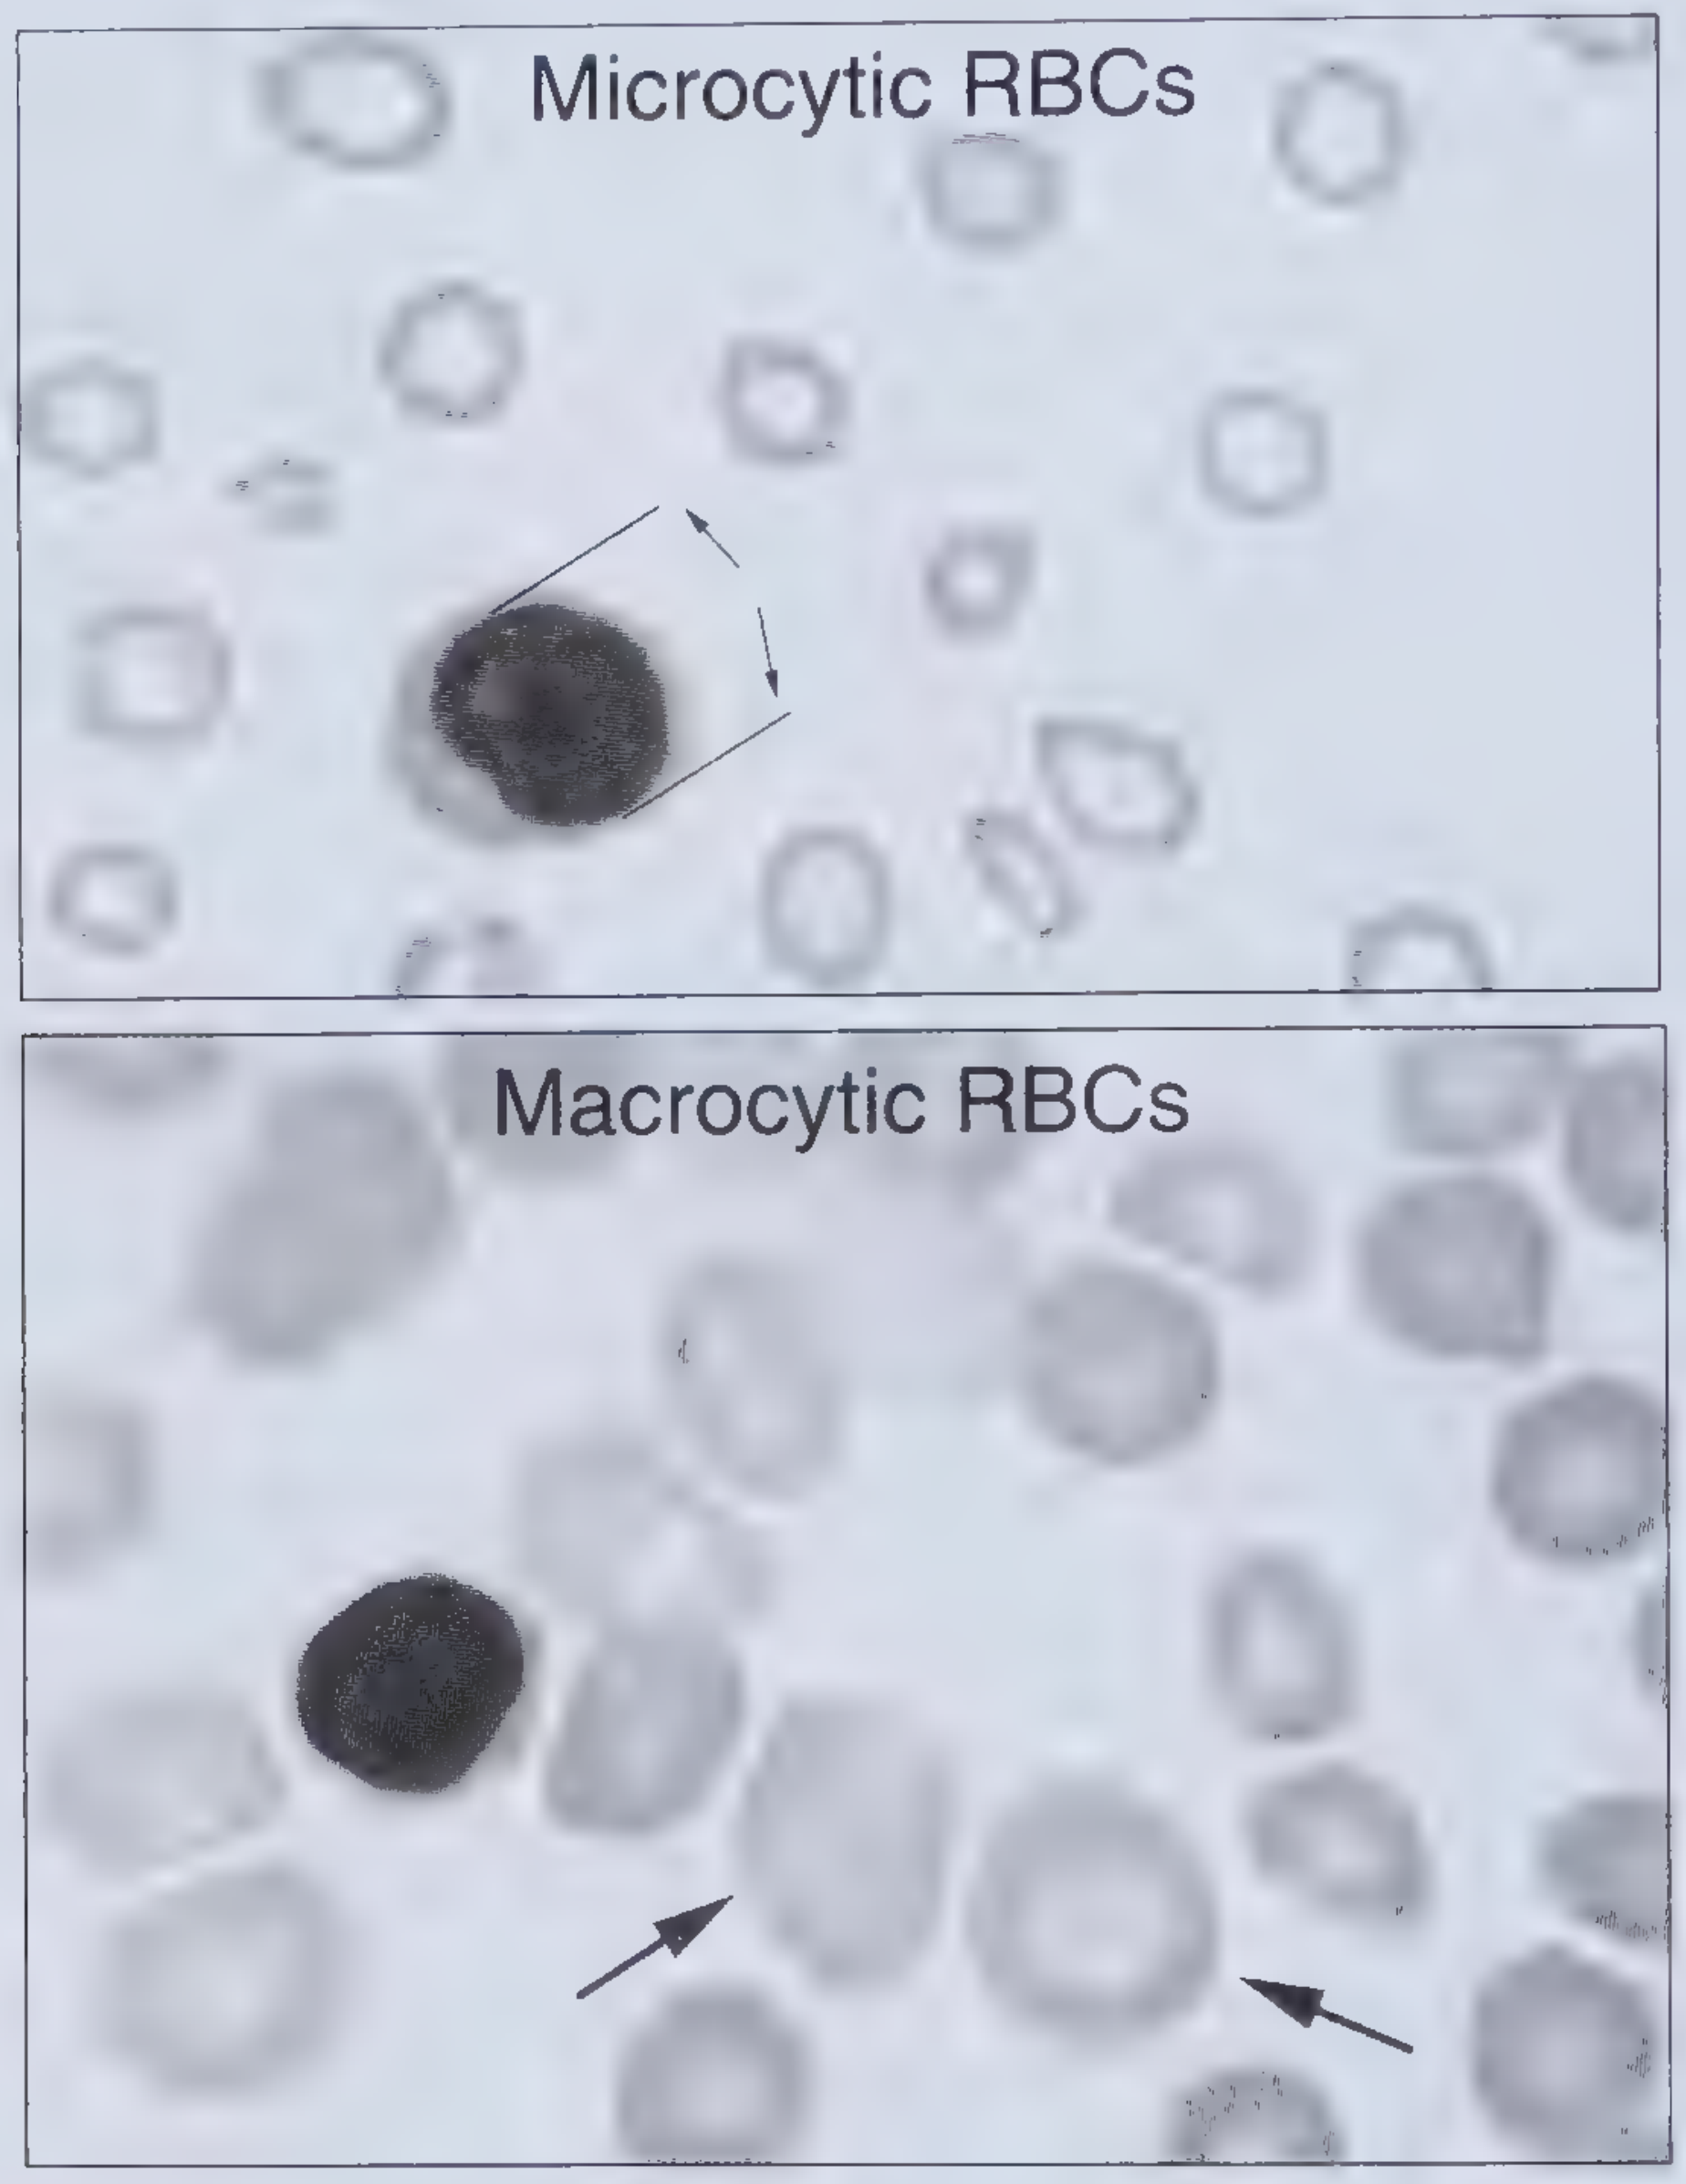
Microcytic Anemia (MCV < 80 fL)
| Cause | Key Feature |
|---|---|
| Iron deficiency anemia | Most common worldwide; low ferritin; high TIBC |
| Thalassemia | Defect in globin chain synthesis; target cells on smear |
| Anemia of chronic disease | Often normocytic; hepcidin-mediated iron trapping |
| Sideroblastic anemia | Ring sideroblasts on bone marrow; iron overload |
| Lead poisoning | Basophilic stippling; elevated ZPP |
Macrocytic Anemia (MCV > 100 fL)
| Oval Macrocytes (Megaloblastic) | Round Macrocytes (Non-megaloblastic) |
|---|---|
| Vitamin B12 deficiency | Liver disease |
| Folate deficiency | Alcoholism |
| Medications (methotrexate, hydroxyurea) | Hypothyroidism |
| Myelodysplasia | Reticulocytosis |
Normocytic Anemia (MCV 80-100 fL)
| Category | Examples |
|---|---|
| Aplastic anemia | Pancytopenia + bone marrow hypoplasia |
| Anemia of chronic/renal disease | EPO deficiency |
| Acute blood loss | Early phase, before reticulocytosis |
| Hemolysis | With reticulocytosis |
| Marrow infiltration | Leukemia, myeloma, myelofibrosis |
| Endocrinopathies | Hypothyroidism, hypogonadism |
4. Clinical Features
- Fatigue and loss of stamina
- Dyspnea on exertion
- Headache, poor concentration
- Palpitations
- Pallor of skin, mucous membranes, conjunctiva, palmar creases, nail beds
- Tachycardia
- Wide pulse pressure, forceful heartbeat, strong peripheral pulses
- Systolic flow murmur (hyperdynamic circulation)
- Increased cardiac output (increased stroke volume + heart rate)
- Increased 2,3-BPG production (right-shifts oxygen-hemoglobin dissociation curve)
- Decreased systemic vascular resistance
- Increased coronary and cerebral blood flow
- Jaundice + splenomegaly = hemolytic anemia
- Koilonychia (spoon nails), glossitis, angular cheilitis = iron deficiency
- Neurologic deficits (subacute combined degeneration) = B12 deficiency (NOT folate)
- Bone pain + lytic lesions = myeloma
5. Diagnostic Approach
Reticulocytes HIGH (>100,000/µL) → Increased destruction or blood loss
(bone marrow responding) (hemolysis, hemorrhage)
Reticulocytes LOW → Decreased production
(bone marrow not responding) (nutritional, aplasia, CKD)
| Suspected Diagnosis | Key Tests |
|---|---|
| Iron deficiency | Serum ferritin (most sensitive single test), serum iron, TIBC, transferrin saturation |
| B12/Folate deficiency | Serum B12, RBC folate; hypersegmented neutrophils on smear |
| Hemolysis | LDH↑, indirect bilirubin↑, haptoglobin↓, peripheral smear (spherocytes, schistocytes) |
| Aplastic anemia | Bone marrow biopsy (hypocellular marrow) |
| Thalassemia | Hb electrophoresis, HPLC |
| Sickle cell | Hb electrophoresis (HbS) |
| Autoimmune hemolytic | Direct Coombs (DAT) test |
6. Key Individual Anemias
A. Iron Deficiency Anemia (IDA)
- Most common cause of anemia worldwide
- Causes: Malnutrition, chronic blood loss (GI most common in adults), malabsorption (celiac), increased demand (pregnancy)
- Lab: Ferritin ↓ (earliest and most sensitive), serum iron ↓, TIBC ↑, transferrin saturation ↓
- Smear: Microcytic, hypochromic cells; pencil/cigar cells (elongated hypochromic RBCs)
- Treatment: Oral ferrous sulfate (3-6 months to replenish stores)
B. Megaloblastic Anemia (B12 / Folate Deficiency)
- Macrocytic anemia with hypersegmented neutrophils (>5 lobes in >5% of cells) on smear
- MCV typically >100 fL; pancytopenia in severe cases
- B12 deficiency only causes neurologic symptoms: subacute combined degeneration (posterior + lateral column), paresthesias, ataxia, cognitive decline
- Giving folate alone to an undiagnosed B12-deficient patient corrects anemia but worsens or unmasks neurologic damage - always rule out B12 deficiency first
- Treatment: IM B12 (cyanocobalamin) or high-dose oral B12; folate supplementation
C. Hemolytic Anemias
- Extravascular hemolysis: Anemia + splenomegaly + jaundice; haptoglobin low; LDH raised
- Intravascular hemolysis: Anemia + hemoglobinemia + hemoglobinuria (red-brown urine) + hemosiderinuria; NO splenomegaly
- Both: Elevated unconjugated (indirect) bilirubin, reticulocytosis, elevated LDH
D. Anemia of Chronic Disease (ACD)
- Mild to moderate normocytic (sometimes microcytic) anemia
- Mechanism: Hepcidin ↑ (from IL-6 in inflammation) → blocks ferroportin → serum iron ↓, TIBC ↓, ferritin normal or ↑ (distinguishes from IDA)
- Associated with: Chronic infection, autoimmune disease, cancer, CKD
- Treatment: Treat underlying cause; EPO agents in CKD
E. Aplastic Anemia
- Bone marrow failure: pancytopenia (anemia + neutropenia + thrombocytopenia) with hypocellular bone marrow (>70% fat cells) in the absence of infiltrative disease
- Causes: Idiopathic (most common), drugs, viruses (Parvovirus B19, hepatitis), radiation, autoimmune (T-cell mediated destruction of HSCs)
- Treatment: Allogeneic bone marrow transplantation (young patients) or immunosuppression with anti-thymocyte globulin (ATG) + cyclosporine
7. Severity Grading
| Grade | Hemoglobin (g/dL) |
|---|---|
| Mild | 10 - lower limit of normal |
| Moderate | 8 - 10 |
| Severe | 6 - 8 |
| Very severe / life-threatening | < 6 |
8. Summary Diagnostic Algorithm
CBC shows low Hb/Hct
↓
Check Reticulocyte Count
↙ ↘
HIGH (>100k) LOW (<100k)
(Blood loss/Hemolysis) (Underproduction)
↓ ↓
Peripheral smear Check MCV
LDH, bilirubin ↙ ↓ ↘
Haptoglobin Micro Normo Macro
Coombs test ↓ ↓ ↓
Fe,TIBC EPO, B12/Folate
Hb elec CKD, Liver disease
BM bx Thyroid
Types of anemia
types of anemia comparison blood smear iron deficiency megaloblastic hemolytic sickle cell

This diagnostic image is an axial non-contrast CT scan of the upper abdomen, illustrating secondary hemochromatosis (hepatic iron overload) in a patient with Sickle Cell Anemia (SCA). The liver is prominently displayed, exhibiting a global and diffuse increase in parenchymal attenuation (hyperdensity), appearing significantly brighter than the adjacent spleen. Multiple punctate, high-density foci are scattered throughout the liver, consistent with focal iron deposition. The spleen is visible in the left upper quadrant with a mottled appearance, and the stomach is seen with an air-fluid level. The abdominal aorta and vertebral column are clearly visible posteriorly. This imaging modality demonstrates how chronic transfusion therapy leads to hemosiderin deposition, which increases the Hounsfield units (HU) of the liver parenchyma, serving as a key diagnostic finding for monitoring iron status in patients with chronic hemolytic disorders.

This composite of abdominal MRI scans illustrates multisystemic manifestations of sickle cell disease. Panel (a) is an axial Gradient Echo (GRE) image and panel (b) is an axial T2-weighted image; both demonstrate diffusely low signal intensity (hypointensity) within the renal cortex bilaterally. This finding is characteristic of renal cortical siderosis resulting from chronic intravascular hemolysis. Furthermore, the liver in panel (b) shows abnormally low signal intensity on the T2-weighted sequence, indicating hepatic iron deposition (hemosiderosis) due to combined intravascular and extravascular hemolysis. Panel (c) is a coronal post-contrast T1-weighted image showing a small, shrunken, and largely infarcted spleen (indicated by a white arrow), a classic progression of autosplenectomy in sickle cell patients. The images collectively highlight diagnostic markers of chronic hemolytic anemia and its secondary effects on abdominal organs, specifically the kidneys, liver, and spleen, emphasizing the role of MRI in detecting and quantifying tissue iron overload and vascular complications.
Peripheral blood smear from a patient with known chronic lymphocytic leukemia (CLL) showing autoimmune hemolytic anemia (AIHA). Brightfield microscopy of Wright-Giemsa stained smear at 1000x (oil immersion) reveals two dominant cell populations: numerous small mature lymphocytes typical of CLL and red blood cells showing spherocytic deformation. A smudge cell is evident just left of center, a classical clue for CLL. Red cells display reduced central pallor consistent with spherocytes, indicating intravascular or extravascular hemolysis driven by autoantibodies. The background shows mild polychromasia and rare nucleated RBCs, consistent with a robust reticulocyte response; the corrected reticulocyte count in this case is markedly elevated (>7%). Platelets are not significantly abnormal. These features collectively support autoimmune destruction of erythrocytes in the setting of CLL. Diagnostic significance lies in recognizing AIHA as a common autoimmune complication in CLL, with a clinical picture of sudden Hb decline and compensatory erythropoiesis. Differential considerations include drug-induced hemolysis, other causes of hemolytic anemia, or marrow infiltration by CLL. Clinical correlation includes therapy implications (steroids, rituximab) and close monitoring of hemolysis markers. This image is a valuable teaching resource for hematology morphology, AIHA in CLL, and differential diagnosis in anemia.

Diagnostic neuroimaging panel showing comparative hemodynamic maps from a representative 8-year-old male with sickle cell anemia. The image displays three columns of axial and sagittal MRI brain slices categorized by regions of interest (ROI): Gray Matter (GM), White Matter (WM), and the 90th percentile high-signal Sagittal Sinus (SS), with ROI masks overlaid in white. Column 1 shows Single Inflow Time (singleTI) Cerebral Blood Flow (CBF) maps (scale 0-100 ml/100g/min), exhibiting higher cortical signal compared to deep structures. Column 2 presents Multi Inflow Time (multiTI) CBF maps (scale 0-200 ml/100g/min), revealing increased signal intensity and patchier distribution, particularly in the WM. Column 3 displays multiTI Bolus Arrival Time (BAT) maps (scale 0-1.3 seconds), showing a variegated, heterogeneous pattern across the parenchyma and sagittal sinus. This comparison illustrates variations in perfusion quantification and bolus transit dynamics between single and multiTI arterial spin labeling (ASL) sequences in a pediatric sickle cell population.
thalassemia peripheral blood smear target cells microcytic hypochromic
Educational medical image panel consisting of a clinical photograph and a diagnostic pathology image illustrating physical and hematological findings of a hemoglobinopathy such as Hb E/beta-thalassemia. Panel A is a clinical photograph of a patient's abdomen showing a prominent bulge in the left upper quadrant and mid-abdomen, with a black arrow indicating the anterior notch of a massively enlarged spleen (splenomegaly). The overlying skin shows subtle striae or discoloration. Panel B is a peripheral blood smear (Leishman stain, 200x) showing significant red blood cell (RBC) dysmorphology. Key findings include target cells (codocytes) marked by black arrows, teardrop cells (dacrocytes) marked by blue arrows, and basophilic stippling within microcytic, hypochromic RBCs marked by yellow arrows. These visual markers are classic indicators of disordered erythropoiesis and hemoglobin synthesis abnormalities, providing a diagnostic bridge between clinical examination (splenomegaly) and laboratory hematopathology.
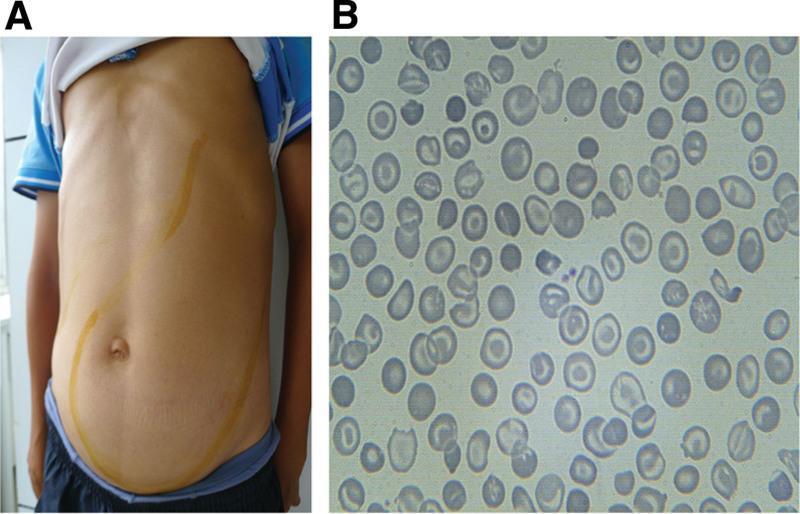
This composite educational image illustrates the clinical signs and laboratory findings of thalassemia intermedia. Panel A is a clinical photograph of a patient's torso showing massive abdominal distention. Yellow skin markings delineate the margins of significant hepatomegaly and massive splenomegaly, with the spleen extending from the left upper quadrant across the midline and deep into the pelvic region, occupying nearly the entire abdominal cavity. Panel B is a peripheral blood smear (light microscopy) demonstrating classic hematological abnormalities associated with thalassemia. The red blood cells exhibit marked microcytosis (small size) and hypochromia (central pallor), along with numerous target cells (codocytes) and irregularly contracted cells (schistocytes). These findings collectively highlight the physical manifestations of extramedullary hematopoiesis and chronic hemolytic anemia characteristic of advanced hemoglobinopathies.
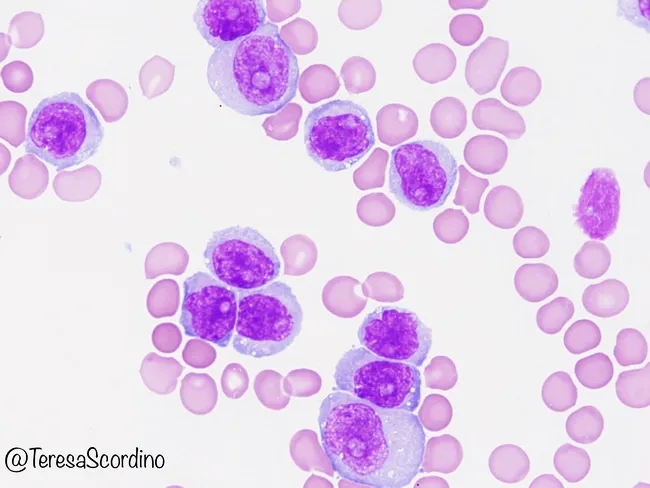
Imaging modality: Bright-field microscopy of Wright-Giemsa stained peripheral blood smear. Anatomical target: circulating peripheral blood cells, with a focus on B-cell prolymphocytes. Visual features: a monomorphic population of medium-to-large lymphoid cells exhibiting round to slightly irregular nuclei, coarse chromatin, and prominent nucleoli; cytoplasm is basophilic and variably abundant; occasional cytoplasmic projections may be seen; the smear background shows scattered erythrocytes and platelets. Overall, leukocytosis with prolymphocytic predominance suggests a malignant B-cell process. Pathological context: morphological hallmarks of B-cell prolymphocytic leukemia (B-PLL), defined by prolymphocytes comprising more than 55% of circulating lymphoid cells in peripheral blood; cells may be part of a systemic leukemia involving bone marrow and spleen. Immunophenotype typically expresses B-cell markers (CD19, CD20) with light chain restriction; immunohistochemistry and flow cytometry are used for confirmation; distinction from mantle cell lymphoma (cyclin D1/MCL) and CLL with increased prolymphocytes is critical. Diagnostic significance: detection of prolymphocytic leukocytes guides prognosis and therapeutic planning, as B-PLL has an aggressive course and limited responsiveness to standard CLL regimens. Clinical correlation: patients are commonly elderly with fatigue, cytopenias, and organomegaly; accurate classification influences treatment choice and clinical trial eligibility; this image serves as an educational reference for hematology, pathology, and medical education.
sickle cell disease vaso-occlusion pathophysiology deoxygenation HbS polymerization
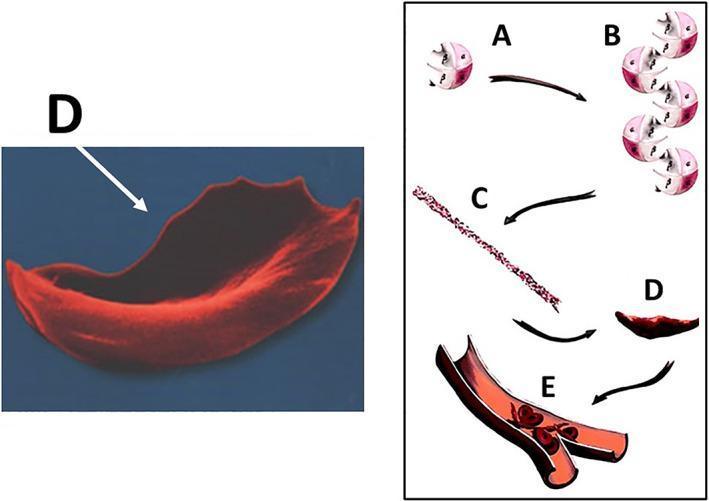
This educational graphic illustrates the molecular and cellular pathophysiology of sickle cell disease (SCD) leading to vaso-occlusion. The diagram is divided into a microscopic anatomical illustration and a high-magnification scanning electron micrograph. Steps A through D depict the hemoglobin S (HbS) polymerization process: (A) individual deoxygenated hemoglobin tetramers, (B) aggregation of hemoglobin molecules, (C) formation of long, rigid hemoglobin polymers or strands, and (D) the resulting transformation of a flexible biconcave red blood cell into a rigid, crescent or sickle-shaped erythrocyte. A corresponding scanning electron micrograph (labeled D) highlights the characteristic elongated, spicular morphology of a sickled cell. Section E shows a cross-section of a small bifurcating blood vessel where these rigid, abnormally shaped cells are aggregating, causing mechanical obstruction (vaso-occlusion) of the lumen. This process demonstrates the mechanism behind tissue ischemia and subsequent complications such as osteonecrosis in SCD patients. The content is suitable for medical students and clinicians studying hematology and musculoskeletal pathology.
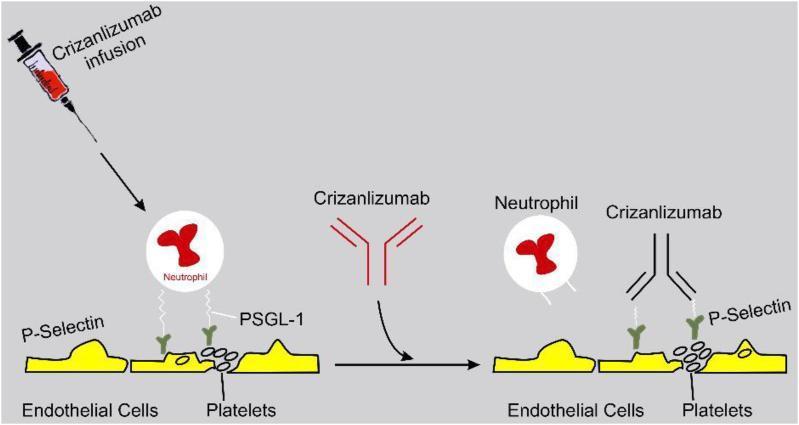
This pathophysiology diagram illustrates the mechanism of action of Crizanlizumab in managing vaso-occlusion, particularly relevant to sickle cell disease. The illustration is divided into two comparative stages: pretreatment (left) and post-treatment (right). On the left, a neutrophil is shown adhering to the vascular endothelium and activated platelets. This adhesion is mediated by the interaction between P-selectin, expressed on the surface of endothelial cells and platelets, and P-selectin glycoprotein ligand-1 (PSGL-1) located on the neutrophil. In the center, a syringe depicts the infusion of Crizanlizumab, a humanized monoclonal antibody. On the right, the diagram demonstrates the therapeutic effect: Crizanlizumab molecules bind directly to P-selectin on the endothelial cells and platelets. This binding competitively inhibits the P-selectin/PSGL-1 interaction, resulting in the detachment of the neutrophil from the vessel wall and preventing further leukocyte adhesion. The diagram highlights the drug's role in reducing multicellular adhesion and subsequent vaso-occlusive crises.
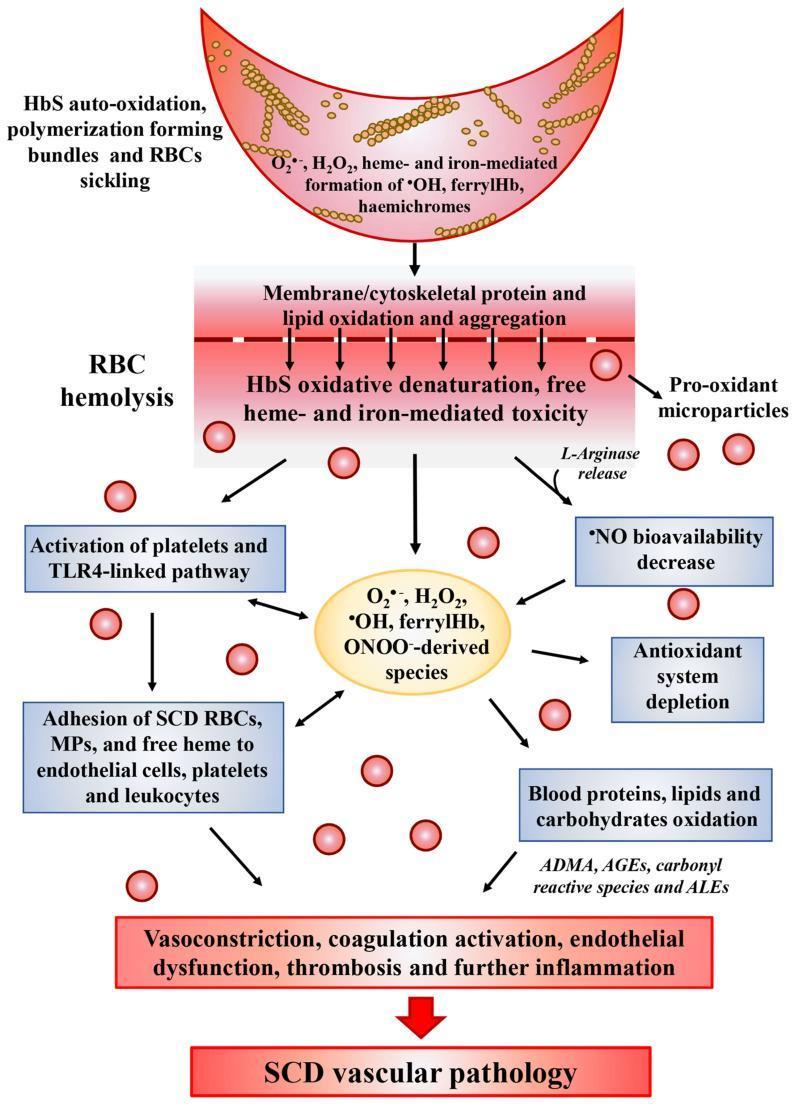
A medical pathophysiology diagram illustrating the oxidative stress cascade in Sickle Cell Disease (SCD) and its progression to vascular pathology. The diagram follows a vertical flow starting with a sickled red blood cell (RBC) undergoing HbS auto-oxidation and polymerization, leading to the generation of reactive oxygen species (ROS) such as H2O2, ferrylHb, and hemichromes. This triggers a central event of RBC hemolysis, characterized by membrane lipid oxidation, protein aggregation, and the release of pro-oxidant microparticles and L-arginase. Downstream pathways depict the systemic consequences, including the activation of platelets and the TLR4-linked inflammatory pathway, adhesion of SCD RBCs to endothelial cells and leukocytes, and a significant decrease in nitric oxide (NO) bioavailability. The lower section highlights the depletion of the antioxidant system and the oxidative modification of blood components into ADMA, AGEs, and ALEs. The cascade culminates in clinical manifestations such as vasoconstriction, endothelial dysfunction, and thrombosis, collectively summarized as SCD vascular pathology. This illustration is designed for advanced medical education regarding the molecular mechanisms of hematologic disorders.
Types of Anemia - A Complete Guide
Overview: The Two Classification Systems
| System | Categories | Clinical Use |
|---|---|---|
| Morphologic (MCV) | Microcytic / Normocytic / Macrocytic | First step in workup (from CBC) |
| Pathophysiologic | Blood loss / Decreased production / Increased destruction | Guides definitive diagnosis |
SECTION 1: MICROCYTIC ANEMIAS (MCV < 80 fL)
1. Iron Deficiency Anemia (IDA)
- Chronic blood loss (GI tract - peptic ulcers, colon cancer, hemorrhoids; female genital tract - menorrhagia)
- Low dietary intake (vegetarian diets, infancy, elderly)
- Malabsorption: celiac disease, gastrectomy
- Increased demand: pregnancy, infancy
- Iron stores depleted first → serum ferritin falls (earliest change), no stainable marrow iron
- Serum iron falls, transferrin (TIBC) rises
- Finally: Hb synthesis impaired → microcytic, hypochromic anemia
| Test | Finding in IDA |
|---|---|
| Serum ferritin | ↓ (most sensitive single test) |
| Serum iron | ↓ |
| TIBC (transferrin) | ↑ |
| Transferrin saturation | ↓ (<15%) |
| Reticulocyte count | Low (hypoproliferative) |
| Platelet count | Often elevated |
2. Thalassemia
- Decreased Hb → underhemoglobinized microcytic, hypochromic cells
- Excess unpaired globin chains → aggregate in RBC precursors → hemolysis + ineffective erythropoiesis
| Genotype | Clinical Form | Features |
|---|---|---|
| β⁰/β⁰ or β⁺/β⁰ | β-Thalassemia major (Cooley anemia) | Severe transfusion-dependent anemia; Hb 3-6 g/dL; starts 6-9 months after birth when HbF switches to HbA |
| β⁺/β or β⁰/β | β-Thalassemia minor (trait) | Mild asymptomatic microcytic anemia; often mistaken for IDA |
| Intermediate | β-Thalassemia intermedia | Moderate; may not need transfusions |
- Severe anemia + massive hepatosplenomegaly (extramedullary hematopoiesis)
- Skeletal changes: "chipmunk facies" - frontal bossing, prominent malar eminences (marrow expansion eroding bone)
- Growth retardation, cachexia
- Secondary hemochromatosis (from transfusions + increased gut iron absorption)
| Deletions | Form | Features |
|---|---|---|
| 1 gene (-α/αα) | Silent carrier | Normal; no anemia |
| 2 genes (--/αα or -α/-α) | α-Thalassemia trait | Mild microcytic anemia |
| 3 genes (--/-α) | HbH disease | Moderate hemolytic anemia; HbH (β4 tetramers) inclusions |
| 4 genes (--/--) | Hydrops fetalis | Fatal in utero or at birth; Hb Barts (γ4 tetramers) |
3. Anemia of Chronic Disease (ACD) / Anemia of Inflammation
| Test | IDA | ACD |
|---|---|---|
| Serum ferritin | ↓ | Normal or ↑ |
| Serum iron | ↓ | ↓ |
| TIBC | ↑ | ↓ |
| Storage iron in marrow | Absent | Present (increased) |
4. Sideroblastic Anemia
- Iron stores are elevated (serum ferritin ↑, serum iron ↑, TIBC normal or low)
- Causes: Inherited (X-linked, ALA-synthase mutation), acquired (MDS, alcohol, lead, isoniazid, chloramphenicol, pyridoxine deficiency)
- Treatment: Pyridoxine (B6) for some forms; transfusion; treat underlying cause
SECTION 2: MACROCYTIC ANEMIAS (MCV > 100 fL)
5. Megaloblastic Anemia (B12 or Folate Deficiency)
- Peripheral smear: Hypersegmented neutrophils (>5 lobes, in >5% of cells) - earliest peripheral blood change
- Large oval macrocytes (macroovalocytes), MCV often >110 fL
- Pancytopenia (anemia + thrombocytopenia + neutropenia) in severe cases
- Bone marrow: hypercellular with megaloblastic erythroid precursors; giant metamyelocytes
| Feature | B12 Deficiency | Folate Deficiency |
|---|---|---|
| Hematologic | Megaloblastic anemia | Megaloblastic anemia |
| Neurologic | YES - subacute combined degeneration (posterior + lateral spinal columns): paresthesias, ataxia, cognitive decline | NO neurologic features |
| Main causes | Pernicious anemia (anti-intrinsic factor Ab), strict veganism, gastrectomy, Crohn's | Poor diet (elderly, alcoholics), pregnancy, malabsorption, drugs (methotrexate, phenytoin) |
| Folate supplementation | Corrects anemia BUT worsens or unmasks neurologic damage - must rule out B12 first | Corrects both |
| Body stores | 2-5 years | 3-4 months |
| Diagnosis | Low serum B12; elevated MMA + homocysteine | Low RBC folate; elevated homocysteine (MMA normal) |
SECTION 3: NORMOCYTIC ANEMIAS (MCV 80-100 fL)
6. Hemolytic Anemias
- Anemia + reticulocytosis (compensatory marrow response)
- ↑ LDH, ↑ indirect (unconjugated) bilirubin
- ↓ Haptoglobin
| Feature | Extravascular | Intravascular |
|---|---|---|
| Location | Spleen, liver, bone marrow macrophages | Blood vessels |
| Splenomegaly | Yes | No |
| Hemoglobinuria | No | Yes (red-brown urine) |
| Haptoglobin | ↓ | ↓↓ (severely) |
| Key examples | Spherocytosis, SCD, autoimmune | G6PD crisis, PNH, TTP/HUS |
A. Sickle Cell Disease (SCD)
- Vaso-occlusive crises: Severe bone pain (dactylitis in children), acute chest syndrome (most common cause of death), stroke, priapism, avascular necrosis of femoral head
- Chronic hemolytic anemia: Hb typically 6-10 g/dL; jaundice; gallstones (bilirubin stones)
- Autosplenectomy (by age 5-6) → increased susceptibility to encapsulated organisms (Streptococcus pneumoniae, H. influenzae)
- Renal medullary infarction, papillary necrosis → hematuria
- RBC lifespan reduced to <20 days (vs 120 days normal)
B. Hereditary Spherocytosis (HS)
C. G6PD Deficiency
D. Autoimmune Hemolytic Anemia (AIHA)
- Warm AIHA (IgG, active at 37°C): Idiopathic, SLE, CLL, drugs (methyldopa, penicillin). Extravascular hemolysis. Spherocytes on smear. Treated with steroids, rituximab, splenectomy.
- Cold AIHA (IgM, active at <37°C): Post-Mycoplasma pneumoniae, EBV (infectious mononucleosis), lymphoma. IgM activates complement → intravascular hemolysis. Treated by keeping patient warm, treating underlying cause.
E. Microangiopathic Hemolytic Anemia (MAHA)
7. Aplastic Anemia
- Idiopathic (most common, ~70%)
- Drugs: chloramphenicol, NSAIDs, sulfonamides, gold, carbamazepine
- Viruses: Hepatitis (non-A, non-B, non-C), EBV, CMV, Parvovirus B19
- Radiation/chemotherapy
- Inherited: Fanconi anemia, dyskeratosis congenita
- Severe: ANC <500/µL + platelets <20,000/µL + reticulocytes <1%
- Very severe: ANC <200/µL
- Young patients with matched sibling donor: Allogeneic stem cell transplantation (curative)
- Others: Immunosuppression - anti-thymocyte globulin (ATG) + cyclosporine + eltrombopag
- Supportive: transfusions, antibiotics, G-CSF
8. Anemia of Chronic Kidney Disease (CKD)
Summary Comparison Table
| Type | MCV | Key Lab | Key Smear Feature | Key Treatment |
|---|---|---|---|---|
| Iron deficiency | ↓ | Ferritin ↓, TIBC ↑ | Microcytic, hypochromic, pencil cells | Oral iron |
| Thalassemia | ↓ | Hb electrophoresis abnormal | Target cells, microcytic | Transfusion + chelation |
| Anemia of chronic disease | N or ↓ | Ferritin N/↑, TIBC ↓ | Mildly hypochromic | Treat cause, EPO |
| Sideroblastic | ↓ | Iron ↑, ring sideroblasts on BM | Dimorphic RBCs | Pyridoxine, transfusion |
| Megaloblastic (B12/folate) | ↑↑ | B12 ↓ or folate ↓, MMA/homocysteine ↑ | Macro-ovalocytes, hyperseg. PMN | B12/folate replacement |
| Sickle cell | N | Hb electrophoresis (HbS) | Sickle cells, target cells | Hydroxyurea, SCT |
| Hereditary spherocytosis | N | MCHC ↑, Coombs negative | Spherocytes | Splenectomy |
| G6PD deficiency | N | G6PD enzyme assay | Bite cells, Heinz bodies | Avoid triggers |
| AIHA | N | Coombs positive, ↓ haptoglobin | Spherocytes, polychromasia | Steroids, rituximab |
| MAHA | N | ↑ LDH, ↓ haptoglobin | Schistocytes (helmet cells) | Treat cause (plasma exchange in TTP) |
| Aplastic anemia | N | Pancytopenia; hypocellular BM biopsy | Normal morphology, low numbers | ATG + cyclosporine; SCT |
| CKD anemia | N | Low EPO, normal iron stores | Normal | Recombinant EPO + iron |