
Tell me basic to clinics about ECG and interpretation.
Reading File
Now let me search the medical library for comprehensive ECG content across multiple angles simultaneously.
Finding Sources
Finding Sources
Finding Sources
Finding Sources
Finding Sources
Finding Sources
Now let me read the key ECG content blocks in parallel:
Reading File
Reading File
Reading File
Now let me read the Harrison's ECG section comprehensively and also search for specific ECG patterns:
Reading File
Finding Sources
Finding Sources
Let me now read the critical Harrison's ECG section from the beginning and fetch key images:
Reading File
Loading Image
Now let me read the actual Harrison's ECG chapter content (the dedicated ECG chapter):
Finding Sources
Reading File
Reading File
Excellent - I now have a rich amount of content. Let me fetch the key ECG lead diagram and the hexaxial diagram:
Loading Image
Reading File
I now have excellent content from Harrison's and Miller's. Let me read a bit more of the Harrison's ECG chapter to cover hypertrophy, arrhythmias, and the systematic approach:
Reading File
I now have comprehensive content to write the full ECG guide. Let me fetch one more key image - the normal ECG tracing:
Loading Image
Loading Image
Here is a thorough, textbook-grounded guide to ECG from basics to clinical application.
ECG: From Basics to Clinical Interpretation
1. Why the ECG Exists - The Underlying Biology
The heart generates electrical currents with every beat. The electrocardiogram (ECG) records differences in electrical potential at the body surface caused by these currents. It is the single most widely used cardiac diagnostic test - inexpensive, immediate, and non-invasive.
The Cardiac Conduction System
The conduction system initiates and coordinates mechanical contraction. It consists of four components:
| Component | Location | Function |
|---|---|---|
| Sinoatrial (SA) node | Junction of superior vena cava and right atrium (crista terminalis) | Primary pacemaker - initiates impulses (~60-100/min) |
| Atrioventricular (AV) node | Near coronary sinus opening, atrioventricular septum | Delays impulse (~120 ms) - allows atrial kick before ventricular contraction |
| Bundle of His + Bundle Branches | Interventricular septum, splitting into right and left branches | Rapid conduction to both ventricles |
| Purkinje fibers | Subendocardial network throughout ventricles | Final distribution to ventricular myocardium; ensures near-simultaneous contraction from apex upward |
The unidirectional nature of this pathway is protected by insulating connective tissue wrapping around the conduction bundles.
The cardiac conduction system can be affected by coronary artery disease. If blood supply is disrupted, dysrhythmias may affect heart rate or contraction sequence, leading to heart failure and death. - Gray's Anatomy for Students
2. ECG Paper and Basic Setup
The Paper Grid
- Small squares: 1 mm wide = 0.04 seconds horizontally; 1 mm tall = 0.1 mV vertically
- Large squares: 5 mm wide = 0.20 seconds; 5 mm tall = 0.5 mV
- Standard paper speed: 25 mm/sec
- Standard calibration: 10 mm/mV (the calibration pulse at the start of the trace should be 10 mm tall)
The 12 Leads
The standard 12-lead ECG captures the heart's electrical activity from 12 different spatial angles - like 12 different camera views of the same event.
Limb leads (frontal plane):
- Bipolar: I (right arm → left arm), II (right arm → left leg), III (left arm → left leg)
- Augmented unipolar: aVR (right arm), aVL (left arm), aVF (left foot)
Precordial leads (horizontal plane):
V1-V6 placed across the chest:
- V1: 4th intercostal space, right sternal border
- V2: 4th intercostal space, left sternal border
- V3: between V2 and V4
- V4: 5th intercostal space, midclavicular line
- V5: anterior axillary line (same level as V4)
- V6: midaxillary line (same level as V4-V5)
"Each lead is analogous to a different video camera angle 'looking' at the same events - atrial and ventricular depolarization and repolarization - from different spatial orientations." - Harrison's Principles of Internal Medicine 22e
A positive (upright) deflection is recorded when a depolarization wave spreads toward a lead's positive pole; a negative deflection when it spreads away.
3. The Normal ECG Waveforms
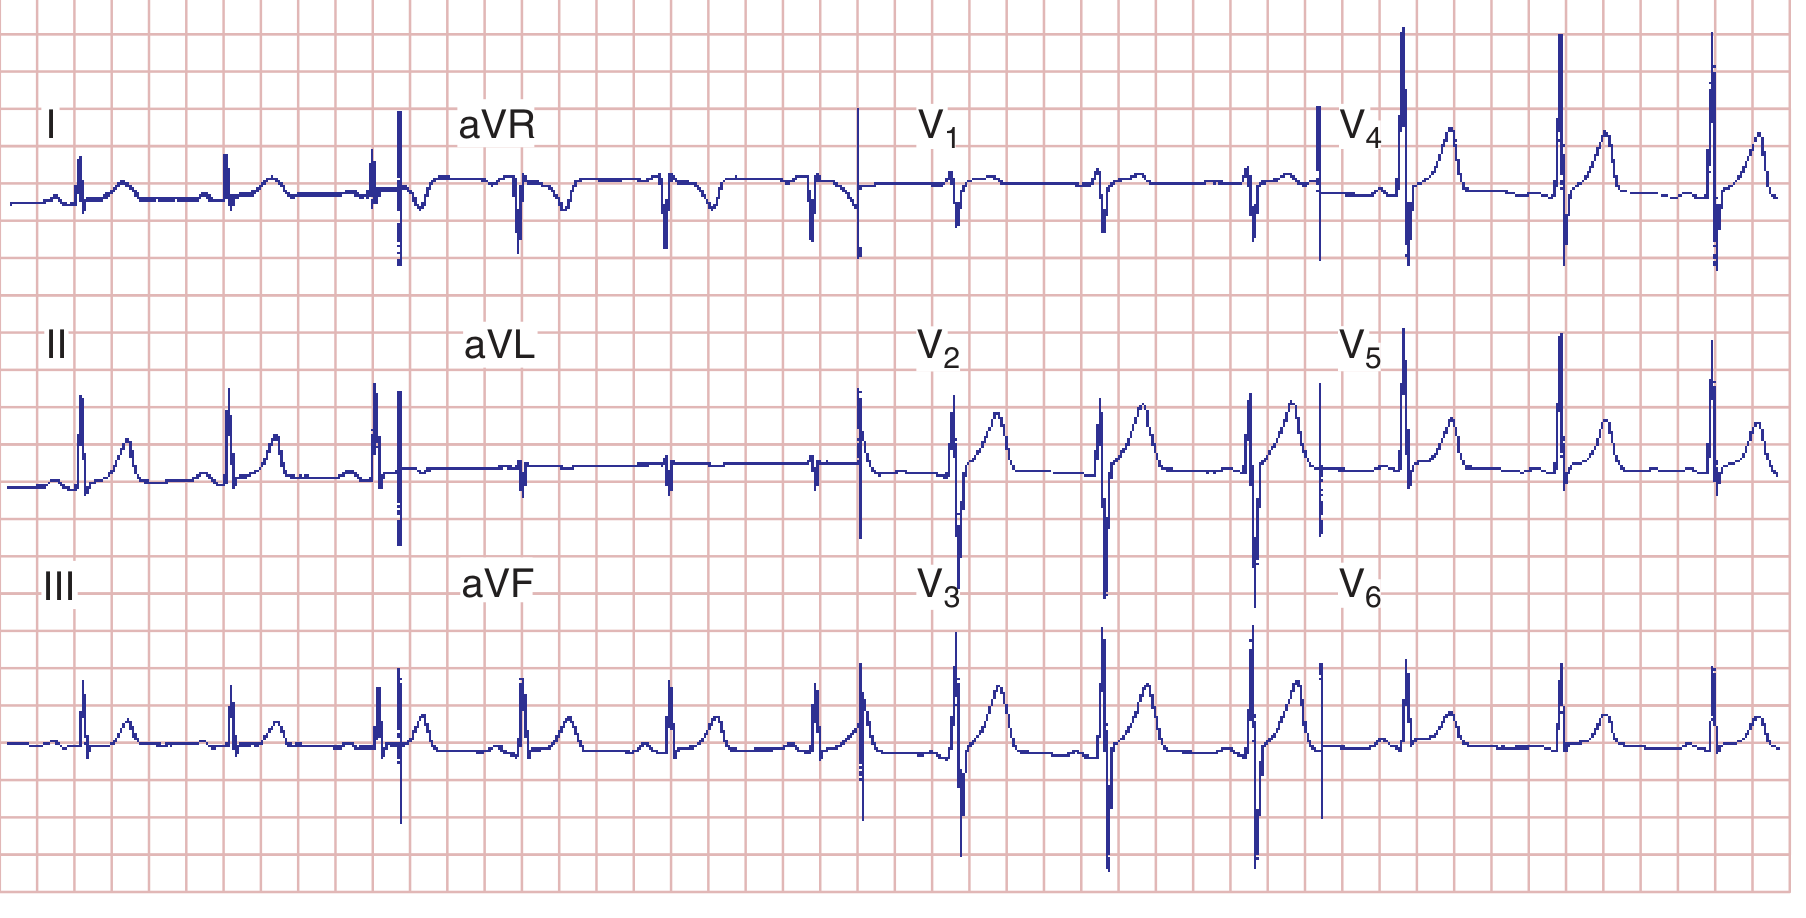
Here is a normal 12-lead ECG from Harrison's - note the upright P in II, narrow QRS, normal R-wave progression across precordial leads:
And the cardiac cycle diagram showing how ECG waveforms correlate with mechanical events:
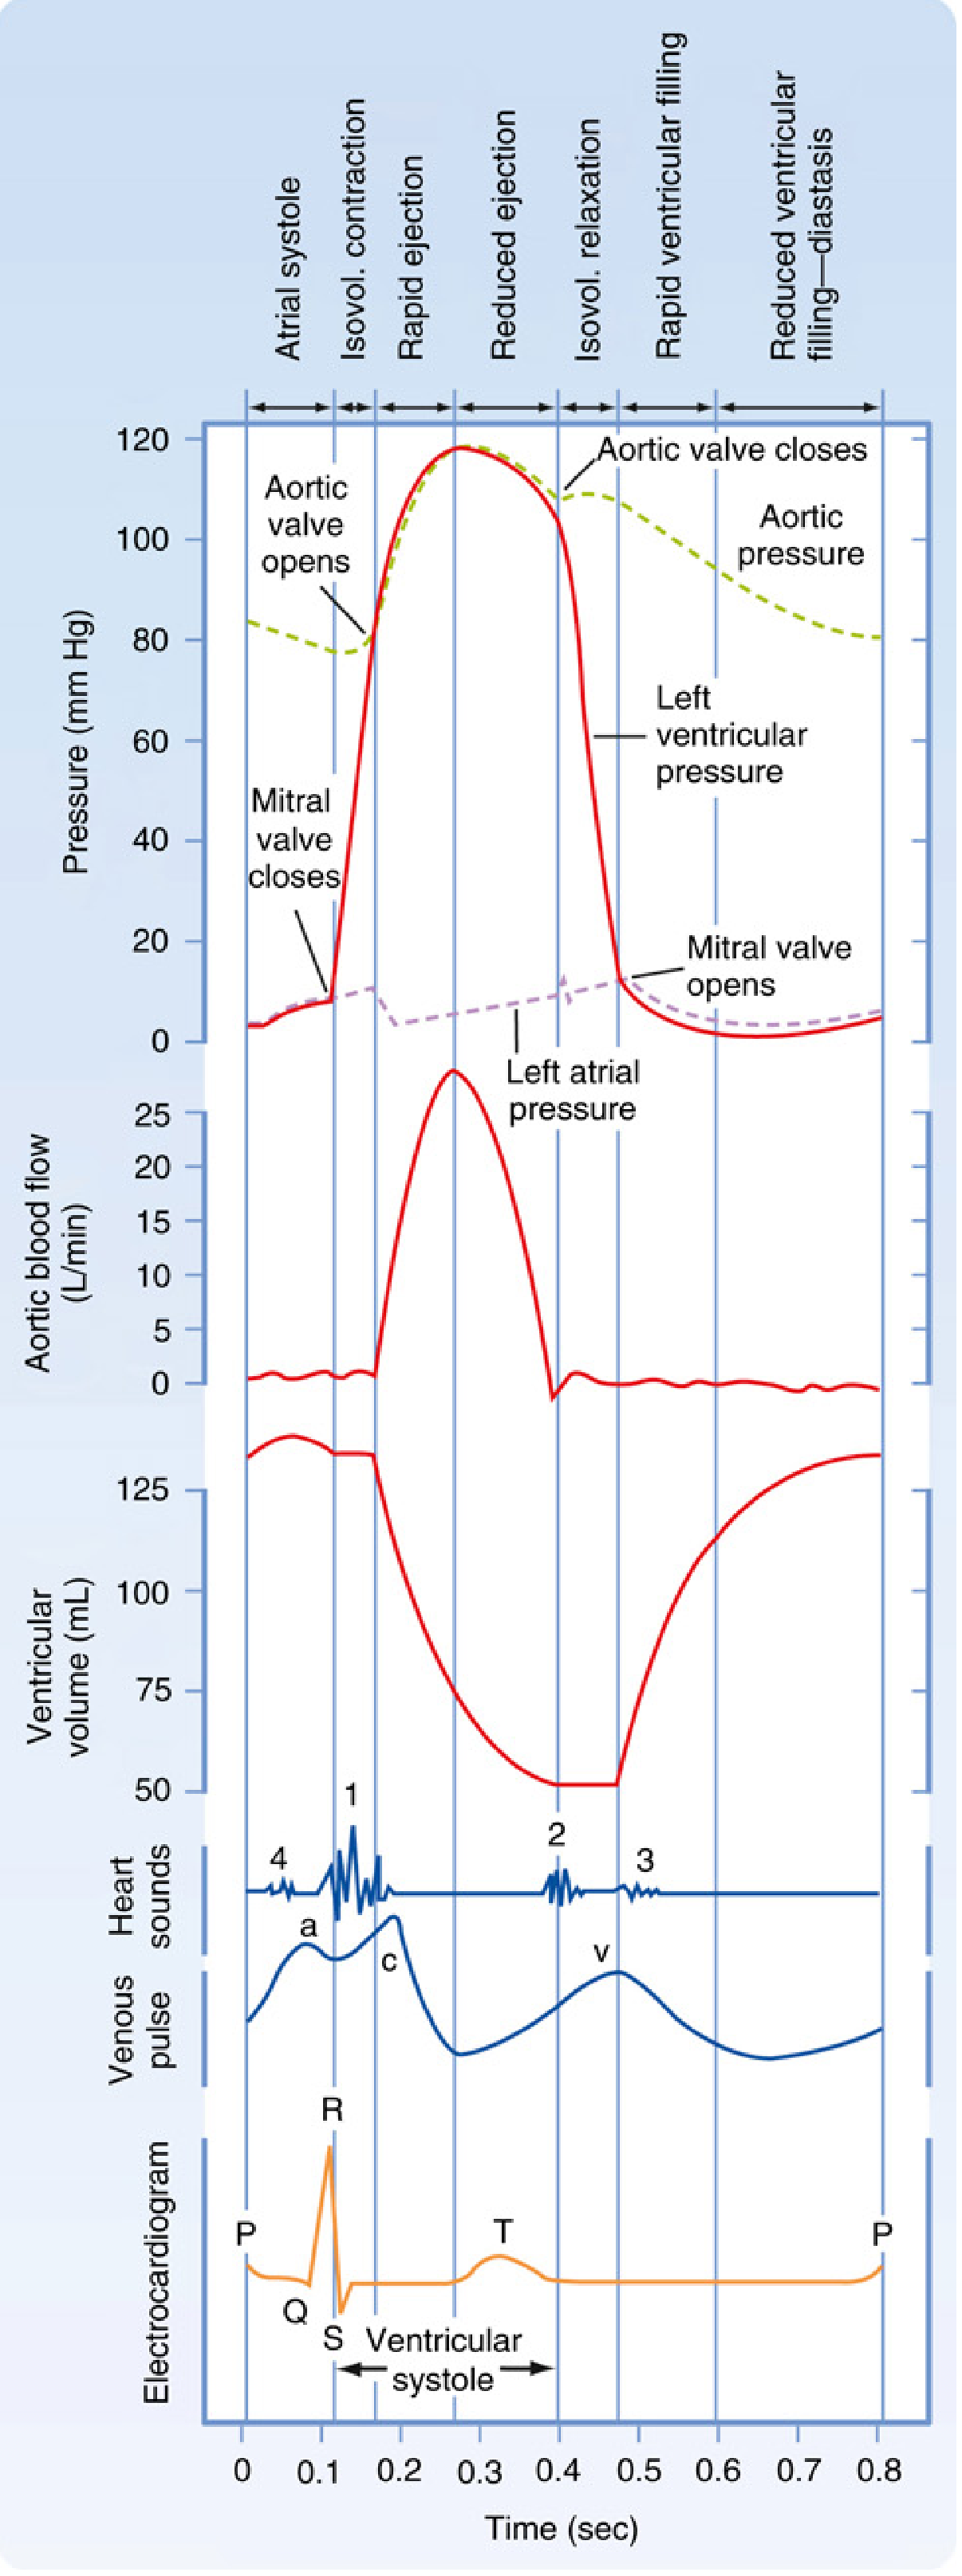
P Wave
- Represents: Atrial depolarization (SA node → right atrium → left atrium)
- Normal: Upright in II, inverted in aVR; duration < 120 ms; amplitude < 2.5 mm
- The normal P in V1 is often biphasic - positive component = RA depolarization; small negative terminal component = LA depolarization
- Retrograde P waves (negative in II, positive in aVR) indicate ectopic atrial or junctional pacemaker
PR Interval
- Represents: Time from atrial depolarization onset to start of ventricular depolarization - includes the AV nodal delay
- Normal: 120-200 ms (3-5 small squares)
- Short PR (<120 ms): pre-excitation (WPW), junctional rhythm
- Long PR (>200 ms): 1st degree AV block
QRS Complex
- Represents: Ventricular depolarization
Ventricular depolarization occurs in two sequential phases:
- Phase 1 - Septal depolarization: Left-to-right, anteriorly → produces small "septal r" in V1, small "septal q" in V6
- Phase 2 - Main ventricular depolarization: LV dominates, vector goes left and posteriorly → large S in V1, tall R in V6
QRS Definitions:
- Q wave: First negative deflection before R
- R wave: First positive deflection
- S wave: Negative deflection after R
- Use uppercase for large (>5 mm), lowercase for small waves
Normal values:
- Duration: < 120 ms (< 3 small squares)
- Pathologic Q wave: depth > 1/4 of R wave, or width ≥ 40 ms in 2 contiguous leads
ST Segment
- Represents: Early ventricular repolarization (phase 2 of action potential)
- Normal: Isoelectric (at baseline)
- Deviation is the hallmark of ischemia/infarction (see section 7)
T Wave
- Represents: Ventricular repolarization (phase 3)
- Normal: Upright in I, II, V3-V6; may be inverted in aVR, aVL, V1, III
- Direction is normally same as the main QRS deflection ("concordant")
QT Interval
- Represents: Total ventricular repolarization
- Normal (corrected QTc): < 440 ms in men, < 460 ms in women
- Corrected using Bazett formula: QTc = QT / √RR
- Prolonged QTc → risk of Torsades de Pointes (polymorphic VT)
- Causes of long QT: drugs (antiarrhythmics, macrolides, antipsychotics), hypokalemia, hypomagnesemia, hypocalcemia, congenital
U Wave
- Small, rounded deflection after T wave
- Most visible in V2-V3
- Prominent U wave: hypokalemia, bradycardia
- Inverted U wave: ischemia, LVH
4. Heart Rate Calculation
| Method | Formula | When to Use |
|---|---|---|
| 300 rule | 300 ÷ (number of large squares between R-R) | Regular rhythms, quick calculation |
| 1500 rule | 1500 ÷ (number of small squares between R-R) | Regular rhythms, more precise |
| 6-second strip | Count QRS complexes in 6 sec × 10 | Irregular rhythms (e.g., AF) |
Normal range: 60-100 bpm
- Bradycardia: < 60 bpm
- Tachycardia: > 100 bpm
5. Electrical Axis
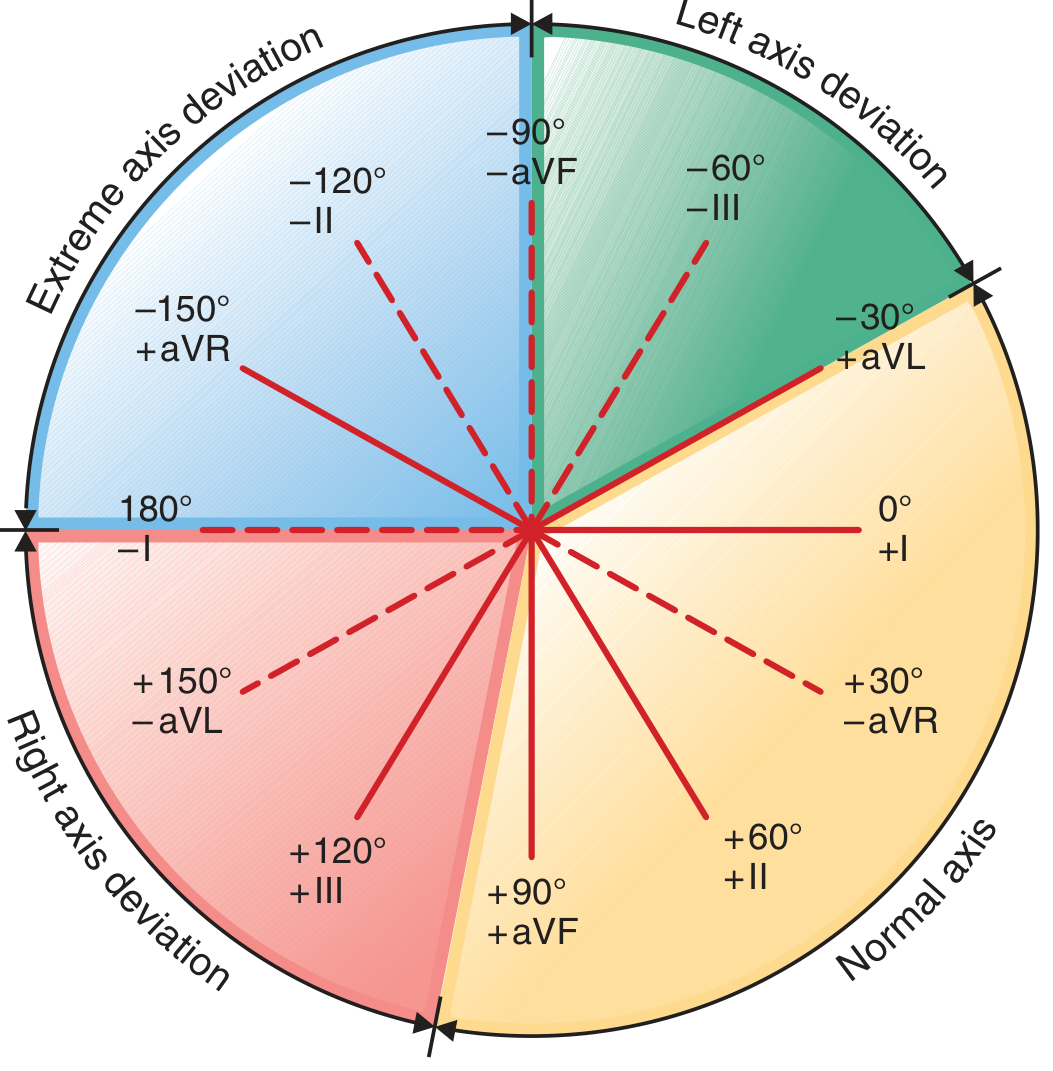
The mean QRS electrical axis describes the average direction of ventricular depolarization in the frontal plane.
| Axis Range | Category |
|---|---|
| -30° to +90°/+100° | Normal |
| More negative than -30° | Left axis deviation (LAD) |
| More positive than +90° to +100° | Right axis deviation (RAD) |
| -90° to +180° (northwest) | Extreme/indeterminate axis |
Quick Axis Check (Lead I + aVF method):
| Lead I | aVF | Axis |
|---|---|---|
| Positive | Positive | Normal (0° to +90°) |
| Positive | Negative | Left axis (-30° if borderline, needs Lead II) |
| Negative | Positive | Right axis deviation |
| Negative | Negative | Extreme axis deviation |
Common causes:
- LAD: Left ventricular hypertrophy, left anterior fascicular block (most common cause of marked LAD; axis < -45°), inferior MI, WPW
- RAD: Right ventricular hypertrophy, left posterior fascicular block, lateral MI, pulmonary embolism, normal variant in young/thin patients
"Left anterior fascicular block (QRS axis more negative than -45°) is probably the most common cause of marked left axis deviation in adults." - Harrison's 22e
6. Systematic Interpretation - The 14-Parameter Approach
Harrison's recommends analyzing every ECG with these 14 parameters in order:
- Standardization/calibration - Is the calibration pulse correct (10 mm = 1 mV)? Any artifacts? Lead placement errors?
- Rhythm - Sinus or non-sinus? Regular or irregular?
- Heart rate - Calculate using R-R intervals
- PR interval - AV conduction time (normal 120-200 ms)
- QRS interval - Narrow (<120 ms) or wide (≥120 ms)?
- QT/QTc - Measure and correct for rate
- Mean QRS electrical axis - Use hexaxial diagram
- P waves - Morphology: size, shape, relationship to QRS
- QRS voltages - Increased (hypertrophy) or decreased (effusion, obesity, emphysema)?
- Precordial R-wave progression - Normally increases from V1 to V5; poor progression suggests anterior MI
- Abnormal Q waves - Width ≥ 40 ms or depth > 1/4 R in ≥2 contiguous leads = pathological
- ST segments - Elevation or depression vs. baseline?
- T waves - Direction, symmetry, height
- U waves - Prominent or inverted?
"Many mistakes in ECG interpretation are errors of omission. Therefore, a systematic approach is essential." - Harrison's Principles of Internal Medicine 22e
7. Key Clinical Patterns
A. Chamber Hypertrophy
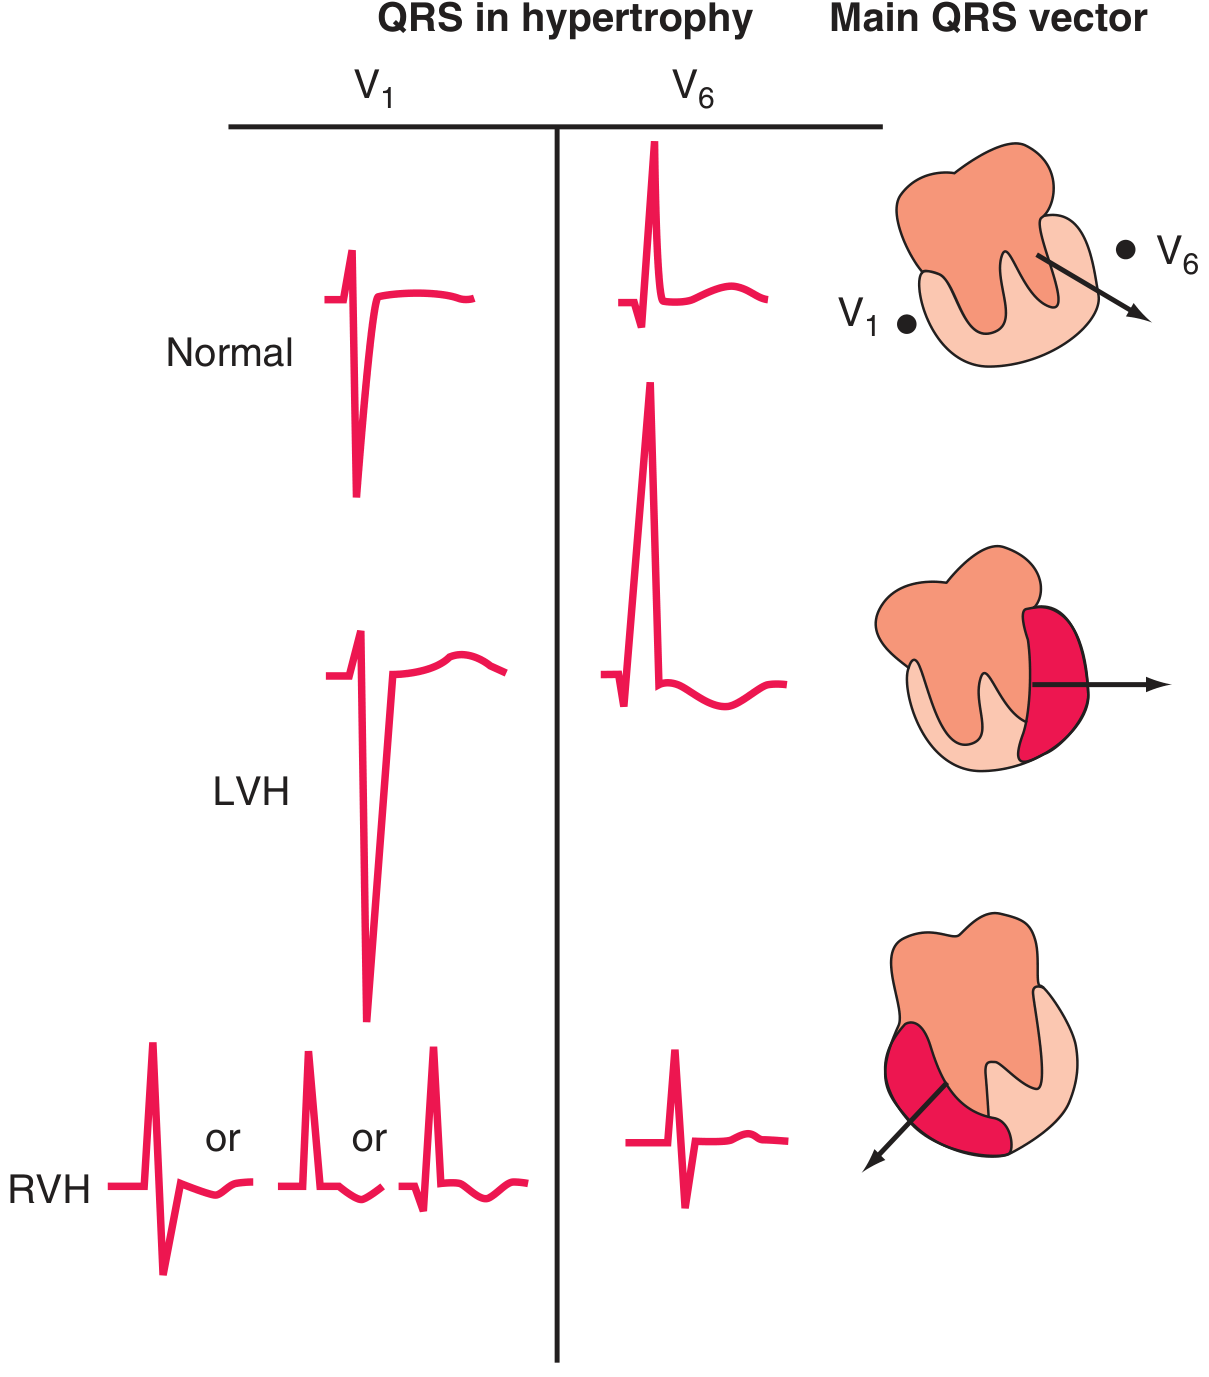
Left Ventricular Hypertrophy (LVH):
- Increased voltage (Sokolow-Lyon criteria: S in V1 + R in V5/V6 ≥ 35 mm)
- Left axis deviation
- ST depression + T-wave inversion in lateral leads (I, aVL, V5-V6) - "strain" pattern
- Broad, notched P wave in limb leads ± biphasic P in V1 (left atrial enlargement, often accompanies LVH)
Right Ventricular Hypertrophy (RVH):
- Tall R wave in V1 (R > S in V1)
- Right axis deviation (usually >+110°)
- ST depression + T-wave inversion in V1-V3 (right "strain" pattern)
- Often with right atrial enlargement (tall, peaked P wave in II ≥ 2.5 mm - "P pulmonale")
Right atrial (RA) overload: tall, peaked P waves in limb or precordial leads
Left atrial (LA) abnormality: broad, notched P waves in limb leads ("P mitrale"); biphasic P in V1 with prominent negative terminal deflection (>1 mm² area)
B. Bundle Branch Blocks
Right Bundle Branch Block (RBBB) - QRS ≥ 120 ms:
- RSR' ("rabbit ears" or "M" pattern) in V1-V2 - the classic finding
- Wide, slurred S wave in I, aVL, V5-V6
- ST depression + T inversion in V1-V2
Left Bundle Branch Block (LBBB) - QRS ≥ 120 ms:
- Broad, notched R in I, aVL, V5-V6 ("M" or plateau shape)
- Absent septal q in lateral leads
- QS or rS in V1
- Secondary ST-T changes opposite to main QRS direction (discordant)
- LBBB makes ischemia very difficult to interpret (see Sgarbossa criteria for suspected STEMI in LBBB)
Incomplete BBB: same morphology but QRS 110-119 ms
Fascicular Blocks:
- Left anterior fascicular block (LAFB): Marked LAD (axis < -45°), small r in II, III, aVF; small q in I, aVL; QRS duration minimally prolonged
- Left posterior fascicular block (LPFB): Marked RAD (axis > +110°); rare in isolation; must exclude RVH, lateral MI, pulmonary disease
Bifascicular block = RBBB + LAFB (most common) or RBBB + LPFB
Trifascicular block = bifascicular block + 1st degree AV block (or alternating BBB)
C. AV Conduction Abnormalities
| Block | ECG Features | Clinical Significance |
|---|---|---|
| 1st degree AV block | PR > 200 ms; every P conducts | Often benign; digoxin, inferior MI, vagal tone |
| 2nd degree - Mobitz I (Wenckebach) | Progressive PR lengthening → dropped QRS, then resets | Usually benign; AV nodal level; may occur in inferior MI |
| 2nd degree - Mobitz II | Constant PR; sudden non-conducted P wave without warning | More serious; infranodal level; risk of complete block |
| 3rd degree (complete AV block) | No relationship between P and QRS; escape rhythm (ventricular 20-40 bpm or junctional 40-60 bpm) | Emergency; requires pacing |
D. Myocardial Ischemia and Infarction
Ischemia alters the resting membrane potential and action potential duration, creating "currents of injury" visible as ST segment deviation.
STEMI (transmural ischemia):
- ST vector shifts toward ischemic epicardium → ST elevation in leads facing the injured zone
- Reciprocal ST depression in opposite leads
- Followed (hours to days) by T-wave inversion, then Q wave development
NSTEMI/subendocardial ischemia:
- ST vector toward subendocardium → ST depression in overlying leads
- ST elevation in aVR (global subendocardial ischemia = left main or proximal LAD lesion)
Localization of STEMI by lead territory:
| Territory | Leads with ST elevation | Artery |
|---|---|---|
| Anterior | V1-V4 | LAD |
| Anterolateral | V1-V6, I, aVL | LAD or proximal LCx |
| Lateral | I, aVL, V5-V6 | LCx or diagonal |
| Inferior | II, III, aVF | RCA (usually), or LCx |
| Posterior (indirect) | ST depression V1-V3 + prominent R in V1 | RCA or LCx |
| Right ventricular | ST elevation V4R | Proximal RCA |
Evolutionary changes of STEMI:
- Hyperacute T waves (minutes) - tall, broad, peaked T waves
- ST elevation (minutes-hours)
- T-wave inversion (hours-days)
- Pathological Q waves (hours-days, may persist permanently)
"When the acute ischemia is transmural, the ST vector usually is shifted in the direction of the outer (epicardial) layers, producing ST elevations and sometimes, in the earliest stages of ischemia, tall, positive so-called hyperacute T waves." - Harrison's 22e
E. Common Arrhythmias - ECG Recognition
Sinus rhythms:
- Sinus tachycardia: Rate >100, normal P morphology, regular
- Sinus bradycardia: Rate <60, normal P morphology
- Sinus arrhythmia: Regular P-QRS but RR varies with respiration (normal in young patients)
Atrial arrhythmias:
- PAC (premature atrial complex): Premature P wave (may be abnormal shape), narrow QRS (unless aberrant), followed by incomplete compensatory pause
- Atrial flutter: Sawtooth flutter waves (F waves) at ~300 bpm, typically with 2:1, 3:1, or 4:1 block; regular or regularly irregular
- Atrial fibrillation: Absent P waves, chaotic fibrillatory baseline, irregularly irregular narrow QRS
Junctional rhythms:
- Narrow QRS; P absent, buried in QRS, or retrograde (inverted in II, III, aVF)
- Rate 40-60 bpm (junctional escape) or >60 bpm (accelerated junctional)
Ventricular arrhythmias:
- PVC (premature ventricular complex): Wide, bizarre QRS > 120 ms, no preceding P, T wave opposite main deflection, full compensatory pause
- Ventricular tachycardia (VT): ≥3 consecutive wide complex beats at >100 bpm; AV dissociation (P marching through, capture/fusion beats) confirms VT
- Ventricular fibrillation (VF): Chaotic, irregular broad deflections; no organized QRS; cardiac arrest
WPW (Wolff-Parkinson-White):
- Short PR (<120 ms)
- Delta wave (slurred initial QRS upstroke)
- Wide QRS
- Secondary ST-T changes
- At-risk for rapid AF conducting down the accessory pathway → VF
F. Other Important Patterns
Pulmonary Embolism:
- Most common: Sinus tachycardia
- Classic (but insensitive): S1Q3T3 pattern - deep S in I, Q wave and T inversion in III
- New RBBB or right axis shift
- T-wave inversions V1-V4 (right heart strain)
- AF may occur
Hyperkalemia (progressive changes with rising K⁺):
- Tall, peaked, narrow ("tented") T waves (K⁺ ~5.5-6.5)
- PR prolongation, P wave flattening (K⁺ ~6.5-7.0)
- Wide QRS (K⁺ ~7.0+) - sine wave pattern
- VF / asystole (K⁺ > 8-9)
Hypokalemia:
- Prominent U waves (U > T in same lead)
- ST depression, T-wave flattening
- Long QU interval (mistaken for long QT)
Hypercalcemia: Short QT, short ST segment
Hypocalcemia: Long QT due to long ST segment (T wave normal)
Pericarditis:
- Diffuse (saddle-shaped) ST elevation in multiple leads (not conforming to one coronary territory)
- PR depression (most specific sign)
- Reciprocal changes only in aVR and V1
Brugada pattern:
- Coved-type ST elevation ≥2 mm in V1-V2 with RBBB morphology
- Risk of sudden cardiac death from VF, especially at rest/during fever
Digitalis effect (not toxicity):
- Scooped ("reverse tick" / "Salvador Dali mustache") ST depression - most noticeable in V5-V6
- Shortened QT
- Digitalis toxicity: almost any arrhythmia possible (PAT with block is classic)
8. Computerized ECG Interpretation
Automated computer analysis is widely used for storage and immediate retrieval. However, fully automated ECG interpretations have major limitations and should always be reviewed by a clinician. The patient's age, sex, and clinical context must always be integrated - the ECG is a tool, not a diagnosis.
Summary: Stepwise Approach to Any ECG
1. Calibration check (10 mm = 1 mV; 25 mm/s)
2. Rhythm: P present? Regular? P:QRS ratio?
3. Rate: count R-R intervals
4. PR interval (normal 120-200 ms)
5. QRS width (narrow <120 ms or wide ≥120 ms?)
6. QTc (correct for rate; normal <440 ms men, <460 ms women)
7. Axis (Lead I + aVF; hexaxial diagram)
8. P wave morphology (size, shape)
9. QRS voltages (high = hypertrophy; low = effusion/COPD)
10. R-wave progression across chest leads (V1→V6)
11. Abnormal Q waves (pathological ≥40 ms or >25% R height)
12. ST segments (elevation/depression; shape)
13. T waves (axis, symmetry, height)
14. U waves (prominent or inverted?)
→ Correlate with CLINICAL CONTEXT always
Sources: Harrison's Principles of Internal Medicine 22e (2025) - Chapter 247; Miller's Anesthesia 10e - Chapter 13; Gray's Anatomy for Students; Braunwald's Heart Disease
---That covers ECG from the ground up. Here is a quick orientation to what was covered and where to go next:
What this guide covered:
| Section | Key Takeaway |
|---|---|
| Conduction system | SA node → AV node → His bundle → Bundle branches → Purkinje fibers. Each step maps to a waveform. |
| ECG paper | Small box = 0.04 s / 0.1 mV; large box = 0.20 s / 0.5 mV |
| Waveforms | P = atrial depolarization; QRS = ventricular depolarization; T = ventricular repolarization; U = afterpotentials |
| Normal intervals | PR 120-200 ms; QRS < 120 ms; QTc < 440/460 ms |
| Axis | Normal -30° to +90/100°. Use Lead I + aVF as the quick screen. |
| 14-step approach | Harrison's gold-standard systematic method - never skip steps to avoid errors of omission |
| LVH/RVH | Voltage criteria + repolarization "strain" patterns |
| Bundle blocks | RBBB = RSR' in V1; LBBB = broad R in laterals, masks ischemia |
| AV blocks | 1st (long PR) → Wenckebach (PR lengthening) → Mobitz II (sudden drop) → 3rd (complete dissociation) |
| Ischemia/MI | STEMI = ST elevation in culprit territory + reciprocal depression; localize by lead group |
| Arrhythmias | AF (irregular, no P), flutter (sawtooth), VT (wide complex, AV dissociation), WPW (delta wave) |
| Electrolytes/drugs | Hyperkalemia (peaked T → wide QRS), hypokalemia (U waves), digitalis (scooped ST), Brugada pattern |
If you want me to go deeper on any one topic - such as a full arrhythmia classification, Sgarbossa criteria for STEMI in LBBB, long QT drug lists, or pediatric ECG differences - just ask.
This is a shared conversation. Sign in to Orris to start your own chat.