
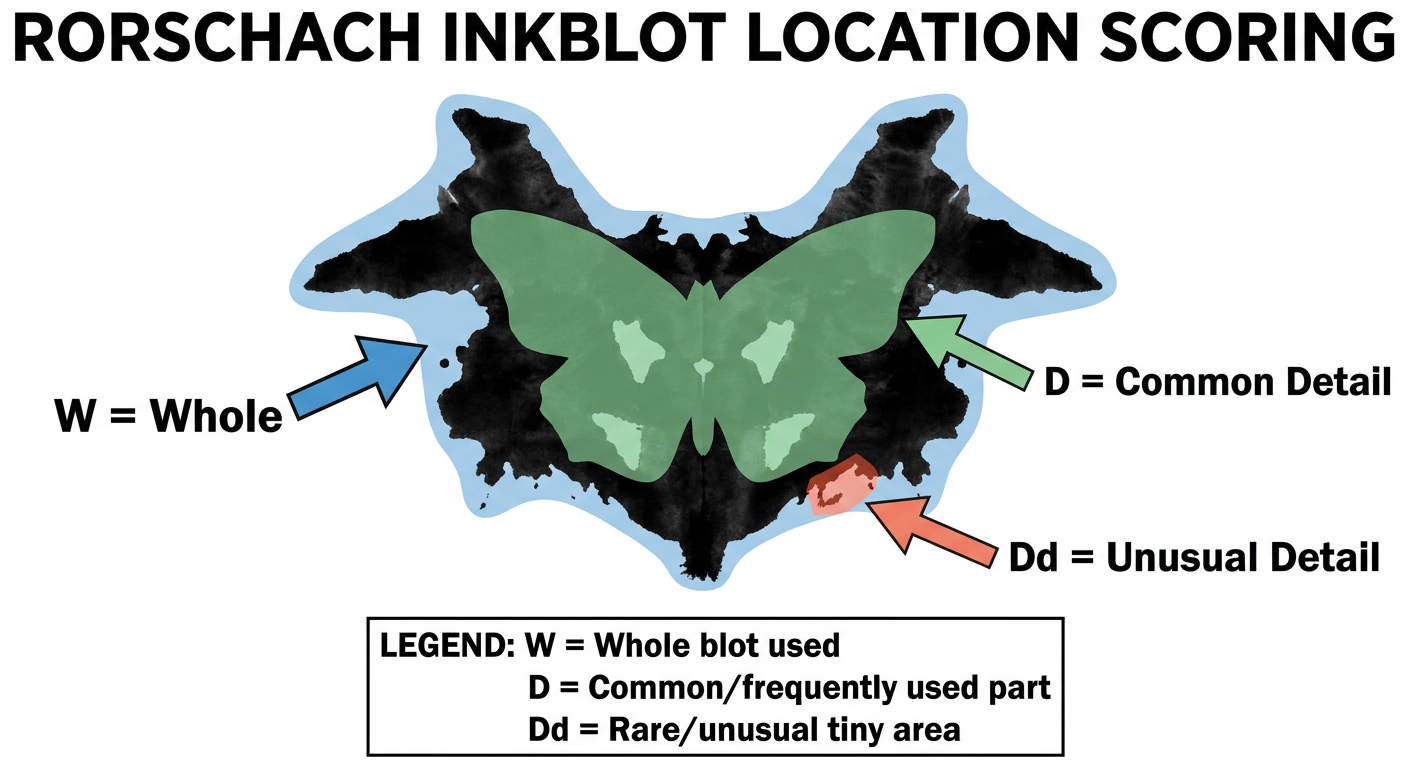
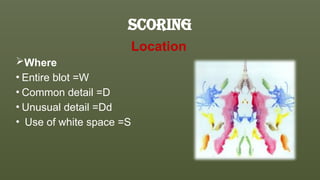
Step 3: Coding the Responses The psychologist codes each response according to specific variables. A. Location Which part of the blot was used? Whole blot (W) Common detail (D) Unusual detail (Dd) Example: Entire blot = W Small corner only = Dd----explain in detail with pictures
Rorschach inkblot test location scoring W D Dd whole detail coding explained
Rorschach inkblot location codes W D Dd examples images psychology
An educational psychology diagram showing Rorschach inkblot location scoring. Show a symmetric black inkblot (Card I style bat/butterfly shape) divided into three labeled regions with colored overlays and arrows: 1) The ENTIRE blot highlighted in light blue with a large label "W = Whole" and arrow pointing to the full shape, 2) A large obvious central section highlighted in green with label "D = Common Detail" and arrow, 3) A tiny corner or edge fragment highlighted in red/orange with label "Dd = Unusual Detail" and arrow. Include a legend at the bottom explaining each: W=Whole blot used, D=Common/frequently used part, Dd=Rare/unusual tiny area. Clean white background, academic diagram style, clear bold labels.
Step 3A: Location Coding - Which Part of the Blot Was Used?
The All 10 Rorschach Cards (for reference):

The Three Main Location Codes
1. W - Whole Blot
| Feature | Detail |
|---|---|
| Symbol | W |
| Full Name | Whole |
| What it means | The person uses the entire inkblot to form their response - nothing is excluded |
| Example | "The whole thing looks like a bat with wings spread out" (Card I - uses every part of the blot) |
| What it reflects | Ability to integrate information, big-picture thinking, organizational ability |
- A high number of W responses suggests the person is ambitious, thinks holistically, and tries to make sense of their entire environment at once
- Too many W responses can also reflect overreaching or difficulty with details
- W responses are expected and normal - most people give at least some
2. D - Common Detail
| Feature | Detail |
|---|---|
| Symbol | D |
| Full Name | Common Detail (also called "Popular Detail") |
| What it means | The person uses a frequently chosen, obvious part of the blot - a large, clearly defined section that most people notice |
| Example | On Card I, pointing only to the large wing-like areas on both sides = D. On Card II, pointing only to the two large dark shapes = D |
| What it reflects | Practical, grounded thinking; attention to obvious and conventional features |
- D responses show the person engages with what is most salient and recognizable
- A healthy protocol has a mixture of W and D
- D responses are the most common location type in a normal population
- High D counts suggest a practical, reality-oriented approach to problems
3. Dd - Unusual (Rare) Detail
| Feature | Detail |
|---|---|
| Symbol | Dd |
| Full Name | Unusual Detail (also called Rare Detail, Minor Detail) |
| What it means | The person responds to a small, uncommon, or marginal area that most people overlook - a tiny corner, a thin edge, a gap, an unusual speck |
| Example | Pointing only to a tiny notch on the top edge of Card I and saying "that little bump looks like a rabbit ear" = Dd |
| What it reflects | Unconventional thinking, hyper-attention to minute details, sometimes obsessive or idiosyncratic processing |
- Occasional Dd is fine and shows nuanced perception
- Excessive Dd responses can suggest obsessive tendencies, anxiety, or avoidance of the obvious
- Some Dd responses demonstrate creativity; others reveal fragmented, scattered attention
Bonus Code: S - White Space
- Example: "I see a vase in the white space between the two dark shapes" = S (or DS/WS when combined with ink areas)
- Often associated with oppositional tendencies or seeing things differently from others
Summary Table
| Code | Name | Definition | Example | Psychological Implication |
|---|---|---|---|---|
| W | Whole | Entire blot used | "The whole thing is a bat" | Holistic thinking, ambition, integration |
| D | Common Detail | Large, obvious, frequently used section | "Just these two side shapes look like dogs" | Practical, grounded, conventional thinking |
| Dd | Unusual Detail | Small, rare, obscure part of the blot | "This tiny speck looks like an ant" | Obsessive detail, unconventional perception, creativity or anxiety |
| S | White Space | Empty white areas used | "The white part in the center looks like a mask" | Oppositionality, independence, resistance |
Why Location Matters Clinically
- A person who only uses W might be overly ambitious or struggling to analyze specific components of their world
- A person who only uses Dd might be anxious, avoidant, or obsessing over minor details while missing the big picture
- A balanced mix of W and D with occasional Dd is considered healthy and adaptive
R-PAS has a standardized interpretive frameworkin in detail with images
R-PAS Rorschach Performance Assessment System standardized interpretive framework pages variables 2024
R-PAS interpretive framework Page 1 Page 2 domains variables scoring profile explained
R-PAS Rorschach Performance Assessment System validity interpretive
https://www.guilford.com/excerpts/mihura.pdf
A detailed educational diagram of the R-PAS (Rorschach Performance Assessment System) standardized interpretive framework showing two profile pages. Left side labeled "Page 1 Profile" with four color-coded domain boxes stacked vertically: 1) Blue box "Administration Behaviors & Observations" (Pr, Pu, CT), 2) Green box "Engagement & Cognitive Processing" (Complexity, W%, Dd%, SI, IntCont, Vg%, V, FD), 3) Orange box "Perception & Thinking Problems" (EII-3, TP-Comp, WSumCog, SevCog, FQ-%, WD-%, FQo%), 4) Purple box "Stress & Distress" (YTVC', m, Y, MOR, SC-Comp). Right side labeled "Page 2 Profile" with same four domains but showing different variables. Center shows a standard score bell curve with mean=100 and SD=15, showing zones: Below 70 (Very Low), 70-85 (Low), 85-115 (Average), 115-130 (High), Above 130 (Very High). Include arrows and icons. Academic, clean, white background, professional psychology textbook style.
A visual diagram showing the R-PAS "4S Interpretive Procedure" - four sequential steps in a flowchart: Step 1 "SCAN" (a magnifying glass icon, scan profile for elevated scores), Step 2 "SIFT" (a filter/funnel icon, sift for most important findings), Step 3 "SYNTHESIZE" (a brain/network icon, synthesize into coherent picture of the person), Step 4 "SUMMARIZE" (a document/report icon, summarize in written report). Show arrows connecting each step. Use distinct colors: blue for Scan, green for Sift, orange for Synthesize, purple for Summarize. Include brief description under each step. Clean white background, professional academic diagram style.
An educational psychology infographic showing the 4 interpretive domains of R-PAS (Rorschach Performance Assessment System) arranged in four quadrants on white background: Top-left quadrant in blue: "Domain 1: Engagement & Cognitive Processing" with icons of a brain and gears - bullet points: Complexity of thinking, Use of whole vs detail, Synthesizing ability, Vagueness, Visual processing; Top-right quadrant in red-orange: "Domain 2: Perception & Thinking Problems" with icon of an eye and warning sign - bullet points: Perceptual accuracy (FQ), Thought disorder, Cognitive slippage, Psychosis markers, Reality testing; Bottom-left quadrant in purple: "Domain 3: Stress & Distress" with icon of a person under pressure - bullet points: Emotional overwhelm, Anxiety/tension, Morbid content, Situational stress, Suicide constellation; Bottom-right quadrant in green: "Domain 4: Self & Other Representation" with icon of two people - bullet points: Self-concept, Body image, Relationship quality, Dependency, Aggression, Attachment style. Center circle shows "R-PAS 4 Domains" in bold. Clean, professional, academic style.