
General microbiology
What aspect of general microbiology are you interested in? · What is your goal?
bacterial cell structure gram positive gram negative wall
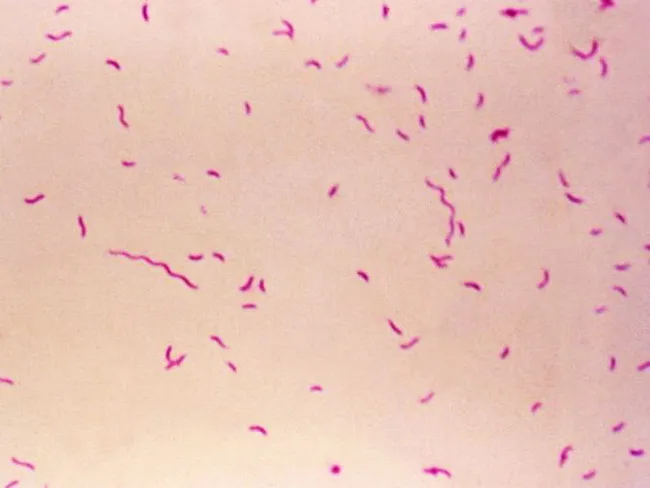
Bright-field light microscopy of a Gram-stained bacterial smear reveals numerous small, slender, curved Gram-negative rods with a characteristic gull-wing appearance consistent with Campylobacter species. The image captures bacteria oriented individually and in small clusters against a pale pink counterstain, illustrating Bacillary morphology typical of enteric pathogens. Gram staining shows purple/blue rods (crystal violet retained by cell wall) with a light pink background from the counterstain (safranin), enabling discrimination from Gram-positive organisms. The organisms appear slender and curved, with a single polar flagellum suggested by motility or alignment in the smear. Specimen type is a bacterial smear obtained from a gastrointestinal sample (feces or culture isolate), prepared for diagnostic microbiology. The imaging modality is bright-field microscopy at high magnification (approximately 1000x with oil immersion), following Gram staining to highlight bacterial cell wall structure. Clinically, detection of Campylobacter species supports infectious gastroenteritis; in the IPSID (immunoproliferative small intestinal disease) context, Campylobacter involvement has been proposed as a pathogenic trigger mirroring Helicobacter pylori's role in gastric MALT lymphoma. Differential diagnoses include Helicobacter, Vibrio, and other curved Gram-negative bacteria. This image serves educational and diagnostic utility for microbiology, clinical pathology, gastroenterology, and infectious disease research.
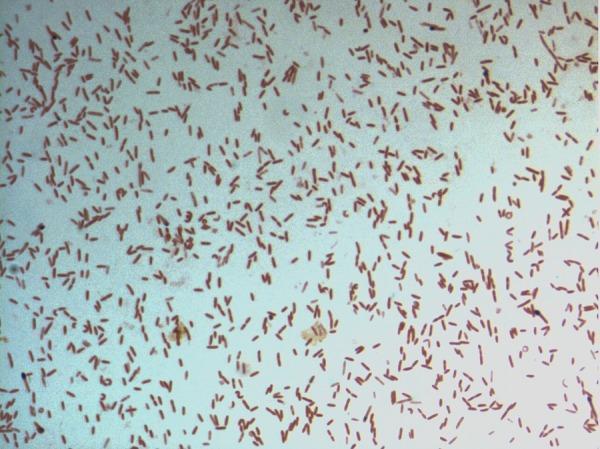
This diagnostic image shows a light microscopy view of a bacterial culture following Gram staining. The specimen displays numerous small, rod-shaped (bacilli) bacteria distributed across the field. The microorganisms exhibit a consistent pink-to-red hue, identifying them as Gram-negative. This staining characteristic indicates a cell wall structure with a thin peptidoglycan layer and an outer membrane that does not retain the crystal violet stain. The arrangement of the bacilli is predominantly individual or scattered, with occasional small clusters and pairs. Specifically identified as D. fastidiosa strain JC13T, this image serves as a primary microbiological reference for the morphological and staining properties of this novel genus within the family Erysipelotrichaceae. The visual demonstrates key diagnostic features including cell morphology, arrangement, and Gram reaction, which are essential for clinical microbiology classification and initial pathogen identification.
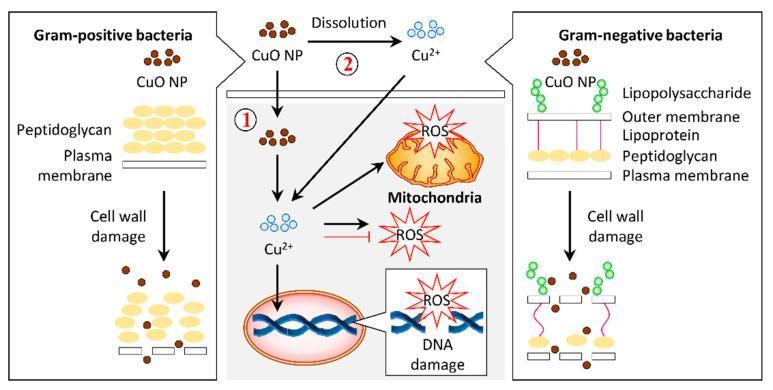
A pathophysiology diagram illustrating the antibacterial mechanisms of copper oxide nanoparticles (CuO NPs) on Gram-positive and Gram-negative bacteria. The left panel shows Gram-positive bacteria with a thick peptidoglycan layer above a plasma membrane. The right panel shows Gram-negative bacteria with a complex cell wall including lipopolysaccharides, an outer membrane, lipoproteins, and a thin peptidoglycan layer. Both panels demonstrate CuO NPs causing cell wall damage and lysis. The central panel details the intracellular bactericidal pathway labeled as mechanism 1 and 2. Mechanism 1 involves the internalization of CuO NPs into the cytosol, while mechanism 2 illustrates the dissolution of CuO NPs into copper ions (Cu2+) which then permeate the cell. Inside the cell, both Cu2+ ions and CuO NPs induce the production of reactive oxygen species (ROS). The resulting oxidative stress leads to mitochondrial disruption and DNA damage, ultimately resulting in cell death. This infographic highlights the role of nanoparticle morphology and ion release in targeting bacterial structural and metabolic integrity.
viral replication cycle attachment penetration uncoating assembly release
![A pathophysiology diagram illustrating the replication cycle of the SARS-CoV-2 virus (2019-nCoV) within a host cell and identifying potential therapeutic intervention points. The schematic depicts the virus engaging cell surface receptors ACE2 and CD147, followed by entry via endosomal or non-endosomal pathways. Once inside, the process of uncoating releases genomic positive-strand RNA [(+) RNA], which undergoes translation and transcription. Key viral components are shown being synthesized in the rough endoplasmic reticulum (ER), including accessory protein (AP), membrane protein (M), envelope protein (E), spike glycoprotein (S), and nucleocapsid protein (N). The diagram highlights the assembly of new virions within the endoplasmic reticulum-Golgi intermediate compartment (ERGIC) and the Golgi apparatus, followed by vesicle transport and viral release. Critical therapeutic targets are identified through the inclusion of entry inhibitors, protease inhibitors (targeting PLpro and 3CLpro), and replication inhibitors. The visualization serves as an educational tool for understanding coronavirus virology and pharmacotherapy.](https://cdn.orris.care/cdss_images/pmc_clinical_VQA_c35e92c4f4a5e28b4364f80ef93e2fa38f52483741d51efe2804ea4eac1386c6.jpg)
A pathophysiology diagram illustrating the replication cycle of the SARS-CoV-2 virus (2019-nCoV) within a host cell and identifying potential therapeutic intervention points. The schematic depicts the virus engaging cell surface receptors ACE2 and CD147, followed by entry via endosomal or non-endosomal pathways. Once inside, the process of uncoating releases genomic positive-strand RNA [(+) RNA], which undergoes translation and transcription. Key viral components are shown being synthesized in the rough endoplasmic reticulum (ER), including accessory protein (AP), membrane protein (M), envelope protein (E), spike glycoprotein (S), and nucleocapsid protein (N). The diagram highlights the assembly of new virions within the endoplasmic reticulum-Golgi intermediate compartment (ERGIC) and the Golgi apparatus, followed by vesicle transport and viral release. Critical therapeutic targets are identified through the inclusion of entry inhibitors, protease inhibitors (targeting PLpro and 3CLpro), and replication inhibitors. The visualization serves as an educational tool for understanding coronavirus virology and pharmacotherapy.
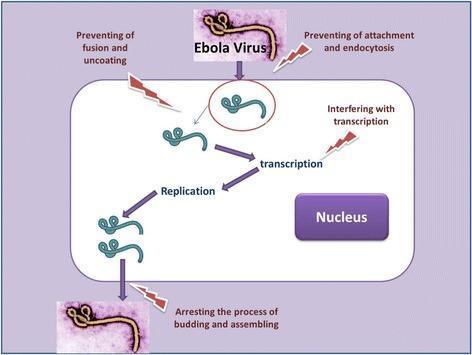
A pathophysiology diagram illustrating the Ebola virus (EBOV) life cycle within a host cell and identifying potential therapeutic targets. The diagram utilizes clinical micrographs of the filamentous, pleomorphic Ebola virus to represent entry and exit. The intracellular viral replication stages are mapped sequentially: attachment and endocytosis (entry), fusion and uncoating (releasing the viral genome), transcription, replication, and budding and assembly (exit). Potential pharmacological intervention points are highlighted by red lightning bolt icons, indicating strategies such as preventing attachment and endocytosis, preventing fusion and uncoating, interfering with transcription, and arresting the process of budding and assembling. The host cell is depicted with a distinct nucleus, and arrows trace the progression of the viral cycle from cellular entry to the release of progeny virions. This educational graphic is designed for medical virology and drug discovery contexts, emphasizing sites of action for future anti-Ebola therapeutics.
bacterial growth curve lag log stationary death phase
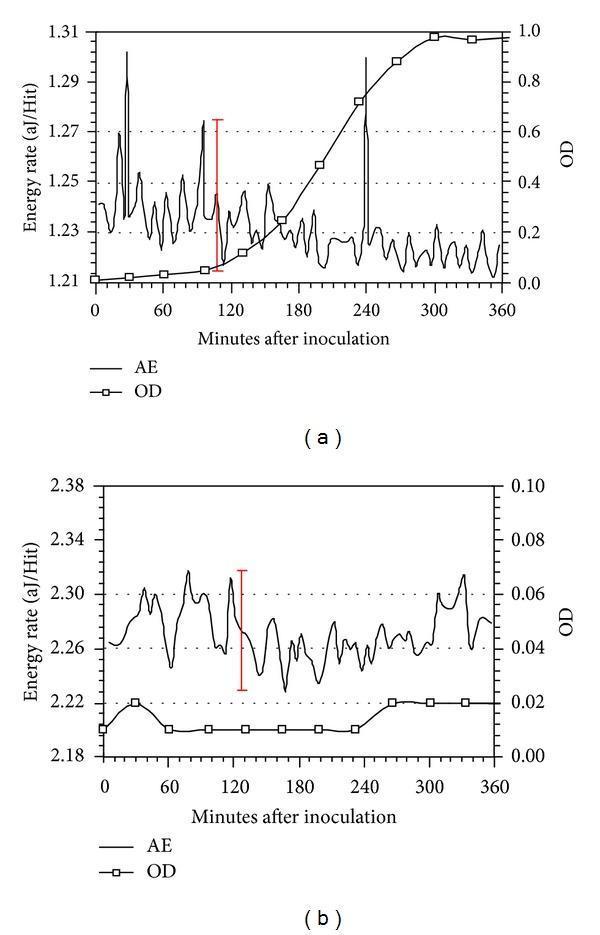
This figure presents two comparison charts, (a) and (b), depicting the growth kinetics and metabolic activity of Lactococcus lactis over 360 minutes. The primary metrics are Optical Density (OD), indicating bacterial concentration, and Energy Rate measured via Acoustic Emission (AE) in attojoules per hit (aJ/Hit). Graph (a) shows normal bacterial growth: the OD curve follows a characteristic sigmoidal pattern with lag, log, and stationary phases, while the AE data exhibits significant fluctuations and distinct peaks (e.g., around 108 and 240 minutes) representing metabolic energy release. Graph (b) demonstrates the effect of the metabolic inhibitor Sodium Azide (NaN3). In this panel, the OD remains near-baseline (indicating total inhibition of growth), and the AE signal shows only low-level background fluctuations without significant metabolic peaks. Red bars indicate ±3σ deviation standards for noise assessment. These graphs are utilized in microbiology and biomedical engineering to evaluate non-invasive methods for monitoring microbial activity and metabolic inhibition.
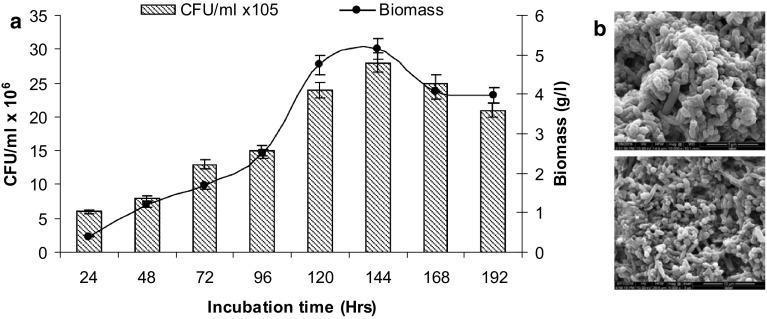
Educational microbiology graphic consisting of a growth curve plot (1a) and scanning electron micrographs (1b) documenting a bacterial consortium's development. Panel (a) presents a dual-axis line and bar graph showing the relationship between incubation time (24–192 hours), bacterial colony-forming units (CFU/mL x 10^6), and biomass concentration (g/L). The growth kinetics demonstrate a logarithmic increase in both parameters, peaking at 144 hours with a biomass of approximately 5.15 g/L and a CFU count of 28 x 10^6, followed by a slight decline indicating the stationary or death phase. Panel (b) features two scanning electron micrographs (SEM) at different magnifications, visualizing the bacterial morphology. The microbes are characterized as densely packed, rod-shaped bacilli forming a thick, interconnected biofilm matrix. The rough surface texture suggests the presence of an extracellular polymeric substance (EPS) coating. This figure illustrates bacterial growth dynamics and structural arrangement relevant to microbial degradation processes in biomedical or environmental health contexts.
General Microbiology: Overview, Bacteria, and Viruses
Part 1 - Introduction to Microbiology
The Five Groups of Microbes
| Group | Key Features |
|---|---|
| Viruses | Smallest (18-600 nm); DNA or RNA genome; obligate intracellular parasites |
| Bacteria | Prokaryotes (no nucleus); 1-20 µm; reproduce by binary fission |
| Archaebacteria | Prokaryotes; no known human pathogens |
| Fungi | Eukaryotes; yeasts and molds |
| Parasites | Protozoa and helminths; complex life cycles |
Part 2 - Bacteria
2.1 Basic Characteristics
- Size - small (1 µm) to large (20+ µm)
- Shape - cocci (spheres), bacilli (rods), spirilla/spirochetes (spirals)
- Spatial arrangement - singles, pairs (diplococci), chains (strepto-), clusters (staphylo-)
- Phenotypic and genotypic properties
2.2 The Bacterial Cell Wall - Gram Staining
| Feature | Gram-Positive | Gram-Negative |
|---|---|---|
| Peptidoglycan layer | Thick (20-80 nm) | Thin (2-7 nm) |
| Outer membrane | Absent | Present (has LPS) |
| Color after stain | Purple/violet | Pink/red |
| Teichoic acids | Present | Absent |
| Periplasmic space | Narrow | Wide |
- Mycobacterium - complex waxy cell wall (mycolic acids); stained by acid-fast stain, not Gram stain
- Mycoplasma - no cell wall at all; survives only in hypertonic environments or inside host cells
2.3 External Structures
- A polysaccharide (or polypeptide in B. anthracis) layer surrounding the cell
- Antiphagocytic - major virulence factor (e.g., S. pneumoniae)
- Poorly antigenic; acts as barrier to hydrophobic toxic molecules
- Visualized by India ink exclusion
- Bacteria can lose capsules in laboratory culture and become less virulent
- Produced when a quorum of bacteria accumulate (quorum sensing)
- Protects bacterial communities from antibiotics and host defenses
- Example: P. aeruginosa in cystic fibrosis lungs; dental plaque from S. mutans
- Ropelike propellers made of helically coiled protein subunits (flagellin)
- Responsible for motility
- Classification by position: monotrichous, lophotrichous, amphitrichous, peritrichous
- Hollow protein tubes on the surface
- Ordinary pili - adhesion to host cells
- Sex pili - form conjugation bridges for horizontal gene transfer
2.4 Internal Structures
| Structure | Description |
|---|---|
| Nucleoid | Single circular chromosome of double-stranded DNA; not membrane-bound |
| Plasmids | Small, extrachromosomal circular DNA; carry resistance genes |
| Ribosomes | 70S (30S + 50S subunits); target of many antibiotics |
| Inclusion bodies | Storage granules (e.g., polyhydroxybutyrate, volutin/metachromatic granules) |
| Endospores | Dormant, highly resistant forms (e.g., Bacillus, Clostridium) |
Antibiotic note: Human ribosomes are 80S - this structural difference allows antibiotics like aminoglycosides, tetracyclines, chloramphenicol, and macrolides to selectively target the bacterial 70S ribosome.
2.5 Bacterial Classification
- Obligate aerobes (require O₂): Mycobacterium, Pseudomonas
- Obligate anaerobes (killed by O₂): Clostridium, Bacteroides
- Facultative anaerobes (grow with or without O₂): most pathogens (E. coli, Staphylococcus)
- Microaerophiles (need low O₂): Helicobacter, Campylobacter
- Mesophiles (optimal 20-45°C): most human pathogens
- Thermophiles (optimal >45°C)
- Psychrophiles (optimal <20°C)
2.6 Bacterial Growth
| Phase | What Happens |
|---|---|
| Lag phase | Bacteria adapt to new environment; no net growth; metabolic activity high |
| Log (Exponential) phase | Rapid binary fission; constant doubling time; most susceptible to antibiotics |
| Stationary phase | Nutrient depletion / waste accumulation; growth = death rate |
| Death phase | Cell death exceeds reproduction |
Part 3 - Viruses
3.1 What is a Virus?
- Obligate intracellular parasites - cannot replicate outside a host cell
- Composed of a nucleic acid genome (DNA or RNA, never both) enclosed in a protein shell
- Either naked (just capsid) or enveloped (capsid + lipid membrane)
3.2 Viral Structure
| Component | Description |
|---|---|
| Genome | Single- or double-stranded DNA or RNA; may be linear or circular, segmented or non-segmented |
| Capsid | Protein shell made of repeating units called capsomeres |
| Envelope | Lipid bilayer derived from the host cell membrane (present in enveloped viruses) |
| Spike proteins (VAPs) | Glycoproteins on the envelope surface; mediate cell attachment |
- Icosahedral - 20 equilateral triangular faces (e.g., Adenovirus, Picornavirus, Herpesvirus nucleocapsid)
- Helical - capsomeres arranged in a helix around the genome (e.g., Influenza, Rabies)
- Complex - neither icosahedral nor helical (e.g., Poxvirus - bricklike; Bacteriophages - composite)
3.3 Viral Replication Cycle
Step-by-Step:
- Viral attachment proteins (VAPs) on the virion surface bind to specific receptors on the host cell
- Receptors can be proteins, glycoproteins, or glycolipids on the host membrane
- This determines host range (which species) and tissue tropism (which cell type)
- Example: HIV uses CD4 + CCR5/CXCR4; EBV uses CD21 (CR2) on B cells; Influenza uses sialic acid residues
- Enveloped viruses: Fusion of viral envelope with cell membrane (at the surface or within endosomes)
- Naked viruses: Receptor-mediated endocytosis or direct injection
- Release of the genome from the capsid into the cytoplasm (or nucleus)
- The virion is disassembled - this is the eclipse period (no intact virions detectable)
- Begins the latent period (no extracellular virus detectable)
- Early mRNA transcribed first → encodes enzymes and non-structural proteins (e.g., RNA-dependent RNA polymerase, DNA polymerase)
- Genome replication occurs
- Late mRNA encodes structural proteins (capsid proteins, envelope glycoproteins)
- Post-translational modifications (glycosylation, cleavage)
- New genomes + structural proteins self-assemble into new virions
- Occurs in the nucleus (DNA viruses) or cytoplasm (most RNA viruses)
- Naked viruses: Cell lysis - kills the host cell and releases all virions at once
- Enveloped viruses: Budding through the cell membrane - the virus acquires its envelope and the cell may survive longer
3.4 DNA vs. RNA Viruses - Key Differences
| Feature | DNA Viruses | RNA Viruses |
|---|---|---|
| Replication site | Nucleus (usually) | Cytoplasm (usually) |
| Polymerase needed | Host DNA polymerase (mostly) | Virus must bring its own RNA polymerase |
| Mutation rate | Lower (proofreading) | Higher (no proofreading → antigenic drift) |
| Examples | Herpes, Adenovirus, Poxvirus, HBV | Influenza, HIV, Poliovirus, Measles |
3.5 Outcomes of Viral Infection
| Outcome | Description | Example |
|---|---|---|
| Lytic infection | Cell is destroyed; virus replicates and is released | Poliovirus |
| Persistent/Chronic infection | Cell survives; virus continuously produced | HBV, HCV |
| Latent infection | Virus remains dormant in host cell; reactivates later | Herpes simplex, VZV |
| Transformation/Oncogenesis | Viral genes integrate and transform cell to malignancy | HPV (cervical cancer), EBV (lymphoma) |
| Abortive infection | Virus enters but cannot complete replication | Depends on cell type |
Quick Summary Table
| Feature | Bacteria | Viruses |
|---|---|---|
| Size | 1-20 µm | 18-600 nm |
| Cell structure | Prokaryote | Acellular (no cells) |
| Genome | DNA (chromosome + plasmids) | DNA or RNA (not both) |
| Ribosome | 70S | None |
| Cell wall | Present (usually) | Absent |
| Replication | Binary fission (independent) | Only inside host cell |
| Energy metabolism | Yes (own) | No (uses host) |
| Antibiotic susceptibility | Yes (most) | No (antiviral drugs differ) |
- Medical Microbiology 9e - Murray et al., pp. 15-17, 144-145, 416-417
- Jawetz, Melnick & Adelberg's Medical Microbiology, 28e
- Sherris & Ryan's Medical Microbiology, 8e