ECG basic to advanced for learning
Reading File
Finding Sources
Finding Sources
Finding Sources
Finding Sources
Finding Sources
Reading File
Reading File
Reading File
Finding Sources
Finding Sources
Finding Sources
Finding Sources
Reading File
Reading File
Reading File
Reading File
Reading File
Loading Image
Reading File
Loading Image
Loading Image
Reading File
I now have very rich content from Harrison's 22E, Guyton, and Fuster. I have enough to write a comprehensive ECG guide from basic to advanced. Let me compile everything into a well-organized, educational response.
ECG: Basic to Advanced - A Complete Learning Guide
Sources: Harrison's Principles of Internal Medicine 22E, Guyton & Hall Textbook of Medical Physiology, Fuster and Hurst's The Heart 15th Ed, Braunwald's Heart Disease
PART 1 - THE FUNDAMENTALS
Why the ECG Works (Electrophysiology)
The heart's electrical activity generates current that spreads through surrounding tissues all the way to the skin surface. Electrodes placed on opposite sides of the heart detect potential differences - this recording is the electrocardiogram.
The key principle: a wave of depolarization moving TOWARD a positive electrode produces an upward (positive) deflection; moving AWAY produces a downward (negative) deflection.
Each cell has an action potential. The rapid upstroke (phase 0, Na⁺ influx) corresponds to the start of the QRS complex. The plateau (phase 2) corresponds to the isoelectric ST segment. Active repolarization (phase 3) produces the T wave.
The Cardiac Conduction System
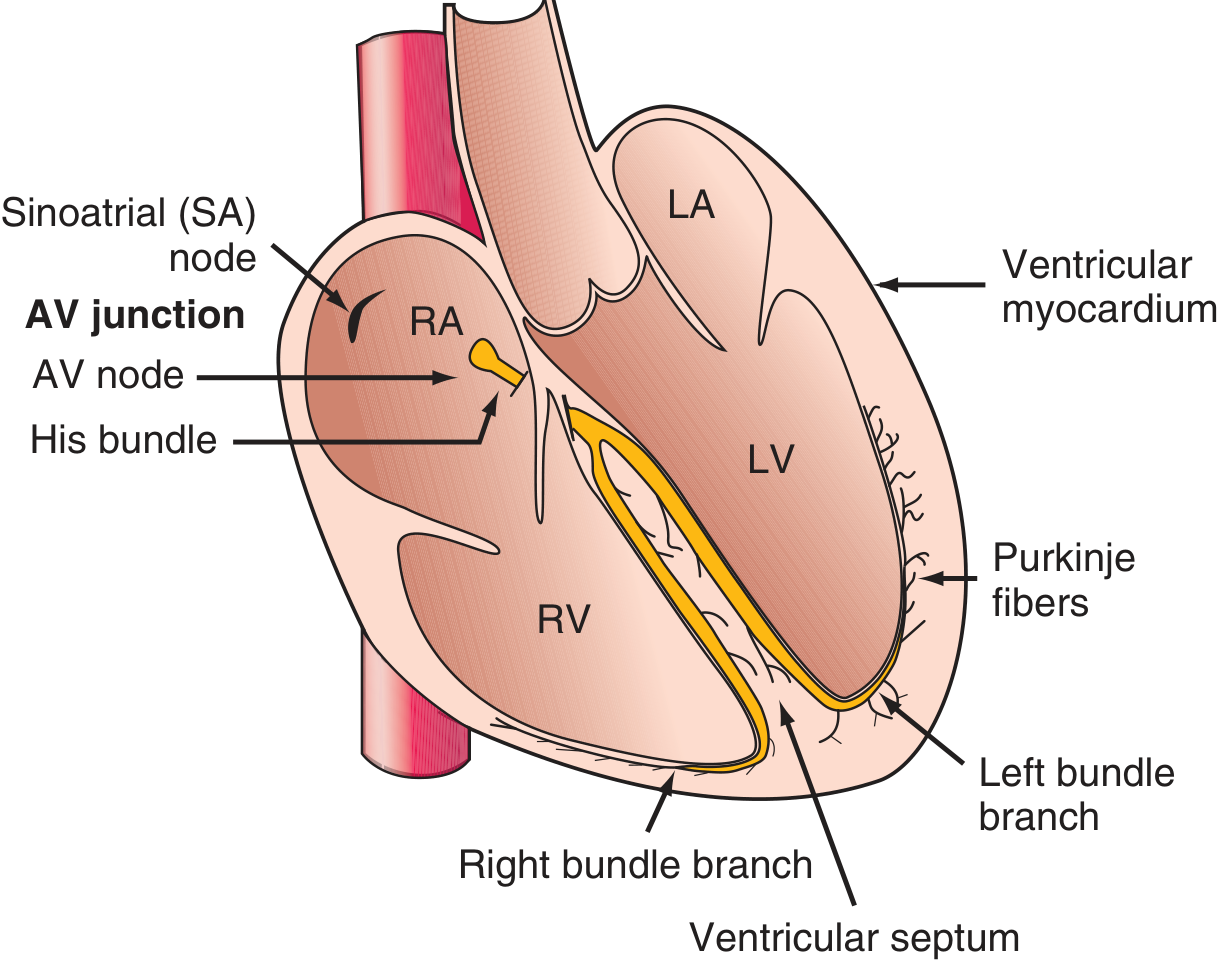
Figure: Cardiac conduction system - Harrison's Principles of Internal Medicine 22E
The normal heartbeat originates in the sinoatrial (SA) node (dominant pacemaker, ~60-100 bpm intrinsic rate). The impulse travels:
- SA node - right atrium → spreads across both atria (produces P wave)
- AV node - deliberate delay (120-200 ms) allowing atrial filling - corresponds to PR interval
- Bundle of His - bifurcates into right bundle branch and left bundle branch (which divides into left anterior and left posterior fascicles)
- Purkinje fibers - rapid spread through ventricular myocardium endocardium → epicardium (produces QRS)
- Ventricular repolarization - T wave
The depolarization wavefronts have direction and magnitude and can be represented as vectors - this is the basis of axis calculation. - Harrison's Principles of Internal Medicine 22E, p. 1911
PART 2 - THE ECG WAVEFORMS AND INTERVALS
The Normal ECG - Labeled Waveforms
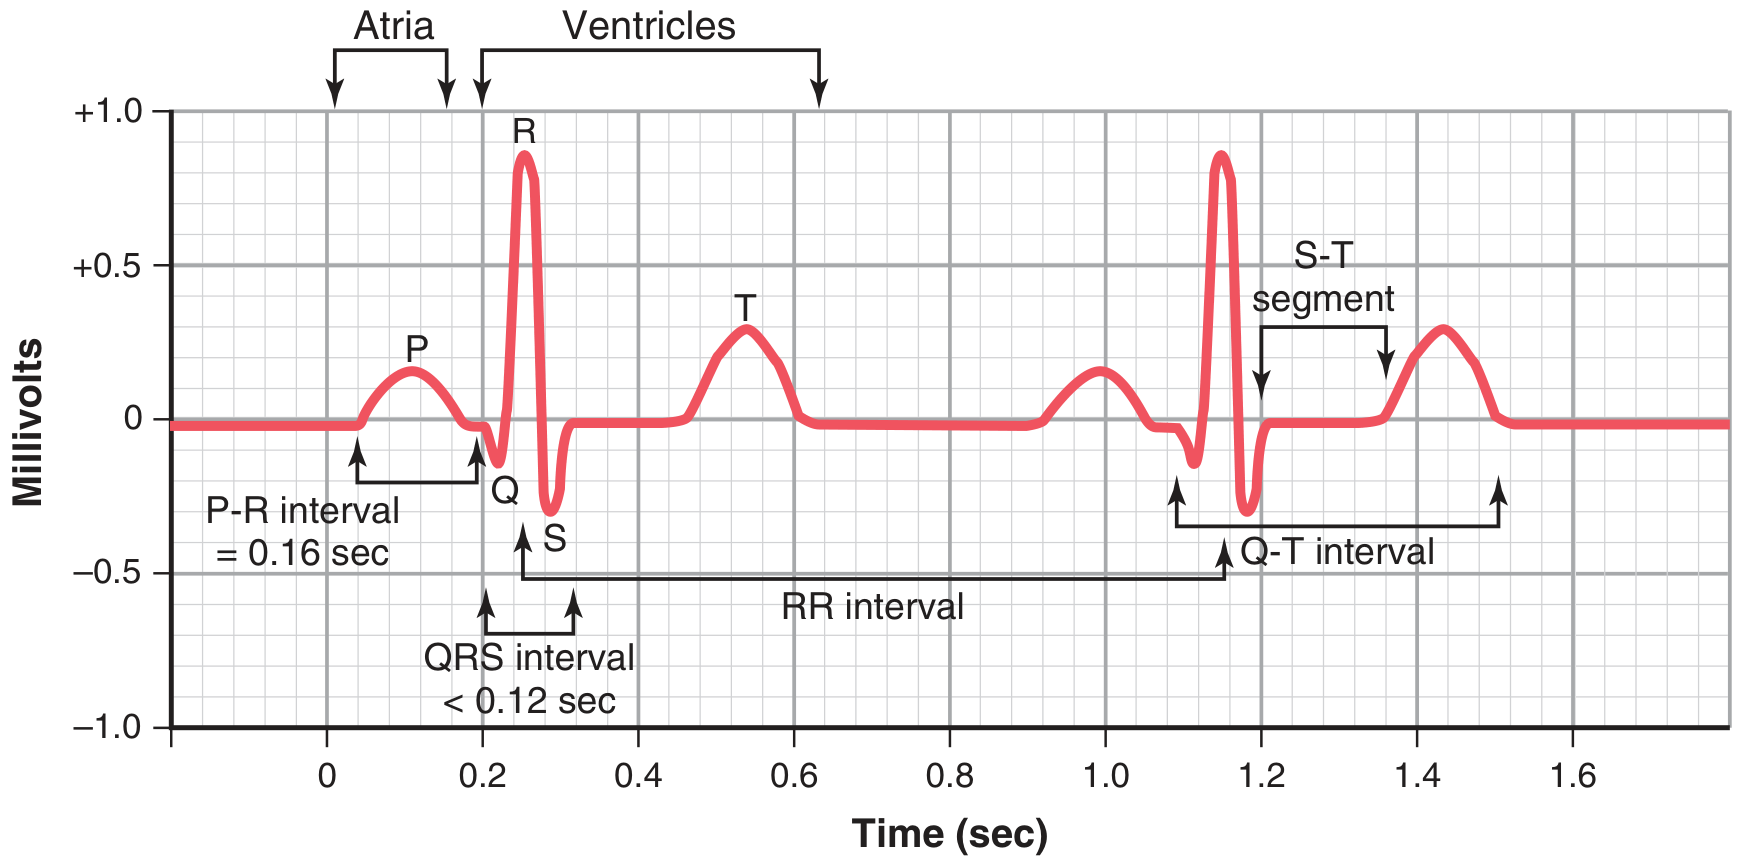
Figure: Normal ECG with labeled intervals - Guyton & Hall Textbook of Medical Physiology
The ECG waveforms with intervals
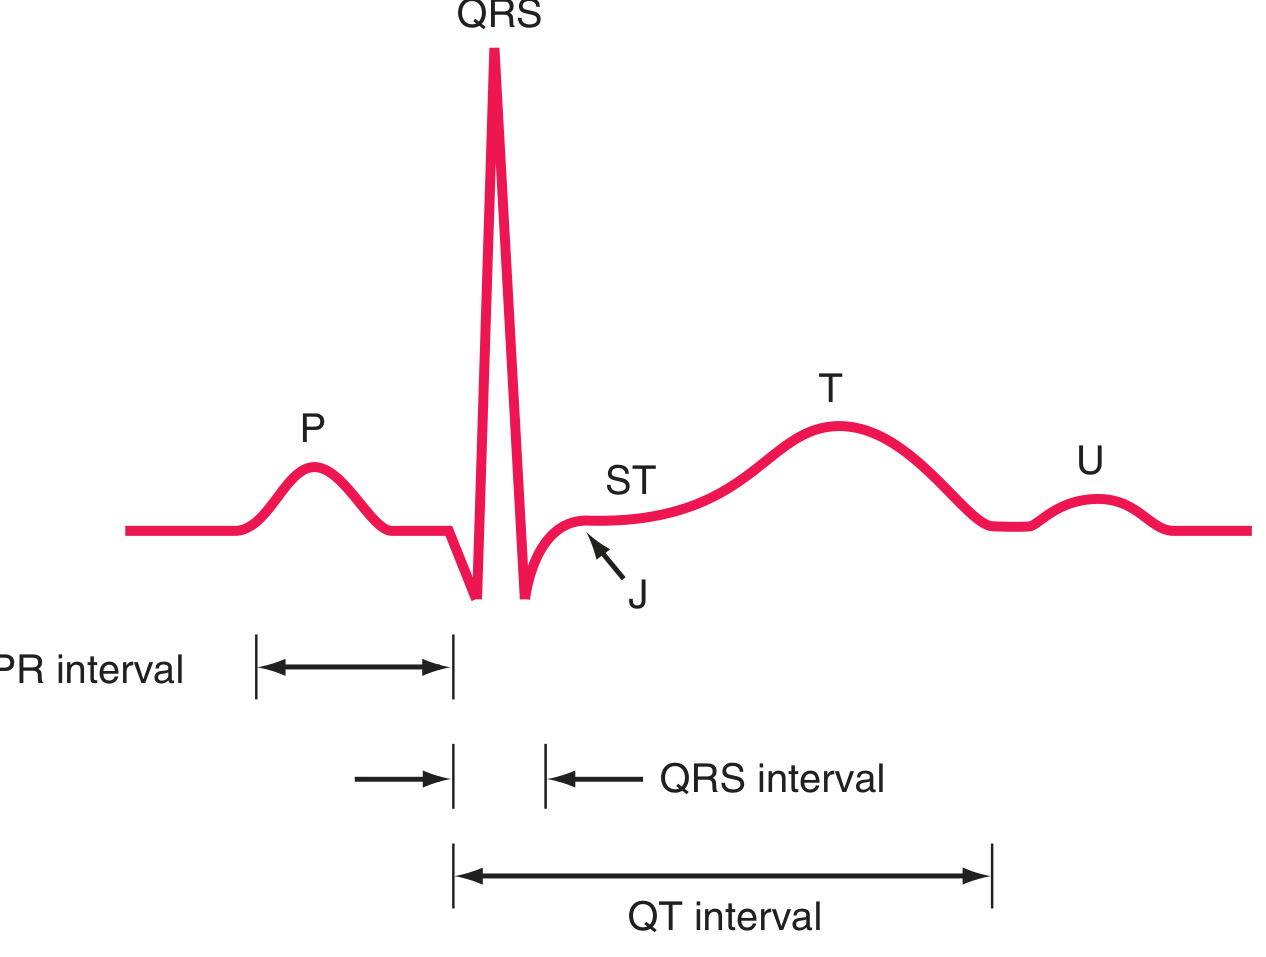
Figure: Basic ECG waveforms and intervals including J point and U wave - Harrison's 22E, Fig. 247-2
Each Wave Explained
| Wave / Segment | What it Represents | Key Facts |
|---|---|---|
| P wave | Atrial depolarization | Small, rounded; upright in I, II, aVF; normal duration <120 ms |
| PR interval | Atrial depolarization + AV nodal delay | Normal: 120-200 ms (3-5 small squares) |
| QRS complex | Ventricular depolarization | Normal: ≤110 ms (<3 small squares) |
| Q wave | Initial septal depolarization (left → right) | Pathological if >40 ms wide or >25% of R height |
| ST segment | Ventricular plateau (no net current) | Should be isoelectric; the J point marks its start |
| T wave | Ventricular repolarization | Upright in I, II, V3-V6; inverted in aVR |
| QT interval | Total ventricular depolarization + repolarization | Normal: <460 ms women, <450 ms men; corrected with QTc formula |
| U wave | May follow T wave | Prominent in hypokalemia; seen in some normal individuals |
ECG Paper and Speed
The ECG records at 25 mm/s:
- 1 small box = 1 mm = 40 ms (0.04 s)
- 1 large box = 5 mm = 200 ms (0.20 s)
- Vertically: 1 mV = 10 mm (standard calibration)
Heart rate calculation:
- Count large boxes between R waves: divide 300 by the number of large boxes
- Or: count small boxes and divide 1500
PART 3 - THE 12 LEADS
The Lead System
The 12 conventional leads are divided into two groups:
Limb leads (frontal plane):
- Standard bipolar: I, II, III
- Augmented unipolar: aVR, aVL, aVF
- These 6 leads form the hexaxial reference system
Precordial (chest) leads (horizontal plane):
- V1 (right sternal border, 4th ICS), V2, V3, V4, V5, V6 (left midaxillary line)
- V1-V2 overlie right ventricle
- V3-V4 transition zone / interventricular septum
- V5-V6 overlie lateral left ventricle
The orientation and polarity of the frontal plane leads are represented on a hexaxial diagram. - Harrison's Principles of Internal Medicine 22E, p. 1912
Where to Look for What
| Lead Group | What it "sees" |
|---|---|
| II, III, aVF | Inferior wall (RCA territory) |
| I, aVL, V5, V6 | Lateral wall (LCx territory) |
| V1-V4 | Anterior wall (LAD territory) |
| V1-V2 | Right ventricle / posterior wall changes |
| aVR | Global subendocardium / LMCA ischemia |
PART 4 - CARDIAC AXIS
What is the Electrical Axis?
The mean QRS axis is the net direction of ventricular depolarization in the frontal plane. The normal axis is -30° to +90°.
Quick axis check using leads I and aVF:
| Lead I | aVF | Axis |
|---|---|---|
| Positive (upward QRS) | Positive | Normal (+) |
| Positive | Negative | Left axis deviation (LAD) |
| Negative | Positive | Right axis deviation (RAD) |
| Negative | Negative | Extreme / "northwest" axis |
Left axis deviation (<-30°): left anterior fascicular block, inferior MI, LVH, WPW (some types)
Right axis deviation (>+90°): right ventricular hypertrophy, left posterior fascicular block, lateral MI, pulmonary embolism, normal in children/tall people
PART 5 - CHAMBER ENLARGEMENT & HYPERTROPHY
Atrial Abnormalities
Right atrial enlargement (RAE):
- Tall, peaked P waves ("P pulmonale") ≥2.5 mm in II, III, aVF
- Associated with COPD, pulmonary hypertension, tricuspid stenosis
Left atrial abnormality (LAA):
- Broad, notched P waves in limb leads ("P mitrale"), duration ≥120 ms
- Biphasic P wave in V1 with prominent negative component
- Associated with mitral stenosis/regurgitation, LVH, heart failure
Ventricular Hypertrophy
Left Ventricular Hypertrophy (LVH):
Voltage criteria (most used - Sokolow-Lyon):
- SV1 + RV5 or V6 ≥35 mm
- R in aVL ≥11 mm
- Cornell criteria: RaVL + SV3 ≥28 mm (men), ≥20 mm (women)
Additional features: left axis deviation, ST depression + T wave inversion in V5-V6 ("strain" pattern), prolonged QRS, LA abnormality
LVH increases the amplitude of electrical forces directed to the left and posteriorly. Repolarization abnormalities may cause ST-segment depression and T-wave inversion in leads with a prominent R wave. - Harrison's 22E
Right Ventricular Hypertrophy (RVH):
- Tall R wave in V1 (R > S in V1), right axis deviation (>+90°)
- Deep S waves in V5-V6
- ST depression and T-wave inversion in right precordial leads ("strain")
- Associated with: pulmonary hypertension, pulmonic stenosis, ASD
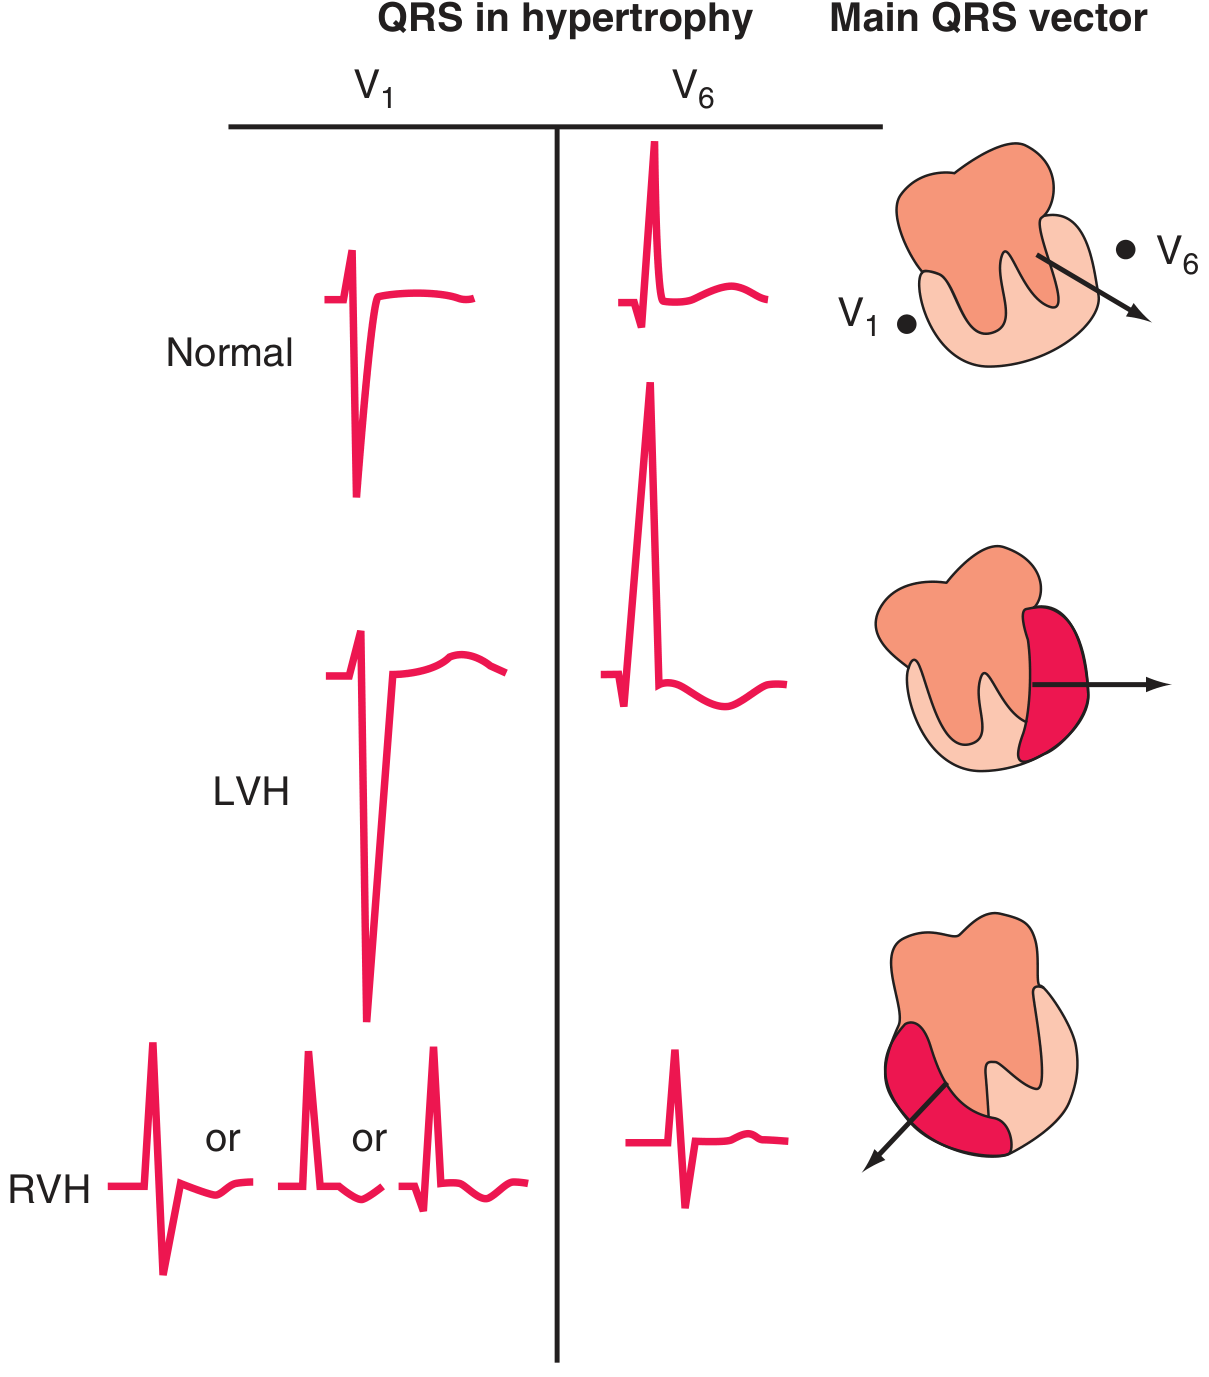
Figure: LVH and RVH ECG patterns - Harrison's 22E, Fig. 247-9
PART 6 - BUNDLE BRANCH BLOCKS
Right Bundle Branch Block (RBBB)
Criteria: QRS ≥120 ms (complete); RSR' ("rabbit ears") in V1/V2; wide S wave in I, aVL, V5-V6
Remember: "MaRRoW" - in RBBB, V1 has an M-shape; lateral leads have a W-shape
Causes: Normal variant (isolated RBBB), right heart strain (PE), ASD, Brugada syndrome, myocarditis, ischemia
Left Bundle Branch Block (LBBB)
Criteria: QRS ≥120 ms; broad monophasic R in I, aVL, V5-V6 (no septal Q); QS or rS in V1-V2; no normal R-wave progression
Remember: "WiLLiaM" - in LBBB, V1 has a W-shape; lateral leads have an M-shape
Important: New LBBB in the context of chest pain may represent acute MI (Sgarbossa criteria apply)
LBBB makes ST analysis unreliable - the repolarization is inherently abnormal, causing secondary ST-T changes (ST depression and T-wave inversion in leads with a dominant R wave; ST elevation in V1-V3).
Sgarbossa criteria for MI in LBBB:
- ST elevation ≥1 mm concordant with QRS (same direction) - 5 points
- ST depression ≥1 mm in V1-V3 - 3 points
- ST elevation ≥5 mm discordant with QRS - 2 points Total ≥3 points = STEMI likely
Fascicular Blocks (Hemiblocks)
Left Anterior Fascicular Block (LAFB):
- Left axis deviation (-45° to -90°)
- Small Q in I/aVL, small R in II/III/aVF
- QRS slightly widened but <120 ms
Left Posterior Fascicular Block (LPFB):
- Right axis deviation (>+90°)
- Small R in I/aVL, small Q in II/III/aVF
- Must exclude RVH, lateral MI
Bifascicular block = RBBB + LAFB (most common) or RBBB + LPFB
Trifascicular block = Bifascicular block + prolonged PR interval (implies incomplete His-Purkinje disease)
PART 7 - ISCHEMIA AND INFARCTION
The ECG Evolution of STEMI
Acute MI produces a characteristic ECG evolution:
| Stage | ECG Findings | Timeframe |
|---|---|---|
| Hyperacute | Tall, broad ("hyperacute") T waves | Minutes |
| Early acute | ST elevation (convex upward = "tombstone"); ST elevation ≥1 mm in ≥2 contiguous limb leads; ≥2 mm in ≥2 precordial leads | Hours |
| Evolving | ST elevation persists; Q waves develop (≥40 ms wide, ≥25% of R) | Hours to days |
| Established | Pathological Q waves; ST returns to baseline; T-wave inversion | Days to weeks |
| Old MI | Persistent Q waves; T waves may normalize | Weeks to months/permanent |
Profound ST elevation or depression in multiple leads usually indicates very severe ischemia. - Harrison's Principles of Internal Medicine 22E
Localizing the Infarct
| Territory | Leads with ST elevation | Artery |
|---|---|---|
| Anterior | V1-V4 | LAD |
| Anteroseptal | V1-V3 | LAD (proximal) |
| Anterolateral | V1-V6, I, aVL | LAD + diagonal |
| Lateral | I, aVL, V5-V6 | LCx |
| Inferior | II, III, aVF | RCA (80%) or LCx (20%) |
| Posterior | ST depression V1-V3; tall R and ST elevation in V7-V9 | RCA or LCx |
| Right ventricular | ST elevation in V4R (right-sided leads) | Proximal RCA |
ST elevation in III > II in inferior STEMI, with ST depression in aVL, suggests RCA. ST elevation in leads II ≈ III suggests LCx territory. - Rosen's Emergency Medicine
Reciprocal changes (mirror-image ST depression in leads opposite to the infarct zone) are a key diagnostic clue - e.g., inferior STEMI often produces reciprocal ST depression in I, aVL.
NSTEMI / Unstable Angina
No ST elevation. ECG may show:
- ST depression (horizontal or downsloping = most concerning)
- Symmetric T-wave inversions (deep Wellens waves in V2-V3 = LAD critical stenosis)
- Normal ECG (does NOT rule out ACS - serial ECGs + troponins required)
ST Elevation Mimics
Important differential for ST elevation: acute pericarditis, early repolarization, LVH with strain, LBBB, Brugada syndrome, acute pulmonary embolism, hypothermia (J/Osborn waves), hypercalcemia, Takotsubo syndrome, myocarditis. - Harrison's Principles of Internal Medicine 22E, p. 1917
Pericarditis vs. STEMI:
- Pericarditis: diffuse ST elevation (saddle-shaped, concave up) in multiple territories; PR depression; no reciprocal changes except aVR; no Q waves
- STEMI: focal, convex ST elevation; reciprocal ST depression; Q waves develop
PART 8 - ARRHYTHMIAS
Systematic Approach to Rhythm
Always ask:
- What is the rate? (fast / normal / slow)
- Are P waves present and regular?
- Is the PR interval normal?
- Are QRS complexes narrow (<120 ms) or wide (≥120 ms)?
- What is the relationship between P waves and QRS?
Sinus Rhythms
Normal sinus rhythm: Rate 60-100 bpm; P wave upright in II, inverted in aVR; PR 120-200 ms; every P followed by QRS
Sinus bradycardia: Rate <60 bpm; normal P-QRS morphology; often normal in athletes; symptomatic = consider sick sinus syndrome
Sinus tachycardia: Rate 100-150 bpm; gradual onset/offset; cause is almost always secondary (pain, fever, hypovolemia, PE, etc.)
Sinus arrhythmia: Normal variation in P-P interval with respiration (increases on inspiration); benign
AV Blocks
First-degree AV block: PR >200 ms; every P conducts to QRS; benign
Second-degree AV block:
- Mobitz type I (Wenckebach): Progressive PR prolongation until a P wave fails to conduct (a "dropped" QRS); group beating; usually at AV node level; often benign; blocks narrow
- Mobitz type II: Fixed PR interval with sudden non-conduction of a P wave; often at bundle of His or below; more dangerous; blocks wide QRS; risk of complete AV block
Mobitz II: sudden unexplained block without prior PR prolongation. Often indicates infranodal (His or bundle branch) disease. - Fuster and Hurst's The Heart 15E
Third-degree (complete) AV block: Complete dissociation between P waves and QRS complexes; escape rhythm (junctional = narrow at 40-60 bpm; ventricular = wide at 20-40 bpm); emergency if symptomatic
Supraventricular Tachycardias (SVT)
General rule: Narrow QRS tachycardia = almost always supraventricular
Atrial Fibrillation (AF):
- Irregularly irregular rhythm
- No distinct P waves; chaotic atrial baseline (fibrillation waves)
- Ventricular rate typically 100-160 bpm (if uncontrolled)
- Key risks: stroke (use CHA₂DS₂-VASc), rate vs. rhythm control
Atrial Flutter:
- Regular "sawtooth" flutter waves at ~300 bpm (negative in II, III, aVF)
- Usually 2:1 conduction → ventricular rate ~150 bpm
- Clue: Regular tachycardia at exactly 150 bpm = flutter until proven otherwise
AVNRT (most common SVT):
- Regular, narrow QRS; rate 150-250 bpm
- Retrograde P waves buried in or just after QRS (pseudo-R' in V1, pseudo-S in inferior leads)
- Vagal maneuvers / adenosine terminate it
AVRT (WPW and concealed bypass tracts):
- In orthodromic AVRT: narrow QRS with retrograde P in ST segment/early T
- In antidromic AVRT: wide, pre-excited QRS (mimics VT)
- WPW on resting ECG: delta wave (slurred QRS onset), short PR (<120 ms), wide QRS
Atrial tachycardia: Regular; P waves of abnormal morphology before each QRS; distinct from AVNRT
Ventricular Arrhythmias
Premature Ventricular Complexes (PVCs):
- Wide QRS (≥120 ms), bizarre morphology, no preceding P wave
- Usually with full compensatory pause
- Isolated PVCs in structurally normal hearts: benign
- Frequent (>10,000/24 h) or in runs: investigate for cardiomyopathy
Ventricular Tachycardia (VT):
- Wide QRS tachycardia ≥3 beats, rate >100 bpm
- AV dissociation is the hallmark (P waves march through at their own slower rate)
- Fusion beats and capture beats confirm VT
- Brugada criteria / Vereckei algorithm to distinguish VT from SVT with aberrancy
Ventricular Fibrillation (VF):
- Chaotic, disorganized baseline; no identifiable QRS complexes
- Cardiac arrest - immediate defibrillation
PART 9 - METABOLIC AND DRUG EFFECTS
Electrolyte Disturbances
Hyperkalemia (ECG changes are progressive with rising K⁺):
- Peaked, narrow "tented" T waves (first sign)
- Prolonged PR interval, widened QRS
- Flattened/absent P waves
- Sine wave pattern
- VF/asystole
Hypokalemia:
- Flattened T waves
- Prominent U waves (often merging with T wave)
- Prolonged QU interval (mimics long QT)
- ST depression
Hypercalcemia: Short QT interval (shortened ST segment)
Hypocalcemia: Prolonged QT interval (prolonged ST segment, QRS normal)
Factors that prolong phase 2 or 3 of the action potential (e.g., amiodarone, hypocalcemia) increase the QT interval. Factors that shorten repolarization (e.g., hypercalcemia, digoxin) abbreviate the QT. - Harrison's 22E, p. 1912
Key Drug Effects
| Drug | ECG Change |
|---|---|
| Digoxin toxicity | "Scooped" ST depression (reverse tick), short QT, any arrhythmia especially junctional |
| Amiodarone | Prolonged QT, bradycardia, sinus arrest |
| Tricyclics (TCA) overdose | Wide QRS (sodium channel blockade), tall R in aVR >3mm, prolonged QT |
| Flecainide/class IC | Wide QRS, right-shift of axis, QT prolongation |
| Sotalol/class III | Prolonged QT (torsades de pointes risk) |
PART 10 - ADVANCED PATTERNS
Brugada Syndrome
- Type 1 (diagnostic): Coved ST elevation ≥2 mm with J point elevation and T-wave inversion in V1-V2
- Associated with SCN5A mutation, sudden cardiac death in young males
- ECG may be dynamic (unmasked by fever, cocaine, Na-channel blockers)
Long QT Syndrome
- Congenital (LQTS1-3) or acquired
- QTc >460 ms women, >450 ms men
- Risk of torsades de pointes (polymorphic VT) → syncope/SCD
- Triggers: exercise (LQTS1), startle/noise (LQTS2), sleep (LQTS3)
Wolff-Parkinson-White (WPW)
- Delta wave + short PR + wide QRS = ventricular pre-excitation
- Risk: AF with rapid conduction over accessory pathway (very short RR intervals, wide irregular QRS) → VF
- Never use adenosine or AV-nodal blockers in pre-excited AF
Acute Pulmonary Embolism - S1Q3T3 Pattern
- Sinus tachycardia (most common)
- S wave in lead I, Q wave in lead III, T-wave inversion in lead III
- New RBBB or incomplete RBBB
- Right axis deviation, sinus tachycardia
Pericarditis
- Stage 1: Diffuse ST elevation (saddle-shaped, concave), PR depression (most leads), PR elevation in aVR
- Stage 2: ST normalizes, T waves flatten
- Stage 3: T-wave inversions
- Stage 4: Return to normal
Takotsubo (Stress Cardiomyopathy)
- Wide, deep T-wave inversions across precordial leads
- Prolonged QT
- Mimics anterior STEMI initially but no fixed coronary occlusion
Hypothermia - Osborn (J) Waves
- Positive deflection at the J point (end of QRS/start of ST)
- Prominent in V3-V5; size proportional to degree of hypothermia
- Bradycardia, prolonged intervals, AF, VF risk
PART 11 - A SYSTEMATIC APPROACH TO READING ANY ECG
Use this sequence every time:
- Rate - Count RR intervals (fast/normal/slow)
- Rhythm - Regular or irregular? Sinus P waves present?
- Axis - Normal / LAD / RAD using leads I and aVF
- PR interval - Normal (120-200 ms)? Short (WPW, junctional)? Long (AV block)?
- QRS duration - Narrow (<120 ms) or wide? Bundle branch block pattern?
- QT interval - Corrected (QTc): normal vs. prolonged
- P wave morphology - Atrial enlargement? Normal P axis?
- ST segment - Elevation or depression? Leads involved?
- T waves - Normal polarity? Tall (hyperkalemia, hyperacute MI)? Inverted?
- Compare to prior ECG - Is this new or old?
Quick Reference Summary
| Finding | Think of |
|---|---|
| ST elevation in contiguous leads | STEMI, pericarditis, Brugada, LVH strain, early repolarization |
| ST depression | NSTEMI/ischemia, reciprocal change, digoxin, LVH strain |
| Long QT | Drugs, hypokalemia, hypocalcemia, congenital LQTS, hypothyroidism |
| Short QT | Hypercalcemia, digoxin, congenital short QT |
| Delta wave + short PR | WPW pre-excitation |
| Tented T waves | Hyperkalemia |
| Wide QRS (>120 ms) | LBBB, RBBB, VT, WPW (antidromic), hyperkalaemia, Na-channel blockers |
| Irregularly irregular | Atrial fibrillation |
| Regular 150 bpm | Atrial flutter 2:1 until proven otherwise |
| AV dissociation | Complete heart block or VT |
| P pulmonale | Right atrial enlargement (COPD, pulmonary HTN) |
| Saddle-shape ST elevation | Pericarditis |
| Osborn (J) waves | Hypothermia |
| Sigma/scooped ST | Digoxin effect |
Sources: Harrison's Principles of Internal Medicine 22E (2025), pp. 1911-1920 | Guyton & Hall Textbook of Medical Physiology, pp. 142-145 | Fuster and Hurst's The Heart 15th Ed, pp. 1218-1327 | Braunwald's Heart Disease, multiple chapters
2
Asking for Preferences
This is a shared conversation. Sign in to Orris to start your own chat.