
Blood supply of talus with diagram
blood supply of talus diagram anatomy
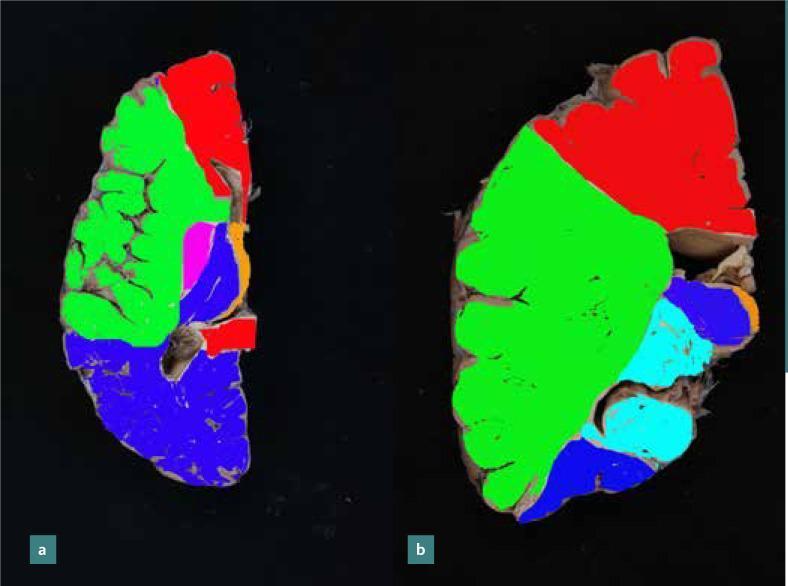
This medical anatomical diagram illustrates the arterial blood supply territories of the human brain through color-coded mapping on axial and coronal sections. Image 'a' displays an axial section at the level of the genu of the corpus callosum, while image 'b' shows a coronal section at the level of the head of the caudate nucleus. The primary vascular territories are identified as follows: red represents the Anterior Cerebral Artery (ACA), supplying the superior and medial aspects; green denotes the Middle Cerebral Artery (MCA), covering the extensive lateral and central regions; and blue indicates the Posterior Cerebral Artery (PCA) territory at the base and posterior aspects. Additionally, smaller vascular zones are identified, including the anterior choroidal artery (purple in 'a', light blue in 'b') and the posterior communicating artery (orange). Blue arrows highlight the border zones or watershed regions between major territories, which are clinically significant as areas highly susceptible to ischemia during hypoperfusion. This visual resource is designed for medical students and clinicians to understand neurovascular anatomy and the pathophysiology of watershed strokes.
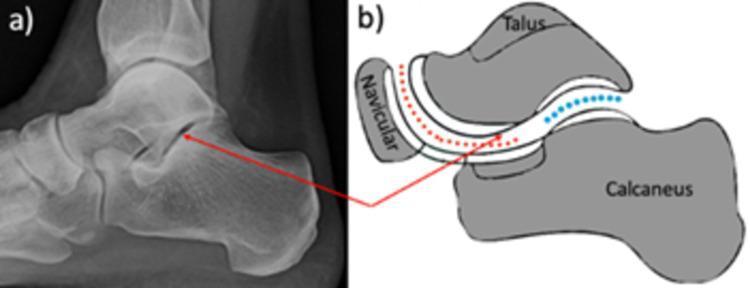
This composite educational graphic focuses on the anatomy of the subtalar joint, featuring (a) a lateral plain-film X-ray of a human foot and (b) a corresponding anatomical diagram. The X-ray demonstrates the talus positioned superiorly and the calcaneus inferiorly, with a red arrow pinpointing the subtalar (talocalcaneal) joint space. The adjacent schematic illustration further clarifies the complex articulation between the talus, calcaneus, and navicular bones. In the diagram, the talocalcaneal joint is delineated by blue dots, emphasizing the posterior facet articulation. The talocalcaneonavicular joint is marked by red dashed lines, showing the ball-and-socket relationship between the talar head, the anterior calcaneal facets, and the posterior surface of the navicular bone. This visual resource is designed for orthopedic and radiological education, specifically for understanding the functional anatomy of the hindfoot and midfoot joints involved in conditions like pes planus and procedures such as subtalar arthroereisis.
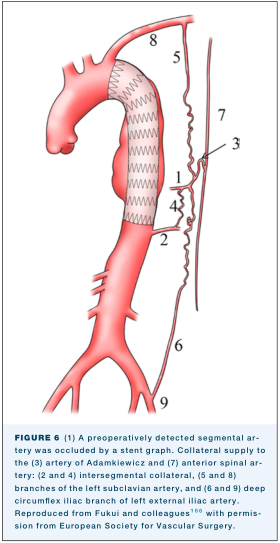
Summary : This is a medical illustration showing the anatomy of the thoracic and abdominal aorta, with a stent graft in place, and the collateral arterial supply to the spinal cord. The diagram is annotated with numbered arteries and collateral pathways, referencing their anatomical names and clinical significance. illustration: # Scene Overview : • Main subject: The thoracic and abdominal aorta, with a stent graft placed in the descending thoracic aorta. • Perspective: Sagittal (side) view of the aorta and its major branches. • Composition: The aorta is centrally depicted, with collateral arteries and spinal cord shown to the right. • Colour palette: Red for arteries, grey for stent graft, black for annotation numbers and lines. # Technical Details : • Stent graft: Shown as a grey, zigzag-patterned tube within the descending thoracic aorta. • Numbered arteries: – 1: Preoperatively detected segmental artery (occluded by stent graft). – 2, 4: Intersegmental collateral arteries. – 3: Artery of Adamkiewicz. – 5, 8: Branches of the left subclavian artery. – 6, 9: Deep circumflex iliac branch of left external iliac artery. – 7: Anterior spinal artery. • Collateral pathways: Wavy lines connecting the aorta to the spinal cord, indicating alternate blood supply routes. # Spatial Relationships : • The stent graft is placed in the upper descending thoracic aorta, occluding the segmental artery (1). • Collateral arteries (2, 4, 5, 6, 8, 9) are shown branching from the aorta and iliac arteries, connecting to the spinal cord. • The artery of Adamkiewicz (3) and anterior spinal artery (7) are highlighted as key vessels for spinal cord perfusion. # Analysis : • The illustration emphasizes the importance of collateral circulation to the spinal cord when a segmental artery is occluded by a stent graft. • Multiple collateral pathways are depicted, suggesting redundancy in spinal cord blood supply. • The diagram is useful for understanding vascular anatomy relevant to aortic stent grafting and spinal cord protection.
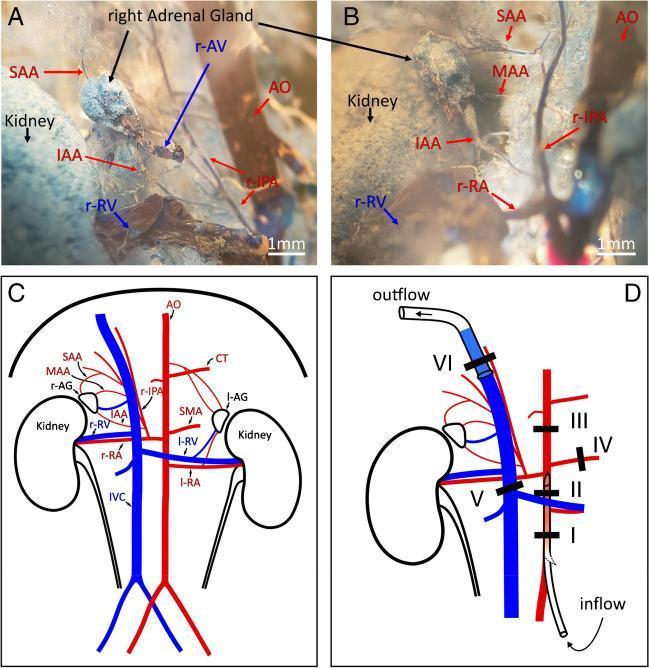
This composite figure illustrates the vascular anatomy of the right adrenal gland in a mouse model, utilizing vascular corrosion casting and schematic diagrams. Panels A and B present close-up views of a vascular corrosion cast (plastination), demonstrating the 3D arterial architecture. The right adrenal gland receives its blood supply from the right inferior phrenic artery (r-IPA), which branches into three distinct vessels: the superior (SAA), middle (MAA), and inferior (IAA) adrenal arteries. The relationship between the aorta (AO), renal artery (r-RA), and the kidney is visible. Panel C provides a labeled anatomical diagram of the retroperitoneal vasculature, including the inferior vena cava (IVC), renal veins (r-RV, l-RV), celiac trunk (CT), and superior mesenteric artery (SMA). Panel D details a surgical ligation and perfusion protocol, showing strategic placement of six ligatures (I-VI) and catheters to isolate the right adrenal gland for physiological study. This resource is designed for advanced biomedical research and comparative anatomy, focusing on endocrine organ microvasculature and ex vivo organ perfusion techniques.
blood supply of talus anatomy diagram artery tarsal canal sinus tarsi
Blood Supply of the Talus
Diagrams
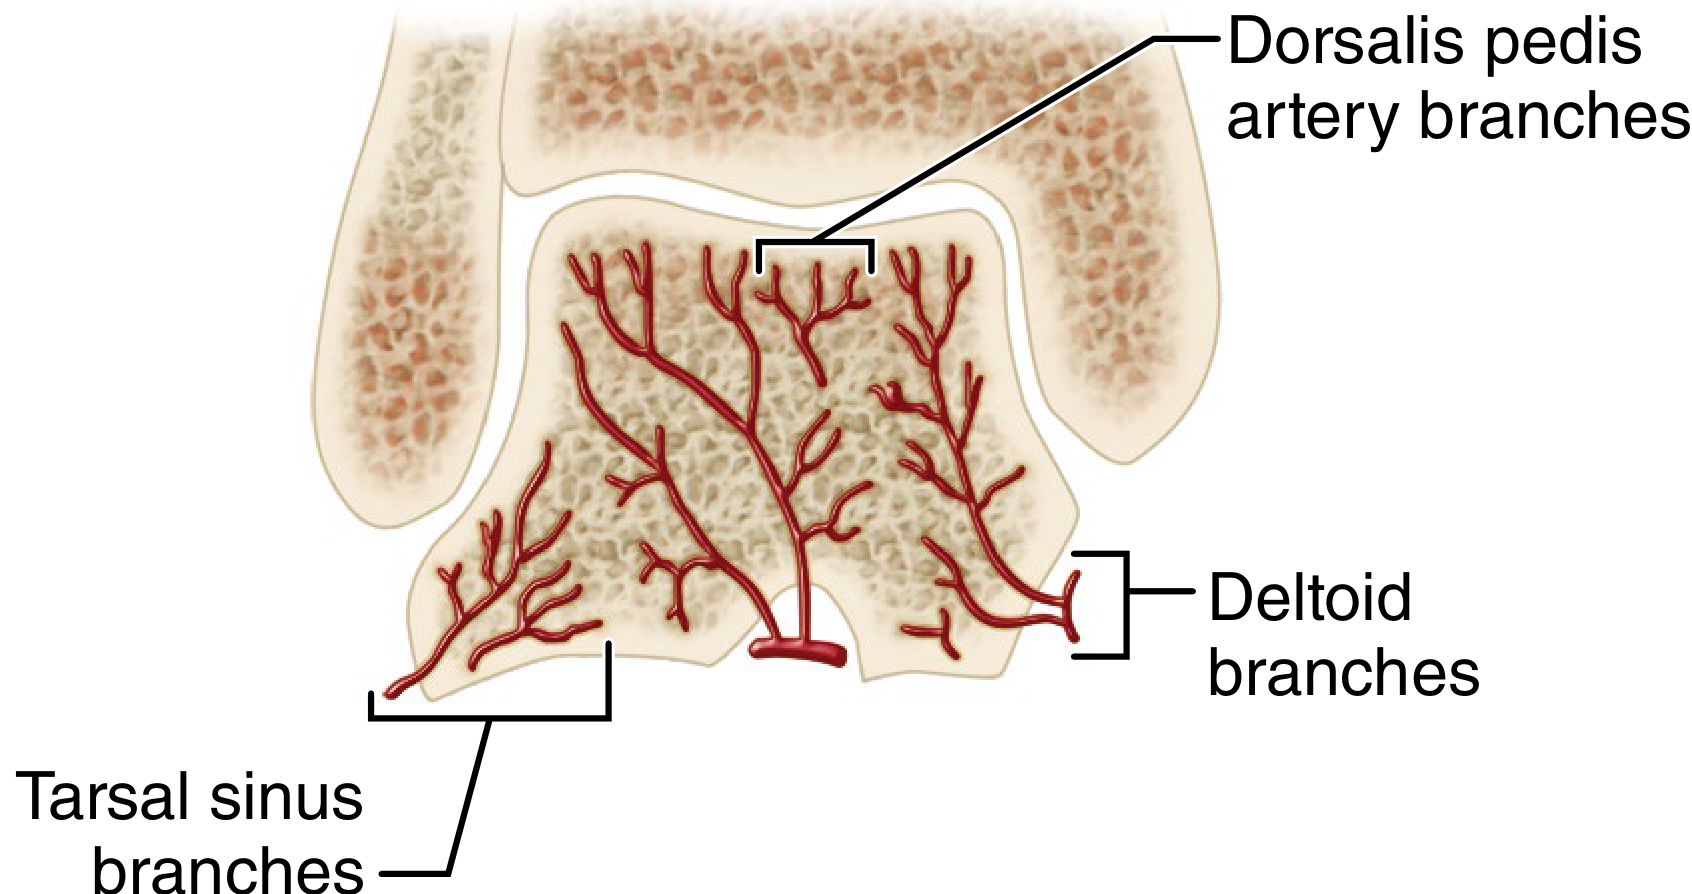
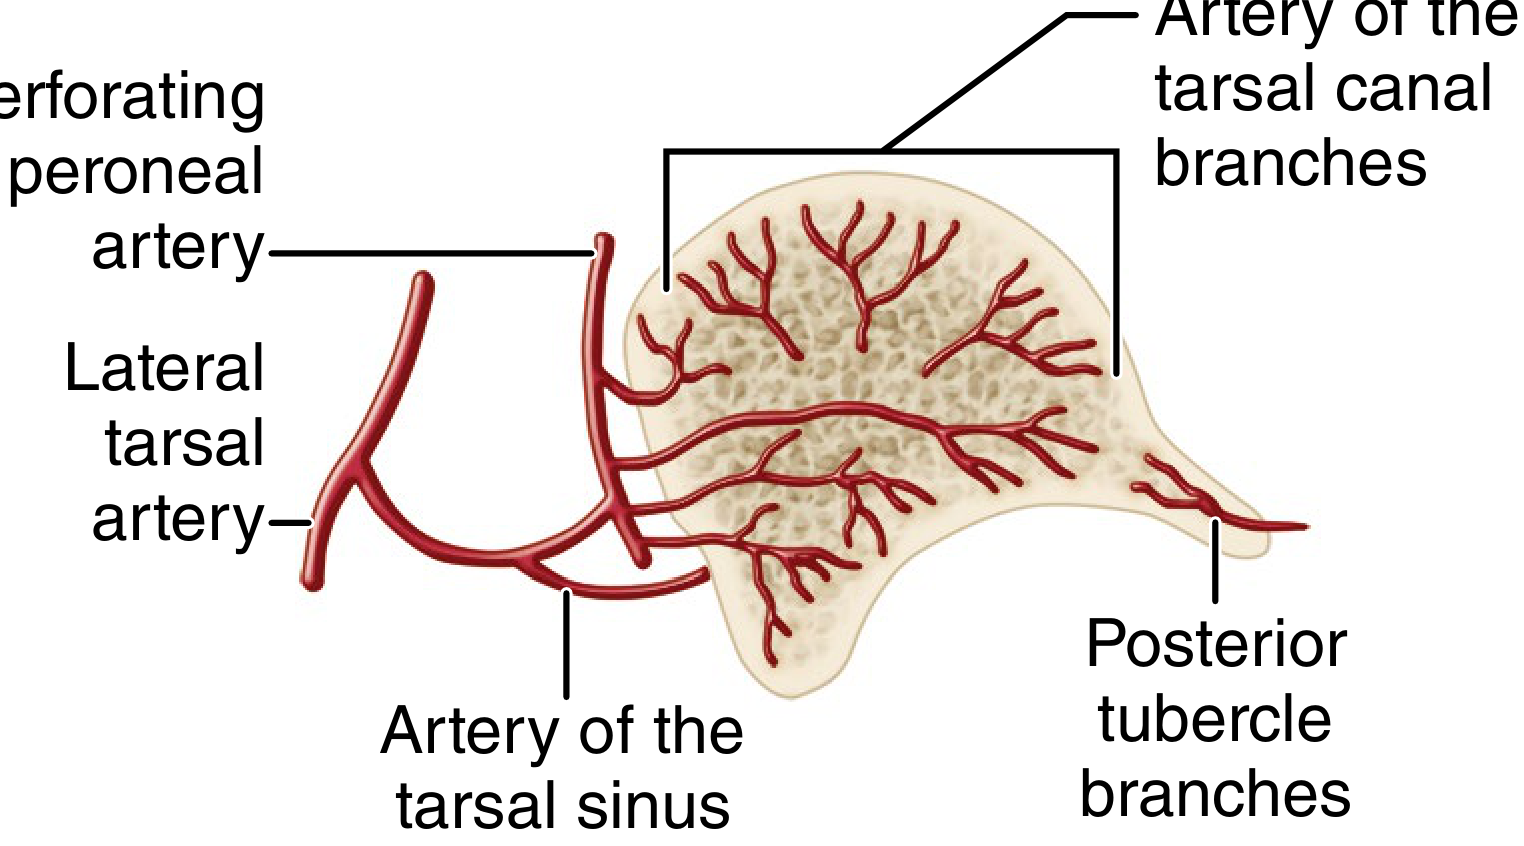
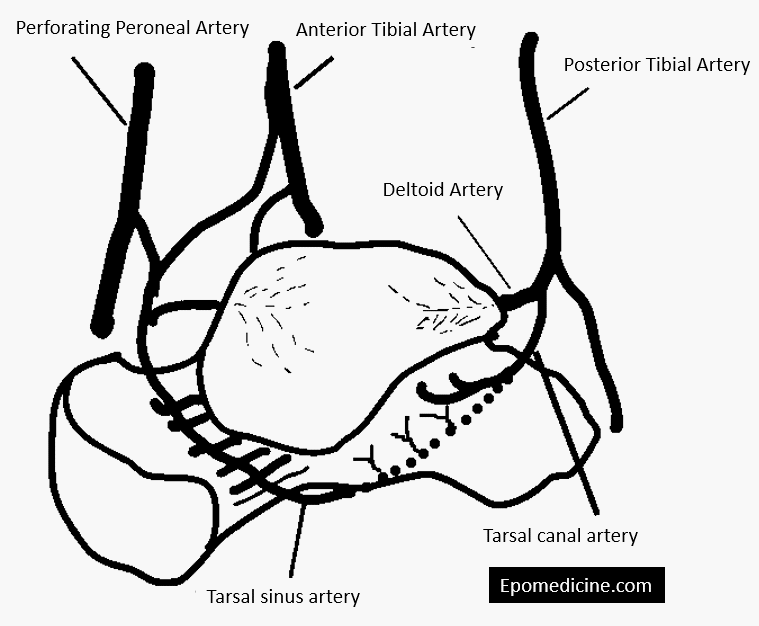
Extraosseous (Source) Arteries
| Source Artery | Contribution |
|---|---|
| Posterior tibial artery | ~47% - dominant supply, gives the artery of the tarsal canal and deltoid artery |
| Anterior tibial artery (dorsalis pedis) | ~36% - gives artery of sinus tarsi, lateral tarsal artery; main supply to anteromedial quadrant |
| Peroneal artery (perforating branch) | ~17% - contributes to artery of sinus tarsi |
Key Named Vessels
1. Artery of the Tarsal Canal (Most Important)
- Origin: Posterior tibial artery, arising ~1 cm proximal to its division into medial and lateral plantar arteries
- Course: Passes through the tarsal canal (the tunnel between the calcaneus and talus, medial to the sinus tarsi)
- Supply: Sends 4-6 direct branches into the talar body - the most consistent and dominant blood supply to the body
- Percentage: Accounts for the majority of the 47% posterior tibial contribution
2. Deltoid Artery
- Origin: Branches off the artery of the tarsal canal
- Supply: Directly supplies the medial 1/4 to 1/2 of the talar body; via intraosseous anastomoses, can supply a greater area
- Clinical note: Preserved if deltoid ligament is intact - this is why even in displaced fractures, if the deltoid is intact, AVN risk is lower
3. Artery of the Sinus Tarsi (Artery of the Tarsal Sinus)
- Origin: Variable - can arise from the perforating peroneal artery, dorsalis pedis, or an anastomosis between the two
- Course: Runs through the sinus tarsi (the lateral funnel-shaped opening between talus and calcaneus)
- Supply: Lateral 1/8 to 1/4 of the talar body; anastomoses with the artery of the tarsal canal
- The anastomosis between artery of the tarsal canal + artery of the sinus tarsi forms the cruciate anastomosis within the tarsal canal/sinus region
4. Posterior Tubercle Branches
- Origin: Direct branches from the posterior tibial artery (most common) or peroneal artery
- Supply: Posterior tubercle of the talus; small, but connected via intraosseous anastomoses
5. Direct Branch to Medial Talar Neck
- Origin: Posterior tibial artery
- Significance: At risk during the anteromedial surgical approach for talar neck fractures; preserved if medial malleolar osteotomy is used for exposure
Supply by Region
| Region | Primary Supply |
|---|---|
| Talar body | Artery of tarsal canal (4-6 branches), deltoid artery |
| Medial body (1/4 - 1/2) | Deltoid artery |
| Lateral body (1/8 - 1/4) | Artery of sinus tarsi |
| Posterior tubercle | Direct PTA branches |
| Talar neck | Artery of sinus tarsi (superior/lateral), artery of tarsal canal (inferior/medial), dorsalis pedis branches |
| Talar head | Dorsalis pedis (anterior tibial) branches, anastomosis from sinus tarsi |
The Retrograde Blood Supply Concept
- A talar neck fracture can strip the blood supply to the body even if the body fragment itself is undisplaced
- The more displacement, the higher the AVN risk
Clinical Relevance - Hawkins Classification & AVN Risk
| Hawkins Type | Description | AVN Risk |
|---|---|---|
| Type I | Non-displaced neck fracture | 0-13% |
| Type II | Subtalar dislocation + neck fracture | 20-50% |
| Type III | Both subtalar + tibiotalar dislocation | 20-100% |
| Type IV | Type III + talonavicular dislocation | Near 100% |
Talus anatomy
talus bone anatomy parts head neck body diagram
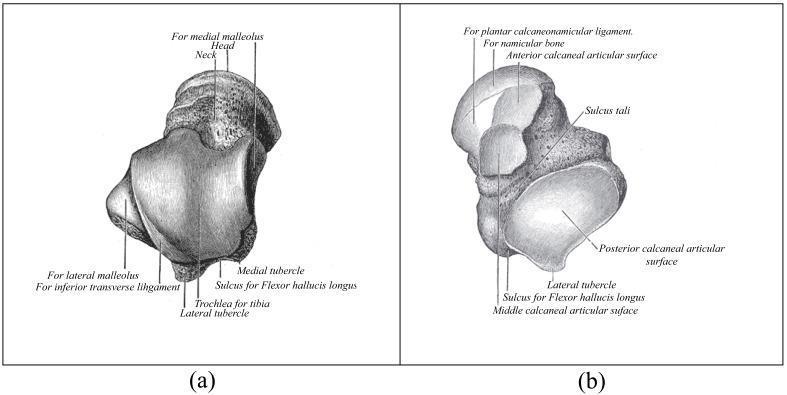
Anatomical diagram presenting two detailed illustrations of the human talus bone, labeled (a) superior view and (b) inferior view. In the superior view, key morphological features include the head, neck, and body of the talus, highlighting the trochlea for tibial articulation and articular surfaces for the medial and lateral malleoli. Notable posterior structures such as the medial and lateral tubercles and the sulcus for the flexor hallucis longus tendon are identified. The inferior view emphasizes the complex articular surfaces for the calcaneus, including the anterior, middle, and posterior calcaneal articular surfaces, separated by the sulcus tali. Additional markers indicate the site for the navicular bone articulation, the plantar calcaneonavicular ligament attachment, and the continuation of the sulcus for the flexor hallucis longus. This clinical illustration is designed for medical students and orthopedic professionals to master the osteology of the ankle joint and its biomechanical relationships.
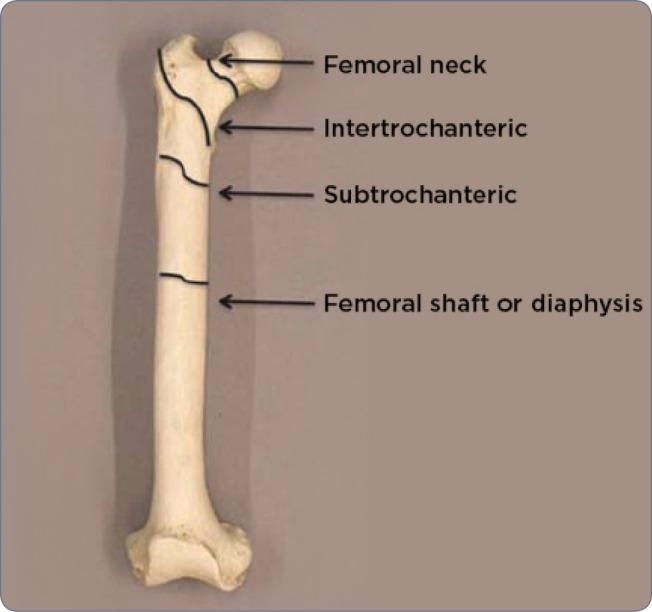
An anatomical diagram of a human femur bone, presented on a neutral background to illustrate common fracture sites and regional anatomy. The image identifies four primary proximal and mid-shaft regions using black labels and arrows. Starting from the proximal end, the 'Femoral neck' is indicated between the femoral head and the trochanters. Immediately distal to this is the 'Intertrochanteric' region, spanning the space between the greater and lesser trochanters. Below this lies the 'Subtrochanteric' region, representing the transition into the main body of the bone. Finally, the long, central portion is labeled as the 'Femoral shaft or diaphysis'. This illustration serves as an educational tool for medical professionals to classify orthopedic injuries, such as hip fractures or atypical femoral fractures (AFF), by precisely defining anatomical zones. The diagram emphasizes the proximal femur’s morphology, including the head, neck, and trochanteric areas, which are critical in radiology and surgical planning.
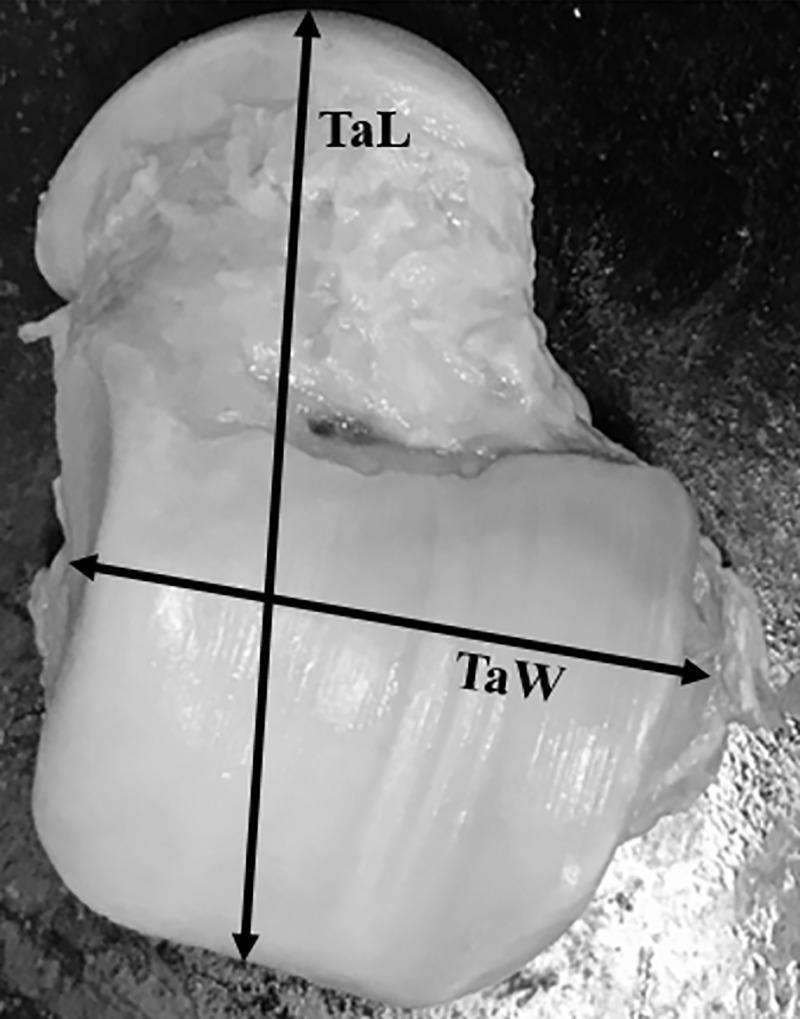
A clinical photograph of an isolated human talus bone specimen, showing the superior aspect. The bone surface appears smooth with preserved articular cartilage across the trochlea and neck regions. Two primary morphometric measurements are superimposed on the image with black double-headed arrows: Talar Length (TaL), extending vertically along the longitudinal axis from the most anterior point of the talar head to the posterior aspect; and Talar Body Width (TaW), extending horizontally across the widest mediolateral dimension of the talar body. This visual serves as an anatomical reference for orthopedic morphometry and surgical planning for ankle arthroplasty or reconstruction. The specimen is presented in a neutral, educational context, highlighting key landmarks used in cadaveric anatomical studies.
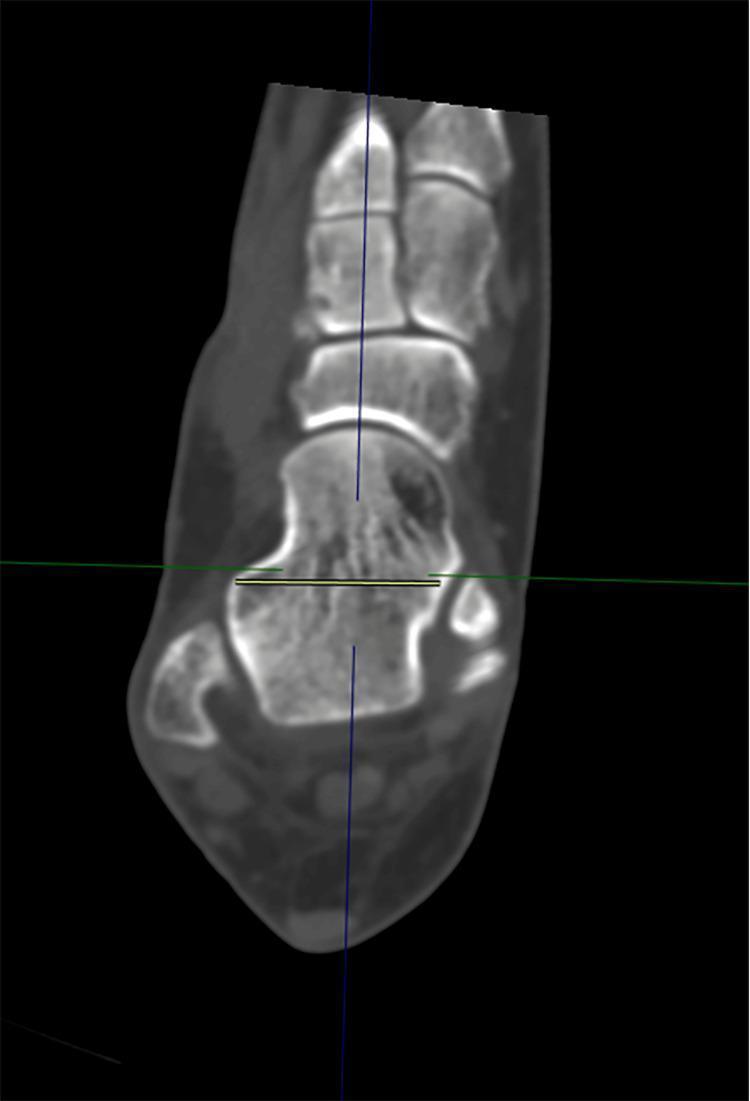
This diagnostic image is an axial computed tomography (CT) scan slice of the human foot, specifically focused on the talus for orthopedic morphometric analysis. The image demonstrates the methodology for measuring Talar Neck Width (TNW). The anatomy shown includes the talar body, the constricted talar neck, and the talar head, with surrounding midfoot structures and the calcaneus partially visible. A yellow horizontal measurement line is placed across the talar neck, extending from the medial border to the lateral border. This measurement is oriented orthogonally to the anatomical longitudinal axis of the talar neck (represented by a blue vertical reference line). A green horizontal reference line intersects the measurement plane to ensure anatomical alignment. This clinical imaging protocol is used in podiatry and orthopedic surgery for preoperative planning, fracture management (such as talar neck fractures), and anatomical studies of foot morphology.
This medical visual consists of two parts: a reference anatomical diagram and a diagnostic image. On the left, a schematic illustration of a human body shows a highlighted sagittal plane to establish anatomical orientation. On the right, a fluoroscopic X-ray image of the head and neck is presented in the sagittal view. The imaging modality is characterized by its circular field of view and dynamic grayscale contrast, typical of real-time fluoroscopy. Anatomically, the image clearly depicts the base of the skull, the facial bones including the maxilla and mandible, and the cervical spine (C1-C7). The articulated vertebrae are visible as radiopaque (lighter) structures against the darker, radiolucent air and soft tissues of the oropharynx and neck. Key landmarks include the spinous processes of the cervical vertebrae and the jawline. This visual is designed for educational use in teaching radiographic anatomy, specifically focusing on spinal alignment, posture, and the structural relationships within the head and neck region during clinical evaluation.
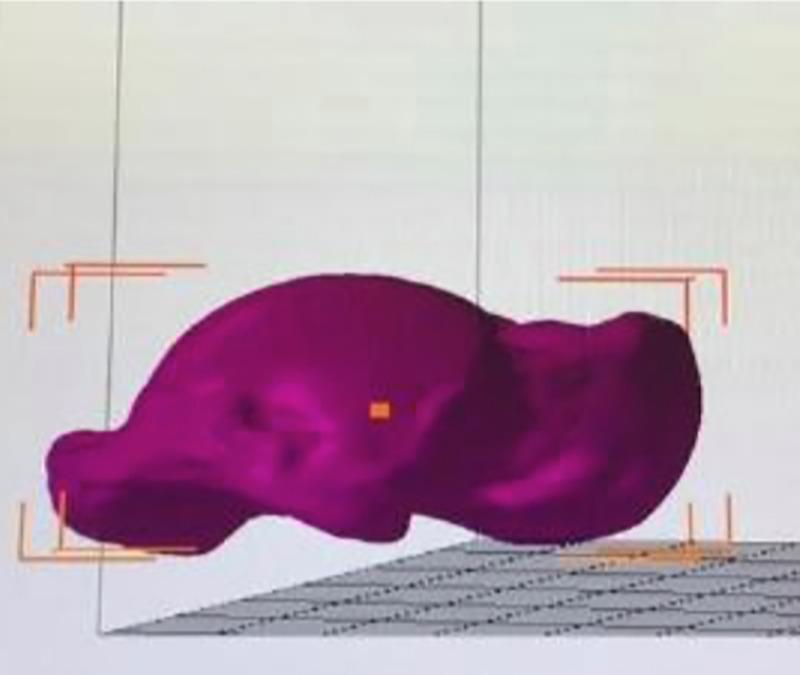
A 3D digital reconstruction of a human talus bone, generated using a laser scanner (HandySCAN 700) and analyzed within Autodesk Netfabb software. The image shows the bone specimen rendered in a solid magenta/purple color, highlighting its complex anatomical contours including the trochlea, neck, and head. The digital model is positioned on a virtual grey grid plane for spatial orientation. Orange bounding box markers and a central anchor point are visible, indicating the software's process for measuring morphometric parameters such as surface area and volume. This visualization is used in orthopedic research to compare anatomical variances and geometric profiles between matched pairs of human cadaveric ankles. The smooth rendering and artificial coloration are typical for CAD-based volumetric and surface analysis in clinical anatomy and podiatric research.
Anatomy of the Talus
Three Anatomic Parts
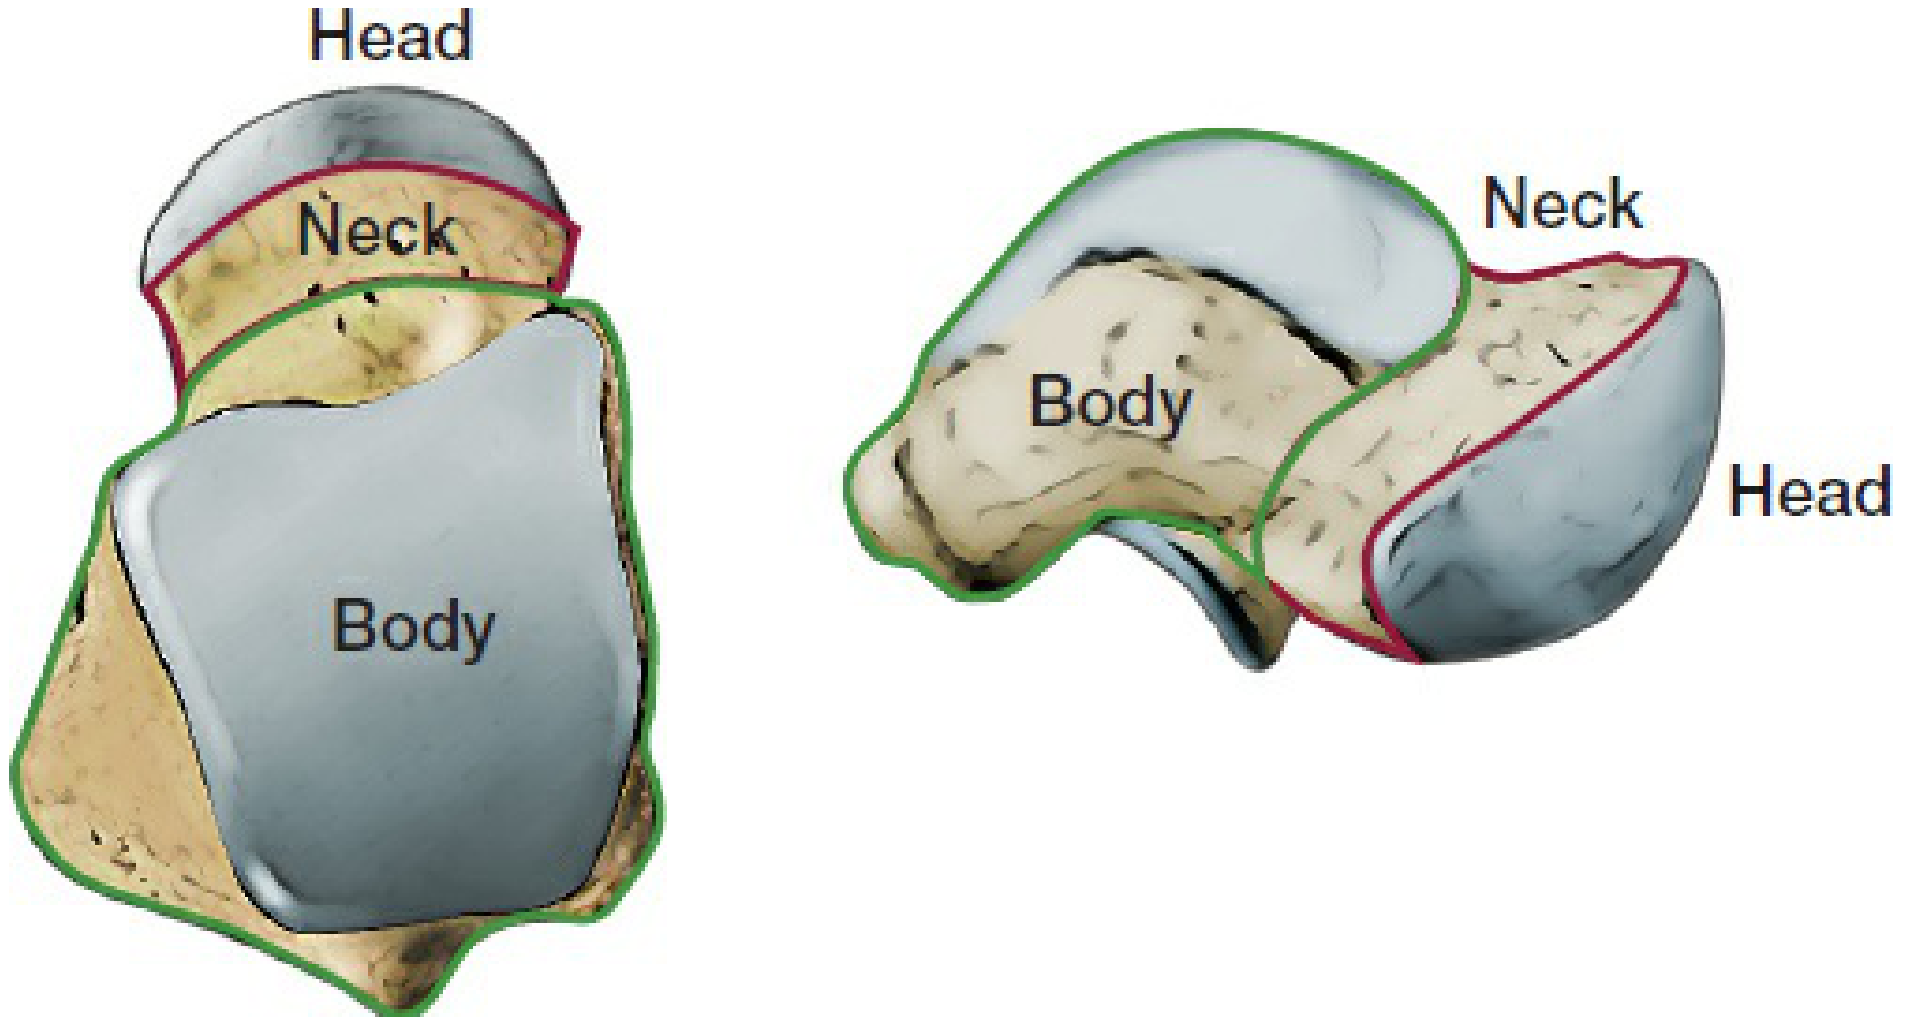
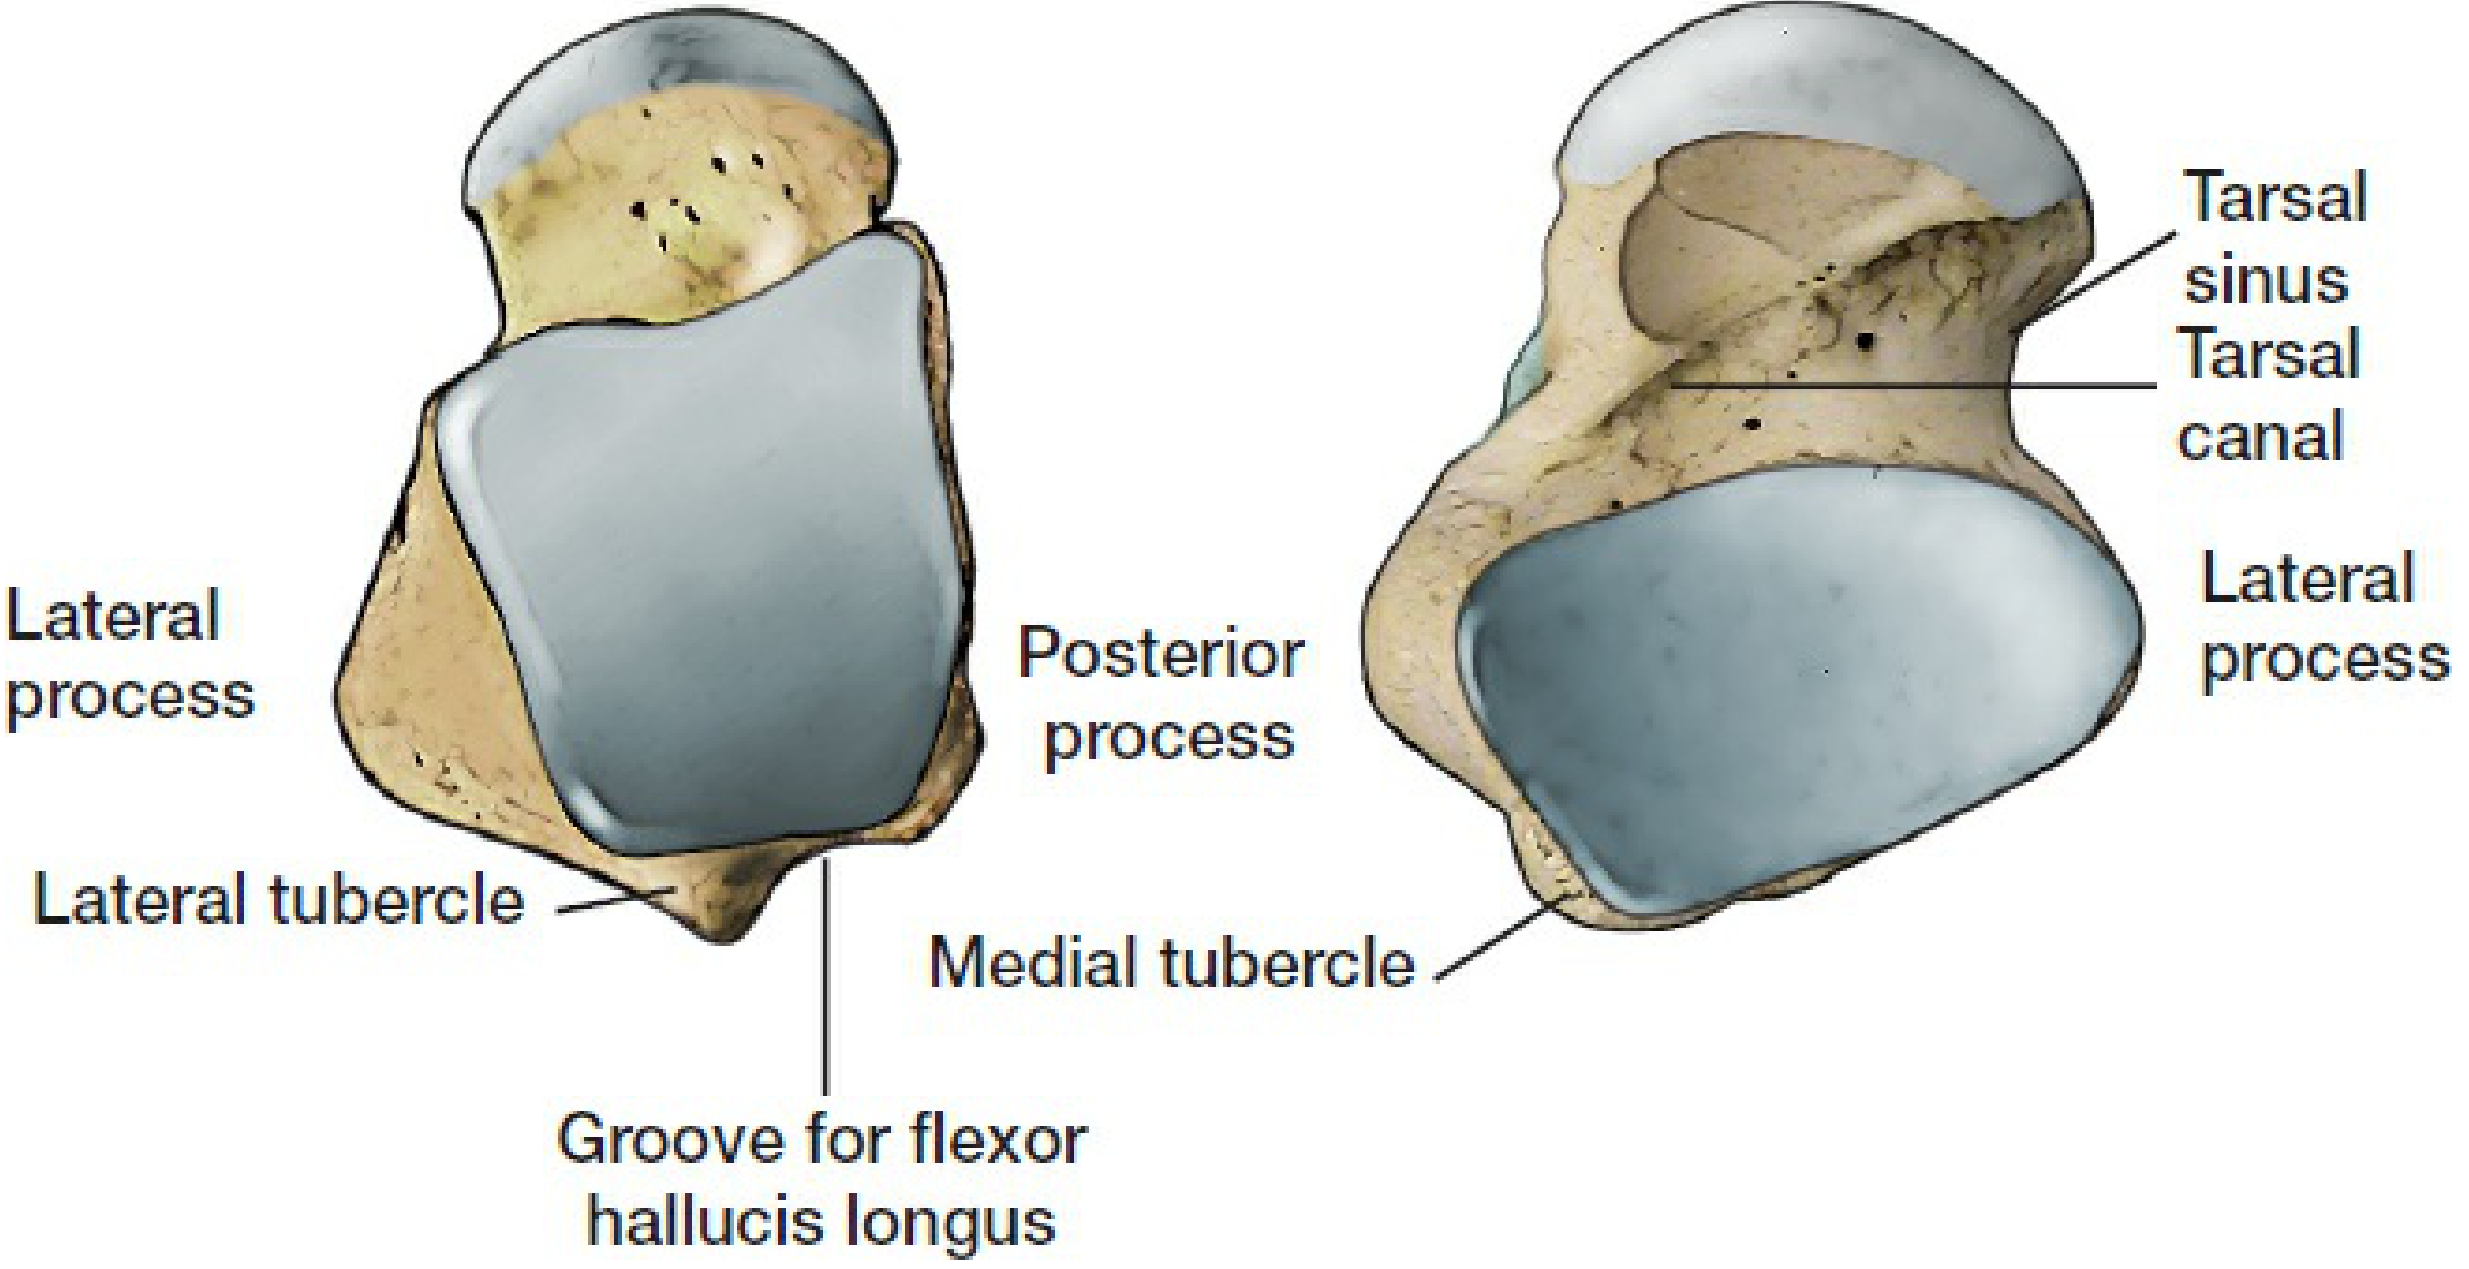
1. Body (Corpus Tali)
Superior Surface - Trochlea (Dome)
- The most important articular surface, articulating with the inferior surface of the tibia (tibial plafond)
- Convex in the sagittal plane, slightly concave in the coronal plane
- Wider anteriorly than posteriorly - a key anatomical feature: when the foot is plantarflexed, this can falsely widen the mortise on X-ray
- Only two-thirds of the trochlea is covered by the tibial articular surface at any ankle position
Medial Surface
- Comma-shaped articular facet
- Articulates with the medial malleolus
- The deltoid ligament attaches here
Lateral Surface
- Triangular articular facet
- Articulates with the medial surface of the lateral malleolus
- Below this articular surface is the lateral process
Lateral Process
- Large, broad-based, wedge-shaped prominence of the inferolateral talar body
- Has two articular surfaces: dorsolateral (fibula) and inferomedial (anterior portion of posterior facet of calcaneus)
- Origin of the lateral talocalcaneal ligament from its tip
- The posterior talofibular ligament attaches at its posteroinferior aspect
- Vulnerable to fracture - "snowboarder's fracture" with forced dorsiflexion and inversion
Posterior Process
- Bears two tubercles: medial and lateral
- The lateral tubercle is larger, projects more posteriorly, and is the one visible on a lateral ankle X-ray
- The medial tubercle is smaller
- Between the two tubercles runs the groove for the flexor hallucis longus (FHL) tendon, which acts as a pulley
- The lateral (posterolateral) tubercle arises from a secondary ossification center fusing around age 12; when unfused, it forms the os trigonum (present in ~50% of feet)
2. Neck (Collum Tali)
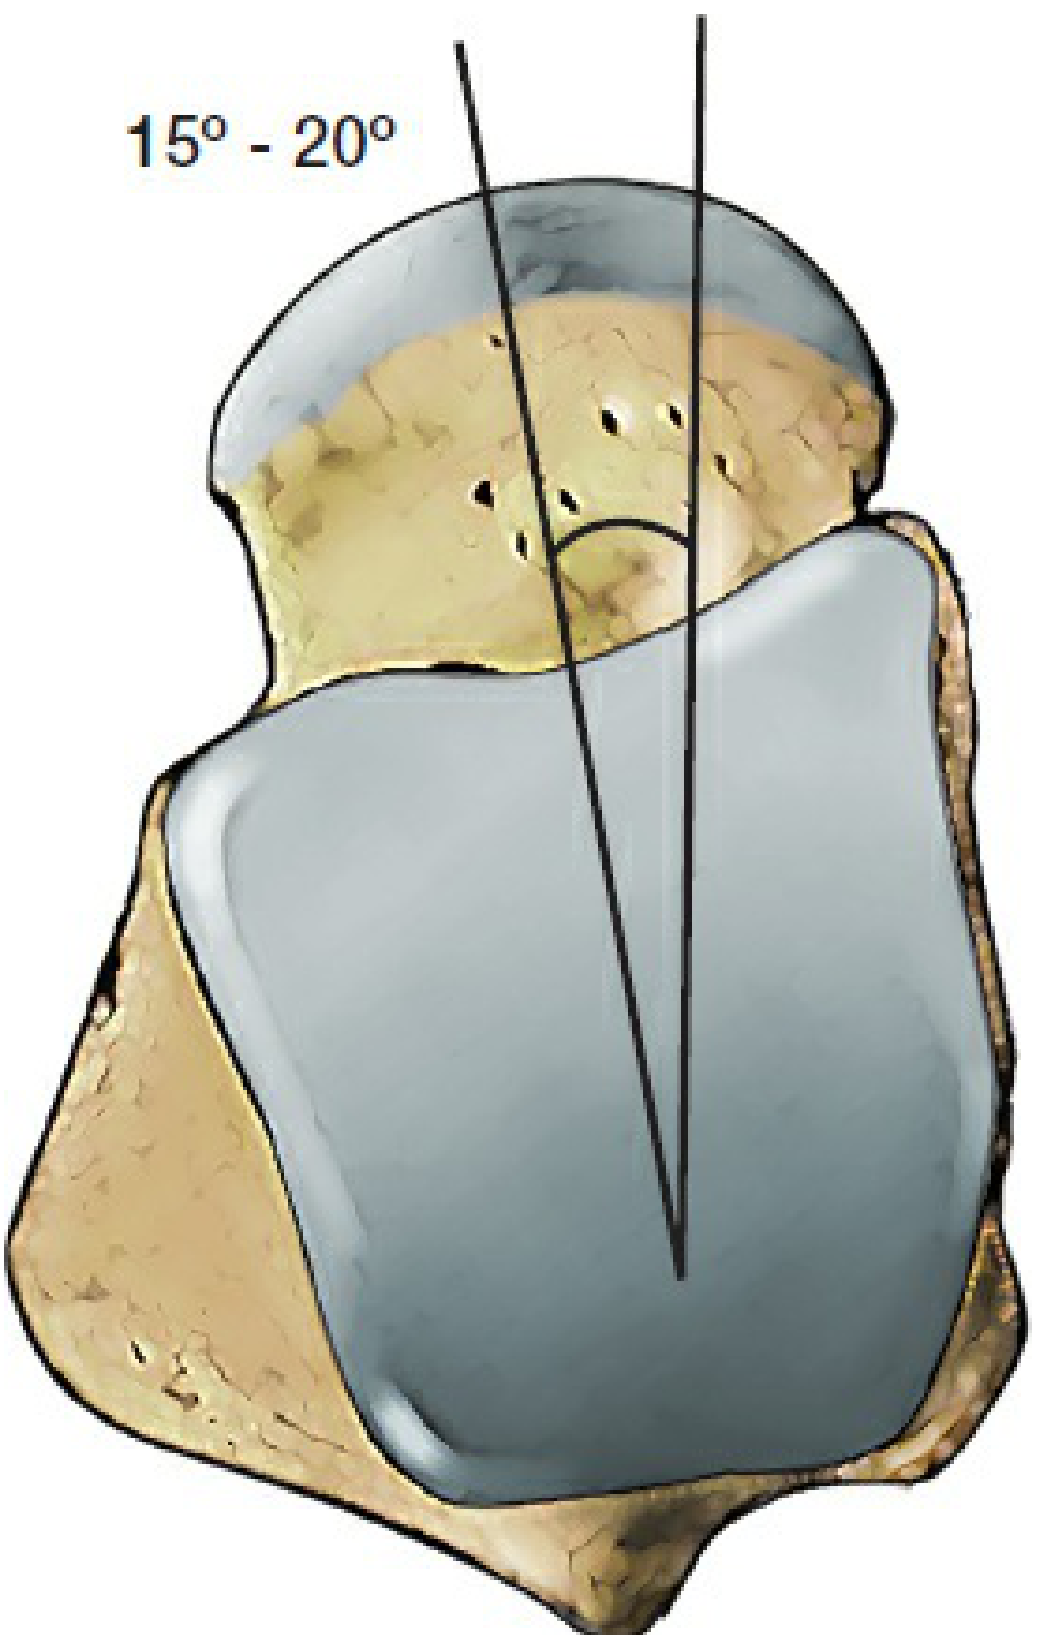
- Connects the body to the head
- Deviates medially 15-20 degrees from the long axis of the body (in the horizontal/transverse plane) - this is the "talar neck angle"
- Also has a plantarward (inferior) angulation
- Superior surface: largely devoid of cartilage, has numerous perforating vessels - this is where blood supply enters and where fractures occur by impaction against the tibial plafond in forced dorsiflexion
- Lateral surface: gives rise to the inferior extensor retinaculum, interosseous talocalcaneal ligament; insertion of the anterior talofibular ligament (ATFL)
- Medial surface: multiple ligamentous attachments - deltoid and talonavicular ligament fibers
- Inferomedial surface: articulates with the middle facet of the calcaneus
3. Head (Caput Tali)
- Covered completely by articular cartilage
- Articulates anteriorly with the navicular bone (talonavicular joint)
- Sits within the acetabulum pedis (the socket of the hindfoot/midfoot), formed by:
- Navicular
- Anterior process of calcaneus
- Spring (plantar calcaneonavicular) ligament
- Posterior tibial tendon (PTT) insertion
- The talonavicular joint provides the greatest degree of motion for the hindfoot joints
Inferior Surface - Articular Facets for Calcaneus
| Facet | Location | Notes |
|---|---|---|
| Posterior calcaneal facet | Large, oval, on the body | Largest facet - bears most of body weight |
| Middle calcaneal facet | On the inferomedial neck | Sits over the sustentaculum tali |
| Anterior calcaneal facet | On the talar head | May be confluent with middle facet |
Joints Formed by the Talus
| Joint | Articulation | Movement |
|---|---|---|
| Ankle (talocrural) | Talus + tibia + fibula | Dorsiflexion / plantarflexion |
| Subtalar (talocalcaneal) | Talus + calcaneus (3 facets) | Inversion / eversion |
| Talonavicular | Talar head + navicular | Abduction / adduction; part of transverse tarsal joint |
Ligamentous Attachments (Key)
| Ligament | Attachment on Talus |
|---|---|
| Deltoid ligament (deep + superficial) | Medial surface of body, medial neck |
| Anterior talofibular ligament (ATFL) | Lateral neck |
| Calcaneofibular ligament (CFL) | Via lateral process indirectly |
| Posterior talofibular ligament (PTFL) | Posteroinferior lateral process |
| Spring (plantar calcaneonavicular) lig. | Supports talar head inferiorly |
| Interosseous talocalcaneal ligament | Within tarsal canal |
| Cervical ligament | Lateral neck / sinus tarsi |
Key Anatomical Points (Clinically Important)
- No muscular/tendinous attachments - blood supply relies entirely on ligamentous and osseous vessels
- Neck is the weakest point - fractures here (aviator's astragalus) by forced dorsiflexion
- Trochlea wider anteriorly - in plantarflexion, narrower posterior part in mortise = less stability
- Neck medial deviation 15-20° - varus malunion is the most common complication of talar neck fractures (because medial comminution is underestimated)
- Os trigonum - in 50% of population; can cause posterior impingement in ballet dancers