
Seizures and epilepsy medicine from basics to CLINICAL final year mbbs medicine
seizure types classification EEG epilepsy diagram
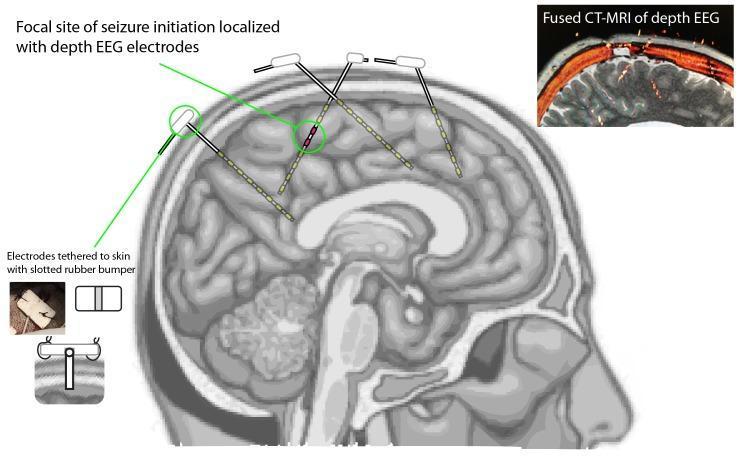
This medical illustration and diagnostic composite demonstrate the use of depth EEG electrodes for localizing a seizure focus in epilepsy management. The primary central image is a sagittal anatomical diagram of the human brain showing four implanted depth electrodes traversing the cortex and subcortical regions. One electrode is highlighted with a green circle, showing red contacts that indicate the focal site of seizure initiation, while non-active contacts on other electrodes are shown in yellow. An upper-right inset displays a 'Fused CT-MRI of depth EEG,' illustrating the radiological correlation of electrode placement within the skull. A lower-left inset provides a technical diagram and clinical photograph detailing the anchoring method, where electrodes are tethered to the scalp using a slotted rubber bumper, staples, and sutures. This visual resource is intended for neurosurgical and neurological education, specifically regarding Phase 2 stereoelectroencephalography (SEEG) and pre-surgical planning for focal epilepsy treatments such as resection or responsive neurostimulation.
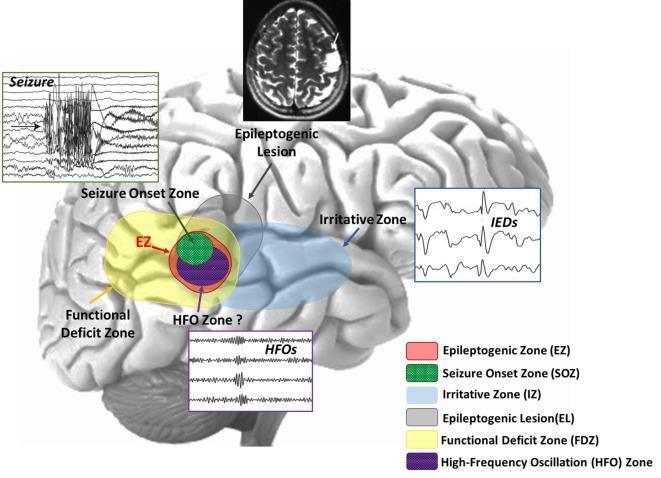
This medical infographic and anatomical diagram illustrates the conceptual and spatial relationships between various cortical zones used in the presurgical evaluation of epilepsy. Set against a lateral view of a human brain, the diagram highlights overlapping regions: the Seizure Onset Zone (SOZ, green), the High-Frequency Oscillation (HFO) zone (purple), and the Epileptogenic Zone (EZ, red outline). These are nested within the broader Functional Deficit Zone (FDZ, yellow) and the Irritative Zone (IZ, blue). The diagram also incorporates multimodal diagnostic data: a cranial MRI at the top showing an 'Epileptogenic Lesion' (EL); a 'Seizure' EEG tracing demonstrating ictal discharge associated with the SOZ; an 'IEDs' (Interictal Epileptiform Discharges) EEG strip corresponding to the IZ; and a localized EEG showing 'HFOs' above 80 Hz. This educational figure demonstrates how epileptologists integrate structural imaging, electrophysiology, and functional mapping to delineate the minimum amount of brain tissue requiring resection for seizure freedom while preserving eloquent cortex. The inclusion of the HFO zone represents modern advances in identifying biomarkers for the EZ.
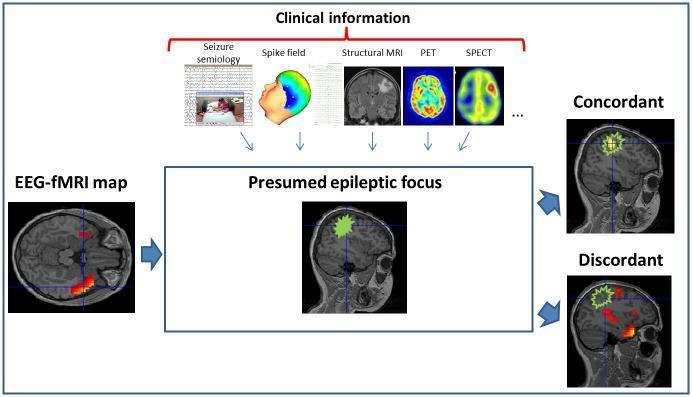
A multimodal diagnostic infographic illustrating the clinical assessment and validation of EEG-fMRI maps in epilepsy. The diagram organizes diverse clinical information used to define a 'Presumed epileptic focus,' including seizure semiology (EEG trace and video), spike field topography, structural MRI (T1-weighted), PET, and SPECT imaging. The central 'Presumed epileptic focus' is represented on a sagittal T1 MRI slice by a green-highlighted region. The infographic demonstrates the methodology for classifying an EEG-fMRI map as 'Concordant' or 'Discordant' based on the spatial overlap between significant BOLD signal changes (indicated by red-to-yellow heat maps) and the clinically defined focus. A concordant map shows BOLD activation within the green-contoured zone, whereas a discordant map displays activation clusters outside this region. This visual highlights the integration of electrophysiological and hemodynamic data for precise neuroanatomical localization of interictal epileptiform discharges (IEDs) in pediatric and adult epilepsy research.
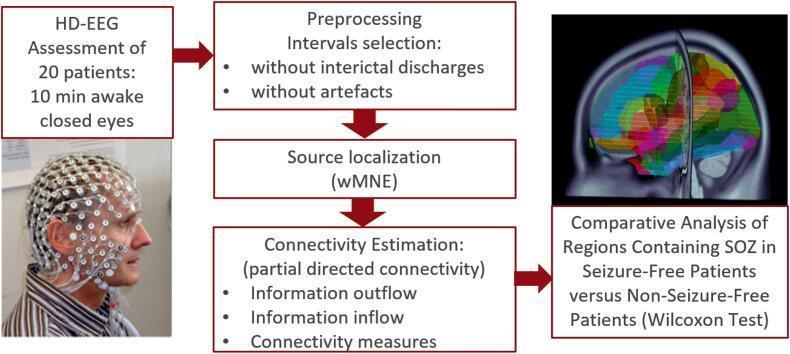
This infographic outlines a neurophysiological analysis strategy for epilepsy research. The flowchart begins with an HD-EEG assessment of 20 patients (10 minutes awake, eyes closed), accompanied by a clinical photograph showing a patient wearing a high-density EEG electrode cap. The process follows a stepwise algorithm: (1) Preprocessing to select intervals without interictal discharges or artifacts; (2) Source localization using weighted Minimum Norm Estimation (wMNE); and (3) Connectivity Estimation focused on partial directed connectivity, specifically information inflow, outflow, and general connectivity measures. The final step is a Comparative Analysis of regions containing the Seizure Onset Zone (SOZ) between seizure-free and non-seizure-free patients using the Wilcoxon Test. This is visually represented by a sagittal diagnostic image of a human brain with a multi-colored cortical segmentation overlay, illustrating anatomical regions of interest. The diagram serves as an educational tool for understanding the diagnostic and analytical pipeline used to predict surgical outcomes based on brain network connectivity in epilepsy patients.
antiepileptic drug mechanism of action GABA sodium channel diagram
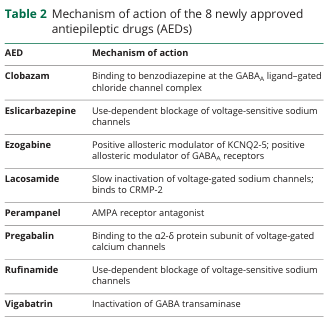
Table 2 Mechanism of action of the 8 newly approved antiepileptic drugs (AEDs) <table><thead><tr><th>AED</th><th>Mechanism of action</th></tr></thead><tbody><tr><td>Clobazam</td><td>Binding to benzodiazepine at the GABA<sub>A</sub> ligand-gated chloride channel complex</td></tr><tr><td>Eslicarbazepine</td><td>Use-dependent blockage of voltage-sensitive sodium channels</td></tr><tr><td>Ezogabine</td><td>Positive allosteric modulator of KCNQ2-5; positive allosteric modulator of GABA<sub>A</sub> receptors</td></tr><tr><td>Lacosamide</td><td>Slow inactivation of voltage-gated sodium channels; binds to CRMP-2</td></tr><tr><td>Perampanel</td><td>AMPA receptor antagonist</td></tr><tr><td>Pregabalin</td><td>Binding to the α2-δ protein subunit of voltage-gated calcium channels</td></tr><tr><td>Rufinamide</td><td>Use-dependent blockage of voltage-sensitive sodium channels</td></tr><tr><td>Vigabatrin</td><td>Inactivation of GABA transaminase</td></tr></tbody></table>
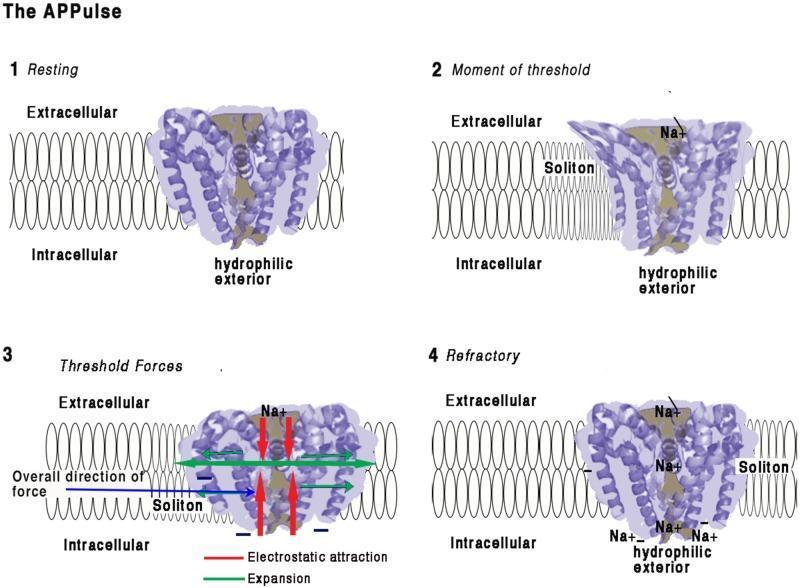
This pathophysiology diagram illustrates the four-stage mechanism of a voltage-gated sodium (Na+) ion channel embedded in a lipid bilayer, focusing on the mechanical and electrostatic changes during depolarization. (1) Resting: The channel's coiled helices are closed, maintaining an electrostatic insulating seal across the 10 nm membrane. (2) Moment of Threshold: An approaching membrane soliton (mechanical wave) exerts pressure, displacing helices and disrupting the electrical insulation. This allows Na+ ions to enter the pore and interact with hydrophilic, negatively charged interior surfaces. (3) Threshold Forces: Inward Na+ influx creates electrostatic attraction (red arrows) toward the intracellular space. Mechanical 'iris-like' opening and contraction occur, causing lateral membrane expansion (green arrows) and a net intracellular force vector (blue arrow). (4) Refractory: Positive charge equalization occurs on the intracellular side, leading to pore closure. The channel remains in a refractory state with localized Na+ accumulation until charges are cleared by diffusion, preventing immediate reactivation.
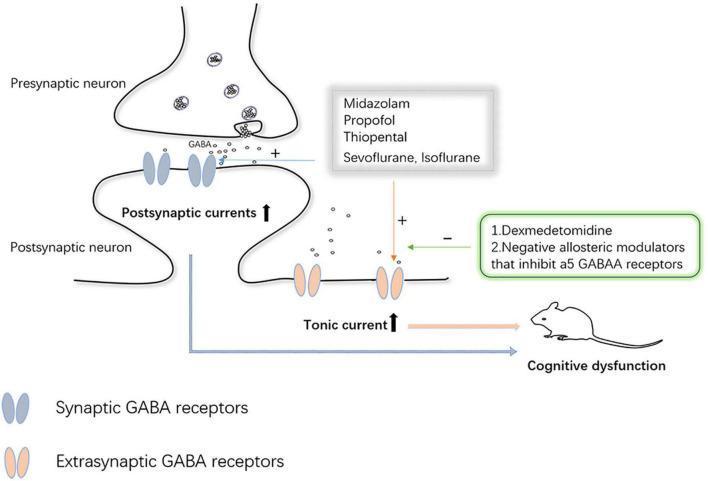
This pathophysiology diagram illustrates the mechanism of GABA receptor-mediated inhibition in neurons and the modulatory effects of anesthetic agents. The illustration depicts a synaptic cleft between a presynaptic neuron, which releases GABA from vesicles, and a postsynaptic neuron. GABA binds to two types of receptors: synaptic GABA receptors, which increase postsynaptic currents, and extrasynaptic GABA receptors, which increase tonic current. The diagram highlights how specific anesthetics—Midazolam, Propofol, Thiopental, Sevoflurane, and Isoflurane—act as positive modulators (+) on both receptor types, particularly enhancing tonic current. Conversely, Dexmedetomidine and negative allosteric modulators of α5 GABAA receptors exert inhibitory effects (-) on these extrasynaptic pathways. The net increase in GABAergic inhibition and tonic current is linked via arrows to a mouse model labeled 'Cognitive dysfunction,' suggesting a clinical correlation between excessive GABAergic tonic signaling and impaired cognitive outcomes. This diagram serves as an educational tool for neuropharmacology and anesthesiology, focusing on GABA receptor distribution and drug-induced neurotoxicity.
EEG 3 Hz spike wave absence epilepsy petit mal
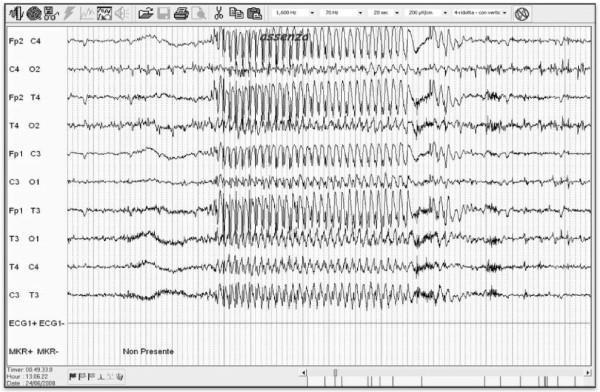
This diagnostic image is a multi-channel electroencephalogram (EEG) recording demonstrating an ictal event in a patient with Childhood Absence Epilepsy. The tracing displays a classic 3 Hz generalized spike-and-wave discharge pattern across multiple electrode pairs, including Fp2-C4, Fp1-C3, T4-C4, and C3-T3. The rhythmic discharge is characterized by high-amplitude, synchronous, and symmetrical complexes that emerge abruptly from the background. Before and after the paroxysmal activity, the background activity shows lower amplitude, less regular fluctuations indicative of interictal baseline states. The EEG montage includes an annotation 'assenza' (absence), marking the clinical correlation of the seizure activity. This recording is clinically significant for evaluating the efficacy of Vagus Nerve Stimulation (VNS) therapy in drug-resistant epilepsy, illustrating the morphology, frequency, and duration of generalized paroxysms used to assess treatment response and seizure reduction.
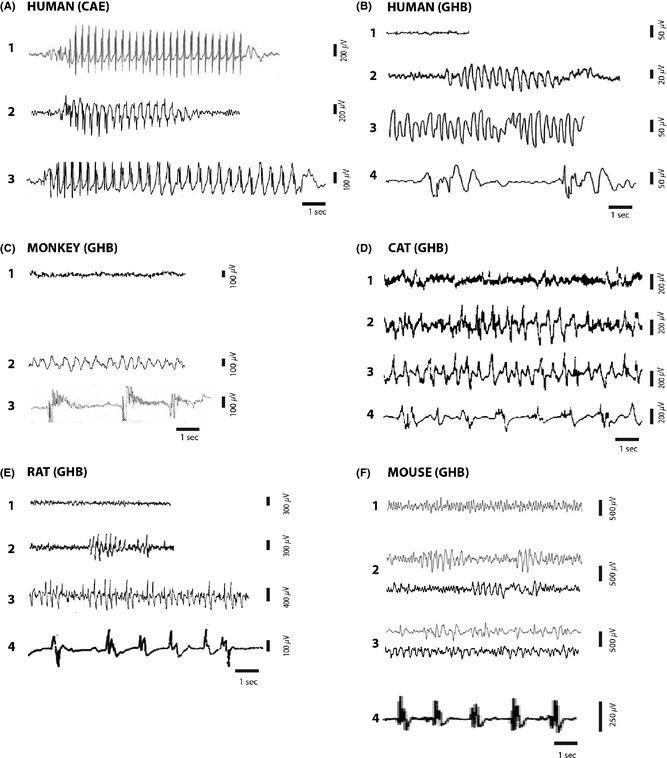
This comparative EEG figure illustrates the neurophysiological signatures of absence seizures (ASs) and gamma-hydroxybutyrate (GHB/GBL)-induced states across humans and animal models (monkey, cat, rat, mouse). Panel A displays scalp EEG from Childhood Absence Epilepsy (CAE) patients, highlighting hallmark 3–4 Hz spike-and-wave discharges (SWDs) emerging abruptly from a desynchronized background. Panels B–F demonstrate dose-dependent progression following GHB/GBL administration: 1) initial desynchronized activity; 2) intermittent slow/delta waves or SWDs (species-dependent, e.g., 2–3 Hz in humans/monkeys, 5–6 Hz in rats); 3) continuous hypersynchronous activity; and 4) a burst-suppression pattern at high doses, characterized by high-amplitude bursts of slow waves interrupting periods of electrical silence. Key educational focus includes the morphological variation of the spike component across species and the shift from intermittent paroxysms to continuous synchronization and deep anesthesia. This serves as a clinical and experimental reference for epilepsy research and pharmacological modeling of impairment of consciousness.
status epilepticus management algorithm flowchart
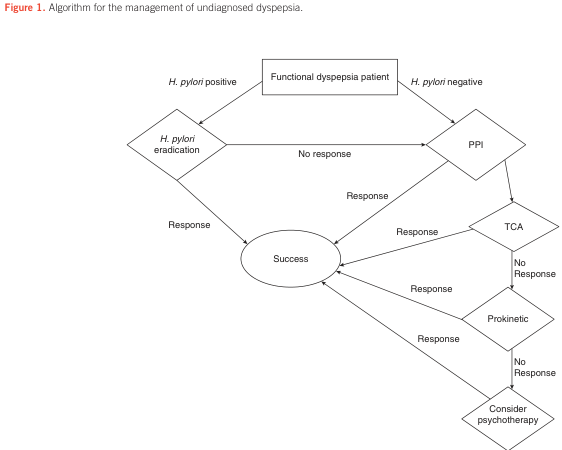
Summary : This figure presents a flowchart algorithm for the management of undiagnosed dyspepsia, guiding clinical decision-making based on H. pylori status and treatment response. flowchart: # Nodes : • Functional dyspepsia patient (rectangle) • H. pylori positive (branch label) • H. pylori negative (branch label) • H. pylori eradication (diamond) • PPI (diamond) • TCA (diamond) • Prokinetic (diamond) • Consider psychotherapy (diamond) • Success (ellipse) • Response (branch label) • No response / No Response (branch label) # Connectors : • From "Functional dyspepsia patient" splits into two branches: "H. pylori positive" leads to "H. pylori eradication"; "H. pylori negative" leads to "PPI". • "H. pylori eradication" has two branches: "Response" leads to "Success"; "No response" leads to "PPI". • "PPI" has two branches: "Response" leads to "Success"; "No response" leads to "TCA". • "TCA" has two branches: "Response" leads to "Success"; "No Response" leads to "Prokinetic". • "Prokinetic" has two branches: "Response" leads to "Success"; "No Response" leads to "Consider psychotherapy". • "Consider psychotherapy" does not branch further. # Layout : • The flowchart is arranged in a top-down manner, starting with the patient node at the top, splitting into two main branches based on H. pylori status, and proceeding through sequential treatment options with decision diamonds and response/no response branches. • All successful responses converge to the "Success" ellipse. # Analysis : • The algorithm prioritises H. pylori eradication for positive patients, and PPI therapy for negative patients. • If initial treatments fail, the flowchart guides escalation to TCA, then prokinetic agents, and finally psychotherapy. • The structure ensures that each treatment step is followed by an assessment of response, with successful outcomes leading to the "Success" node. • The flowchart is linear with no loops, and all pathways eventually terminate at "Success" or "Consider psychotherapy" for non-responders.
![Summary : This flowchart presents the management algorithm for nodal peripheral T-cell lymphoma (PTCL), including PTCL-NOS, TFHL, and ALCL subtypes, stratified by disease stage, ALK status, and risk features. It details systemic and non-systemic anticancer therapies, radiotherapy, and autologous stem-cell transplantation (ASCT) recommendations.
flowchart:
# Nodes :
• Nodal PTCL (start, top-level box)
• PTCL-NOS, TFHL (decision node)
• Stage I-II (decision node)
• 3-4 cycles CHO(E)P [IV, B] (treatment node)
• Consolidative ISRT [IV, B] (treatment node)
• CR (complete remission, outcome node)
• No further treatment (end node)
• Stage III-IV (decision node)
• 6 cycles CHO(E)P [II, B] (treatment node)
• CR (outcome node)
• ASCT [III, C] (treatment node)
• Stage I-II ALCL (decision node)
• ALK positive, non-bulky, IPI 0-1 / ALK negative, non-bulky, IPI 0-1 (decision node)
• 3-4 cycles BV-CHP [III, B] or CHOEP [III, B] (treatment node)
• Consolidative ISRT [IV, B] (treatment node)
• CR (outcome node)
• No further treatment (end node)
• ALK negative, bulky or IPI >1 / High-risk ALK positive (decision node)
• 6 cycles BV-CHP [II, A] or CHO(E)P [III, B] (treatment node)
• Consolidative ISRT [IV, B] (treatment node)
• CR (outcome node)
• ASCTa [II, B] (treatment node)
• Stage III-IV ALCL (decision node)
• ALK positive (decision node)
• 6 cycles BV-CHP [I, A] or CHO(E)P [III, B] (treatment node)
• CR (outcome node)
• No further treatment (end node)
• ALK negative / High-risk ALK positive (decision node)
• 6 cycles BV-CHP [I, A] or CHO(E)P [III, B] (treatment node)
• CR (outcome node)
• ASCT [II, B] (treatment node)
# Connectors :
• Top-down arrows connect each decision node to its respective treatment and outcome nodes.
• Branching occurs at each disease stage and ALK status, splitting into different treatment pathways.
• Some branches merge at common nodes (e.g., CR, ASCT, No further treatment).
• Footnotes (a, b) clarify alternative or additional recommendations for specific high-risk groups.
# Layout :
• The flowchart is organized horizontally by disease subtype and stage (PTCL-NOS/TFHL, Stage I-II ALCL, Stage III-IV ALCL).
• Each subtype/stage column flows vertically from initial diagnosis through treatment, remission, and post-remission management.
• Colour coding: purple for algorithm title, dark green for radiotherapy, blue for systemic therapy, white for non-treatment aspects.
# Analysis :
• The flowchart provides a clear, stepwise approach to managing nodal PTCL, emphasizing risk-adapted therapy.
• Early-stage disease often receives fewer cycles of chemotherapy and consolidative radiotherapy, with no further treatment if remission is achieved.
• Advanced-stage or high-risk disease typically receives more intensive therapy, with ASCT considered for consolidation.
• ALK status and IPI score are critical in determining the treatment pathway for ALCL.
• The algorithm highlights the importance of individualized therapy based on disease characteristics and response.](https://cdn.orris.care/cdss_images/GLGCA_4779772_1766687372936_663455a5-5e63-498d-91ab-79df6a901c83_25f47d00-8fbc-4616-843c-dcce91c28b25.png)
Summary : This flowchart presents the management algorithm for nodal peripheral T-cell lymphoma (PTCL), including PTCL-NOS, TFHL, and ALCL subtypes, stratified by disease stage, ALK status, and risk features. It details systemic and non-systemic anticancer therapies, radiotherapy, and autologous stem-cell transplantation (ASCT) recommendations. flowchart: # Nodes : • Nodal PTCL (start, top-level box) • PTCL-NOS, TFHL (decision node) • Stage I-II (decision node) • 3-4 cycles CHO(E)P [IV, B] (treatment node) • Consolidative ISRT [IV, B] (treatment node) • CR (complete remission, outcome node) • No further treatment (end node) • Stage III-IV (decision node) • 6 cycles CHO(E)P [II, B] (treatment node) • CR (outcome node) • ASCT [III, C] (treatment node) • Stage I-II ALCL (decision node) • ALK positive, non-bulky, IPI 0-1 / ALK negative, non-bulky, IPI 0-1 (decision node) • 3-4 cycles BV-CHP [III, B] or CHOEP [III, B] (treatment node) • Consolidative ISRT [IV, B] (treatment node) • CR (outcome node) • No further treatment (end node) • ALK negative, bulky or IPI >1 / High-risk ALK positive (decision node) • 6 cycles BV-CHP [II, A] or CHO(E)P [III, B] (treatment node) • Consolidative ISRT [IV, B] (treatment node) • CR (outcome node) • ASCTa [II, B] (treatment node) • Stage III-IV ALCL (decision node) • ALK positive (decision node) • 6 cycles BV-CHP [I, A] or CHO(E)P [III, B] (treatment node) • CR (outcome node) • No further treatment (end node) • ALK negative / High-risk ALK positive (decision node) • 6 cycles BV-CHP [I, A] or CHO(E)P [III, B] (treatment node) • CR (outcome node) • ASCT [II, B] (treatment node) # Connectors : • Top-down arrows connect each decision node to its respective treatment and outcome nodes. • Branching occurs at each disease stage and ALK status, splitting into different treatment pathways. • Some branches merge at common nodes (e.g., CR, ASCT, No further treatment). • Footnotes (a, b) clarify alternative or additional recommendations for specific high-risk groups. # Layout : • The flowchart is organized horizontally by disease subtype and stage (PTCL-NOS/TFHL, Stage I-II ALCL, Stage III-IV ALCL). • Each subtype/stage column flows vertically from initial diagnosis through treatment, remission, and post-remission management. • Colour coding: purple for algorithm title, dark green for radiotherapy, blue for systemic therapy, white for non-treatment aspects. # Analysis : • The flowchart provides a clear, stepwise approach to managing nodal PTCL, emphasizing risk-adapted therapy. • Early-stage disease often receives fewer cycles of chemotherapy and consolidative radiotherapy, with no further treatment if remission is achieved. • Advanced-stage or high-risk disease typically receives more intensive therapy, with ASCT considered for consolidation. • ALK status and IPI score are critical in determining the treatment pathway for ALCL. • The algorithm highlights the importance of individualized therapy based on disease characteristics and response.
Seizures & Epilepsy: Basics to Clinical (Final Year MBBS)
1. DEFINITIONS
Prevalence: ~2 million in the US; ~44 new cases per 100,000/year. Nearly two-thirds of all seizures begin in childhood. Incidence rises again after age 60.
- Adams and Victor's Principles of Neurology, 12th Edition
2. ILAE 2017 CLASSIFICATION OF SEIZURE TYPES
A. FOCAL ONSET SEIZURES (formerly "partial")
| New Term | Old Term | Key Features |
|---|---|---|
| Focal aware seizure | Simple partial seizure | Consciousness PRESERVED; aura = simple partial seizure |
| Focal impaired awareness seizure | Complex partial seizure | Consciousness IMPAIRED; automatisms common |
| Focal to bilateral tonic-clonic | Secondary generalized | Starts focal, spreads to both hemispheres |
- Temporal lobe: deja vu, rising epigastric sensation, fear, olfactory hallucinations
- Frontal lobe: versive (head/eye deviation), brief, often nocturnal
- Occipital lobe: formed or unformed visual hallucinations
- Parietal lobe: contralateral sensory symptoms (tingling/numbness)
B. GENERALIZED ONSET SEIZURES
| Seizure Type | Key Clinical Features | EEG |
|---|---|---|
| Tonic-clonic ("Grand Mal") | Loss of consciousness, tonic stiffening then clonic jerking <3 min, postictal confusion | Generalized polyspike-wave |
| Absence ("Petit Mal") | 4-20 sec blank stare, NO postictal confusion, immediate resumption | 3 Hz spike-and-wave |
| Myoclonic | Brief (<100 ms) sudden jerks, usually morning/after waking | Polyspike-wave |
| Tonic | Sustained stiffening without clonic phase | Generalized fast activity |
| Atonic (Drop attacks) | Sudden loss of muscle tone, fall, no postictal period | Generalized slow spike-wave |
| Epileptic spasms | Infantile spasms (West syndrome) - flexion/extension, clusters on waking | Hypsarrhythmia |
- Katzung's Basic and Clinical Pharmacology, 16th Edition and Goldman-Cecil Medicine
C. UNKNOWN ONSET (insufficient information)
3. EEG CORRELATES - HIGH YIELD
- Absence: 3 Hz generalized spike-and-wave - classic and pathognomonic
- JME: 4-6 Hz polyspike-and-slow-wave (worse in the morning)
- West Syndrome: Hypsarrhythmia (chaotic high-amplitude slow waves with multifocal spikes)
- Lennox-Gastaut: Slow <2.5 Hz generalized spike-wave + slow background
- Temporal lobe epilepsy: Unilateral temporal sharp waves and spikes
- Benign childhood epilepsy with centrotemporal spikes (BECTS/Rolandic): Centrotemporal sharp waves, sleep-activated
4. IMPORTANT EPILEPSY SYNDROMES
Idiopathic Generalized Epilepsies (Genetic Generalized Epilepsies)
| Syndrome | Age of Onset | Seizure Types | Key Feature | Drug of Choice |
|---|---|---|---|---|
| Childhood Absence Epilepsy (CAE) | 4-10 years (peak 5-7) | Typical absences | Remits by puberty in 70% | Ethosuximide, Valproate |
| Juvenile Absence Epilepsy (JAE) | 10-17 years | Absences + occasional GTC | Persists into adulthood | Valproate, Lamotrigine |
| Juvenile Myoclonic Epilepsy (JME) | 12-18 years | Myoclonus on waking + GTC | Lifelong; photosensitive; precipitated by sleep deprivation | Valproate (drug of choice); avoid carbamazepine! |
| Epilepsy with GTC on Awakening | Adolescence | GTC on waking | Photosensitive | Valproate |
Focal / Structural Epilepsies
- Aura: rising epigastric sensation, deja vu, fear
- Automatisms: oropharyngeal (chewing, lip-smacking), hand fumbling
- Ictal: staring, unresponsive, postictal confusion
- Cause: febrile seizures in childhood are the classic risk factor for hippocampal sclerosis
- MRI: hippocampal atrophy and T2/FLAIR signal increase
- Treatment: medically refractory in 30-40%; surgical resection (temporal lobectomy) gives 60-70% seizure freedom
Developmental and Epileptic Encephalopathies (DEE)
| Syndrome | Age | Seizures | EEG | Treatment |
|---|---|---|---|---|
| West Syndrome | 3-12 months | Epileptic spasms (clusters on waking) | Hypsarrhythmia | ACTH, Vigabatrin (TSC), Prednisolone |
| Lennox-Gastaut | 2-6 years | Tonic, atonic (drops), atypical absences | Slow spike-wave (<2.5 Hz) + slow background | Valproate, Rufinamide, Clobazam; avoid carbamazepine |
| Dravet Syndrome | 1st year | Prolonged febrile hemiclonic → multitype | Normal initially, later spike-wave | SCN1A mutation; avoid Na-channel blockers; use Valproate, Clobazam, Stiripentol |
5. PATHOPHYSIOLOGY OF SEIZURES
The Core Mechanism
At the cellular level - the "Paroxysmal Depolarization Shift (PDS)":
Spread:
- Focal seizure: contained within one region; inhibitory "surround" normally prevents spread
- Secondary generalization: breakdown of surround inhibition allows spread through corticothalamic circuits
- Generalized onset: involves both hemispheres from the start via thalamocortical oscillations (especially relevant for absence seizures - the thalamus drives the 3 Hz rhythm)
6. ETIOLOGY (Mnemonic: VITAMINS D)
| Category | Examples |
|---|---|
| Vascular | Stroke, AVM, venous sinus thrombosis |
| Infectious | Meningitis, encephalitis, neurocysticercosis, TB, HIV |
| Traumatic | TBI, subdural hematoma, penetrating injury |
| Autoimmune | Anti-NMDAR encephalitis, LGI1, CASPR2 encephalitis |
| Metabolic | Hypo/hyperglycemia, hyponatremia, hypocalcemia, uraemia, hepatic encephalopathy |
| Idiopathic/Genetic | SCN1A (Dravet), KCNQ2, gene mutations |
| Neoplastic | Primary/metastatic brain tumors |
| Structural | Hippocampal sclerosis, cortical dysplasia, tuberous sclerosis |
| Drug/Toxin | Cocaine, TCAs, isoniazid (pyridoxine deficiency), alcohol withdrawal |
7. CLINICAL APPROACH TO A SEIZURE PATIENT
History (most important tool!)
- Eyewitness account - duration, movements, eye deviation, incontinence, tongue bite (lateral = tonic-clonic; tip = syncope)
- Postictal state - confusion/headache/focal deficit (Todd's paralysis) = strongly suggests seizure over syncope
- Aura - type tells you onset location
- Precipitants - sleep deprivation, alcohol, flashing lights, missed medications, fever
- Developmental and family history for genetic epilepsy syndromes
Differentiating Seizure from Syncope (High-yield)
| Feature | Tonic-Clonic Seizure | Syncope (Convulsive) |
|---|---|---|
| Posture at onset | Any | Upright (situational/vasovagal) |
| Warning | Aura (minutes) | Lightheadedness, greying out (seconds) |
| Duration of loss of consciousness | Minutes | Seconds |
| Jerking movements | Rhythmic, sustained, 30-90 sec | Brief, few jerks only |
| Tongue bite | Lateral | Tip (rare) |
| Urinary incontinence | Common | Less common |
| Postictal confusion | Prominent (15 min to hours) | Rapid recovery (<1 min) |
| Color | Cyanotic | Pale |
| ECG/tilt table | Normal | May be abnormal |
Todd's Paralysis
8. INVESTIGATIONS
EEG
- Routine EEG: 20-40% sensitivity for interictal epileptiform discharges (IEDs) on a single recording
- Sleep-deprived EEG: Increases yield to ~80% (especially JME)
- Prolonged/ambulatory EEG or Video EEG telemetry for pre-surgical evaluation
- Activating procedures: Hyperventilation (provokes absence seizures), photic stimulation (JME)
MRI Brain (preferred over CT)
- Protocol: MRI epilepsy protocol (thin coronal cuts through hippocampus, FLAIR, T1 inversion recovery)
- Hippocampal sclerosis, cortical dysplasia, cavernomas, tumors, gliosis
Blood tests
- Glucose, electrolytes (Na⁺, Ca²⁺, Mg²⁺), urea, liver function, toxicology screen
- Prolactin: rises 10-30 min after a generalized tonic-clonic seizure (useful to differentiate from pseudoseizure; level >3× normal is supportive)
Lumbar Puncture
- Indicated if meningitis/encephalitis is suspected
9. ANTIEPILEPTIC DRUGS (AEDs) - MECHANISMS AND CLINICAL USE
Mechanisms of Action (Master Table)
| Mechanism | Drugs | Target |
|---|---|---|
| Na⁺ channel fast inactivation (block sustained firing) | Phenytoin, Carbamazepine, Oxcarbazepine, Lamotrigine, Valproate | Prevent repetitive action potentials |
| Na⁺ channel slow inactivation | Lacosamide | Unique MOA - spike frequency adaptation |
| T-type Ca²⁺ channel block | Ethosuximide, Valproate | Block thalamic oscillations → absence |
| N/P-type Ca²⁺ channel (α2δ subunit) | Gabapentin, Pregabalin | Reduce glutamate release presynaptically |
| GABA-A positive allosteric modulation | Benzodiazepines (↑ Cl⁻ channel frequency), Phenobarbital (↑ Cl⁻ channel duration) | Enhance inhibition |
| GABA reuptake inhibition | Tiagabine | ↑ Synaptic GABA |
| GABA transaminase inhibition | Vigabatrin | ↑ GABA (irreversible) |
| SV2A modulation (vesicular protein) | Levetiracetam, Brivaracetam | ↓ Neurotransmitter release |
| AMPA receptor antagonism | Perampanel | Reduce fast excitatory transmission |
| Multiple | Topiramate, Valproate | Na⁺ channels + GABA + AMPA + Ca²⁺ |
| mTOR inhibitor | Everolimus | Tuberous sclerosis complex |
- Adams and Victor's Principles of Neurology and Katzung's Basic and Clinical Pharmacology
Drug of Choice by Seizure Type (Key Exam Points)
| Seizure/Syndrome | First-line | Notes |
|---|---|---|
| Focal seizures (any type) | Carbamazepine, Lamotrigine, Levetiracetam | CBZ is classic standard |
| Generalized tonic-clonic | Valproate, Lamotrigine, Levetiracetam | |
| Absence (CAE) | Ethosuximide or Valproate | Ethosuximide is drug of choice for pure absence; Valproate if GTC co-exists |
| JME | Valproate (avoid CBZ/OXC - can worsen myoclonus!) | Lamotrigine if Valproate not tolerated |
| West syndrome | ACTH / Prednisolone + Vigabatrin (TSC-related) | |
| Neonatal seizures | Phenobarbital (IV) | |
| Febrile seizures | Rectal diazepam (acute) | No chronic prophylaxis needed |
| Lennox-Gastaut | Valproate, Rufinamide, Clobazam | Lamotrigine for drops; AVOID CBZ |
| Dravet syndrome | Valproate + Clobazam + Stiripentol | AVOID Na-channel blockers (SCN1A) |
| Women of childbearing age | Lamotrigine (preferred) | Valproate is TERATOGENIC - avoid if possible |
Side Effects to Know
| Drug | Side Effects | Notes |
|---|---|---|
| Phenytoin | Gingival hyperplasia, hirsutism, ataxia/nystagmus, Stevens-Johnson, osteomalacia, zero-order kinetics | Enzyme inducer; precipitates in dextrose |
| Carbamazepine | Diplopia, hyponatremia (SIADH), aplastic anemia, SJS (HLA-B*1502 in Asian populations), enzyme inducer | Check sodium in elderly |
| Valproate | Teratogenicity (neural tube defects), weight gain, tremor, hair loss, hepatotoxicity, pancreatitis, PCOS | Enzyme INHIBITOR; contraindicated in pregnancy |
| Phenobarbital | Sedation, cognitive impairment, behavioural problems in children, enzyme inducer | |
| Lamotrigine | Rash (including SJS) - slow titration prevents this; insomnia | Safe in pregnancy |
| Levetiracetam | Irritability, mood disturbance, psychosis | No drug interactions; IV form available |
| Ethosuximide | GI upset, headache, Stevens-Johnson (rare) | Only for absence - worsens GTC |
| Vigabatrin | Irreversible visual field defects (bitemporal) | Use only for infantile spasms/TSC |
| Topiramate | Cognitive impairment ("Dopamax"), nephrolithiasis, glaucoma, weight loss, teratogenic (oral cleft) | |
| Gabapentin/Pregabalin | Sedation, weight gain, peripheral edema |
10. STATUS EPILEPTICUS (SE) - CRITICAL MANAGEMENT
Definition
Classification
- Convulsive SE: Tonic-clonic movements - immediate life threat
- Non-convulsive SE (NCSE): Subtle or no motor activity, impaired consciousness - requires EEG for diagnosis; often missed
- Refractory SE: Fails first-line + second-line AEDs
- Super-refractory SE: Persists >24h after general anesthesia
Management Protocol (Timeline)
- Airway, Breathing, Circulation
- IV access + bloods (glucose, electrolytes, drug screen)
- IV thiamine (100mg) BEFORE glucose in any alcoholic/malnourished patient
- IV dextrose (50 mL of 50%) if hypoglycemia present or unknown
- Lorazepam 0.1 mg/kg IV (max 4mg per dose, can repeat once) - PREFERRED (longer CNS duration than diazepam)
- Diazepam 0.15 mg/kg IV (or rectal 10-20 mg if no IV access) - rate 2-5 mg/min
- Midazolam 10 mg IM/buccal if no IV access
- Phenytoin 15-20 mg/kg IV at ≤50 mg/min in normal saline (NOT dextrose - precipitates)
- Monitor BP and ECG (risk of hypotension and heart block)
- Fosphenytoin 15-20 mg PE/kg (phosphate ester prodrug - can run faster, 100-150 mg/min; given in dextrose OK)
- Levetiracetam 60 mg/kg IV (up to 4500 mg) - well tolerated, fewer drug interactions
- Valproate 40 mg/kg IV (if no liver disease)
- Lacosamide 200-400 mg IV (emerging evidence)
- General anesthesia with continuous EEG monitoring
- Midazolam 0.2 mg/kg bolus → infusion 0.1-0.4 mg/kg/h
- Propofol infusion (risk of propofol infusion syndrome with prolonged use)
- Thiopentone/Pentobarbital infusion (burst suppression on EEG is the target)
- Adams and Victor's Principles of Neurology, 12th Edition
Complications of Prolonged SE
- Neuronal injury (excitotoxicity via NMDA receptors)
- Cerebral edema and herniation
- Rhabdomyolysis, hyperthermia, aspiration, metabolic acidosis
- Hypoxia and cardiovascular collapse
11. SPECIAL SITUATIONS
Febrile Seizures
- Simple: Generalized, <15 min, single in 24h - benign; no long-term AED needed
- Complex: Focal, >15 min, multiple in 24h - risk factor for MTLE
- Management: Antipyretics, rectal diazepam for prolonged seizures
- Risk of subsequent epilepsy: simple febrile seizures ~2%; complex febrile seizures ~10-15%
First Seizure
- One unprovoked seizure: investigate (MRI, EEG, bloods)
- Treat if: abnormal EEG, structural lesion on MRI, Todd's palsy, or patient's preference/occupation (e.g., driver)
- Recurrence risk: ~40% within 2 years untreated; risk doubles if EEG or MRI is abnormal
Epilepsy in Women
- Catamenial epilepsy: seizures cluster around menstruation (progesterone drop, relative estrogen excess)
- Contraception: enzyme-inducing AEDs (CBZ, PHT, PB) reduce OCP efficacy - use higher-dose OCP or non-hormonal methods
- Pregnancy:
- Valproate is CONTRAINDICATED (neural tube defects, cognitive impairment in offspring)
- Folate 5 mg/day pre-conception and in first trimester for all women on AEDs
- Lamotrigine and Levetiracetam are safest options
- Neonatal vitamin K (AED-induced P450 induction → vitamin K deficiency in neonate)
Driving
- Patients must be seizure-free for a legally mandated period before driving (typically 6-12 months, varies by country). They must notify the licensing authority.
12. SURGICAL TREATMENT OF EPILEPSY
- Two appropriate AEDs at adequate doses have failed (drug-resistant epilepsy)
- Identifiable structural epileptogenic zone (e.g., hippocampal sclerosis, cortical dysplasia)
- Resection would not cause unacceptable neurological deficits
- Anterior temporal lobectomy: Best for MTLE - 60-70% seizure freedom
- Lesionectomy: For focal cortical dysplasia, cavernoma, low-grade tumor
- Corpus callosotomy: For atonic/drop attacks in Lennox-Gastaut (palliative)
- Hemispherectomy: For Rasmussen encephalitis / large hemispheric lesions
- Vagus nerve stimulation (VNS): Implanted device, reduces seizure frequency 50% in ~50%
- Responsive neurostimulation (RNS): Detects and aborts seizure activity
- Deep brain stimulation (DBS): Anterior thalamic nucleus stimulation
13. EXAM MUST-KNOWS (Quick Revision)
| High-Yield Point | Answer |
|---|---|
| Drug of choice for absence seizures | Ethosuximide (or Valproate if GTC co-exists) |
| Drug to AVOID in JME | Carbamazepine (worsens myoclonus) |
| Most teratogenic AED | Valproate (neural tube defects, neurodevelopmental effects) |
| Anticonvulsant in hypertensive pregnancy (eclampsia) | Magnesium sulfate |
| First-line for status epilepticus | Lorazepam IV |
| Status epilepticus definition (operational) | Seizure >5 minutes |
| Phenytoin - route restriction | IV in normal saline ONLY; not in dextrose (precipitates) |
| EEG in absence epilepsy | 3 Hz generalized spike-and-wave |
| EEG in infantile spasms (West syndrome) | Hypsarrhythmia |
| Most common focal epilepsy in adults | Mesial temporal lobe epilepsy with hippocampal sclerosis |
| Todd's paralysis | Transient focal weakness post-seizure - localizes onset zone |
| Prolactin after GTC | Elevated (useful in distinguishing from PNES) |
| Vigabatrin's unique adverse effect | Irreversible bilateral visual field loss |
| Safest AED in pregnancy | Lamotrigine or Levetiracetam |
| Febrile seizures require long-term AED? | NO (simple febrile seizures are benign) |
| Phenytoin at toxic levels: signs | Nystagmus → ataxia → altered consciousness (concentration-dependent) |
14. SUMMARY FRAMEWORK (Quick Mental Map)
SEIZURE
├── Provoked → Treat the cause, not epilepsy
└── Unprovoked (≥2, or 1 with high risk)
    └── EPILEPSY
        ├── Focal onset
        │   ├── Aware (no impairment)
        │   └── Impaired awareness
        │       └── ± Secondary generalization
        ├── Generalized onset
        │   ├── Motor: Tonic-clonic, Tonic, Clonic, Myoclonic, Atonic, Spasms
        │   └── Non-motor: Absence (typical/atypical)
        └── Unknown onset