
Difference between MCHC NCNC Dimorphic anemia slide
Reading File
Now let me search the medical library for content on these three types of anemia peripheral smears.
Finding Sources
Finding Sources
Searching the Web
MCHC NCNC dimorphic anemia peripheral blood smear differences morphology
Finding Sources
Finding Sources
Reading Web Page
https://pressbooks.openeducationalberta.ca/mlsci/chapter/abn…
Now let me read the key textbook sections for detailed content and look for smear images.
Reading File
Reading File
Finding Sources
Excellent - I have rich textbook content and image URLs. Let me now fetch the key smear images to display them.
Loading Image
Loading Image
Finding Sources
Now let me get the dimorphic smear image (Fig 31.13) from the textbook:
Reading File
Found the dimorphic smear image. Let me fetch it:
Loading Image
I now have all three textbook images and comprehensive content. Here is the full comparison:
Peripheral Blood Smear: MCHC vs NCNC vs Dimorphic Anemia
1. Normochromic Normocytic (NCNC) Anemia
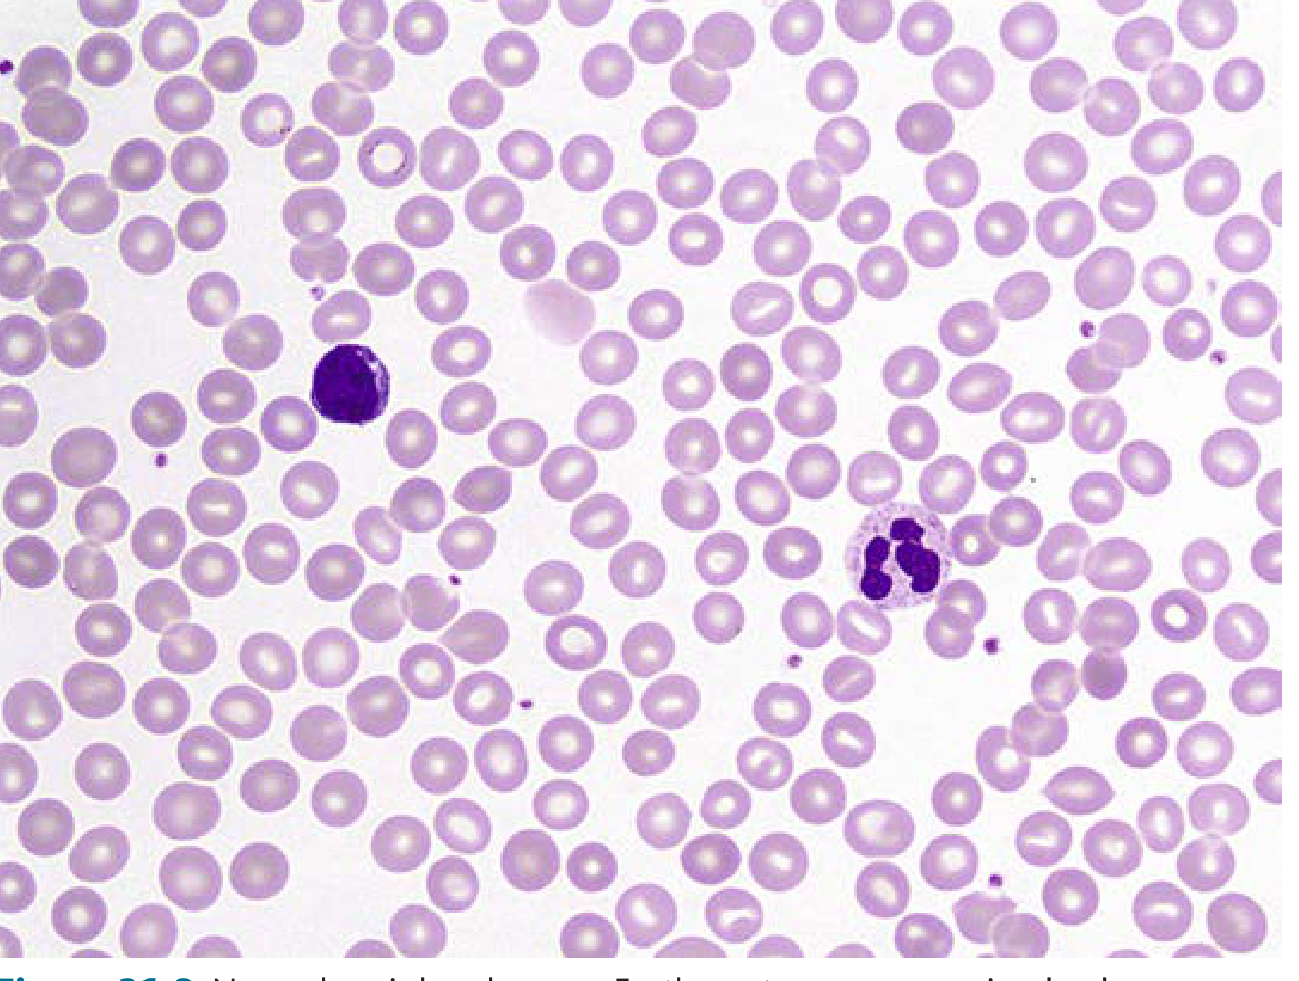
Figure: Normal peripheral smear showing the NCNC pattern - uniform RBCs, 6-8 µm diameter, central pallor ≤ 1/3 of cell diameter (Henry's Clinical Diagnosis, Fig. 31.9)
| Feature | Finding |
|---|---|
| RBC size | Normal (6-8 µm), matches nucleus of small lymphocyte |
| RBC color | Normal pink staining - central pallor present but ≤ 1/3 of cell |
| Uniformity | Uniform in size and shape - minimal anisocytosis or poikilocytosis |
| MCV | Normal (80-100 fL) |
| MCH | Normal |
| MCHC | Normal (32-36 g/dL) |
| RDW | Normal (11-14%) |
| RBC histogram | Normal bell-shaped curve |
Causes: Aplastic anemia, acute blood loss (early), hemolytic anemia (most), anemia of chronic disease (early/mild), renal failure (EPO deficiency), hypothyroidism (mild)
2. Microcytic Hypochromic (MCHC decreased) Anemia
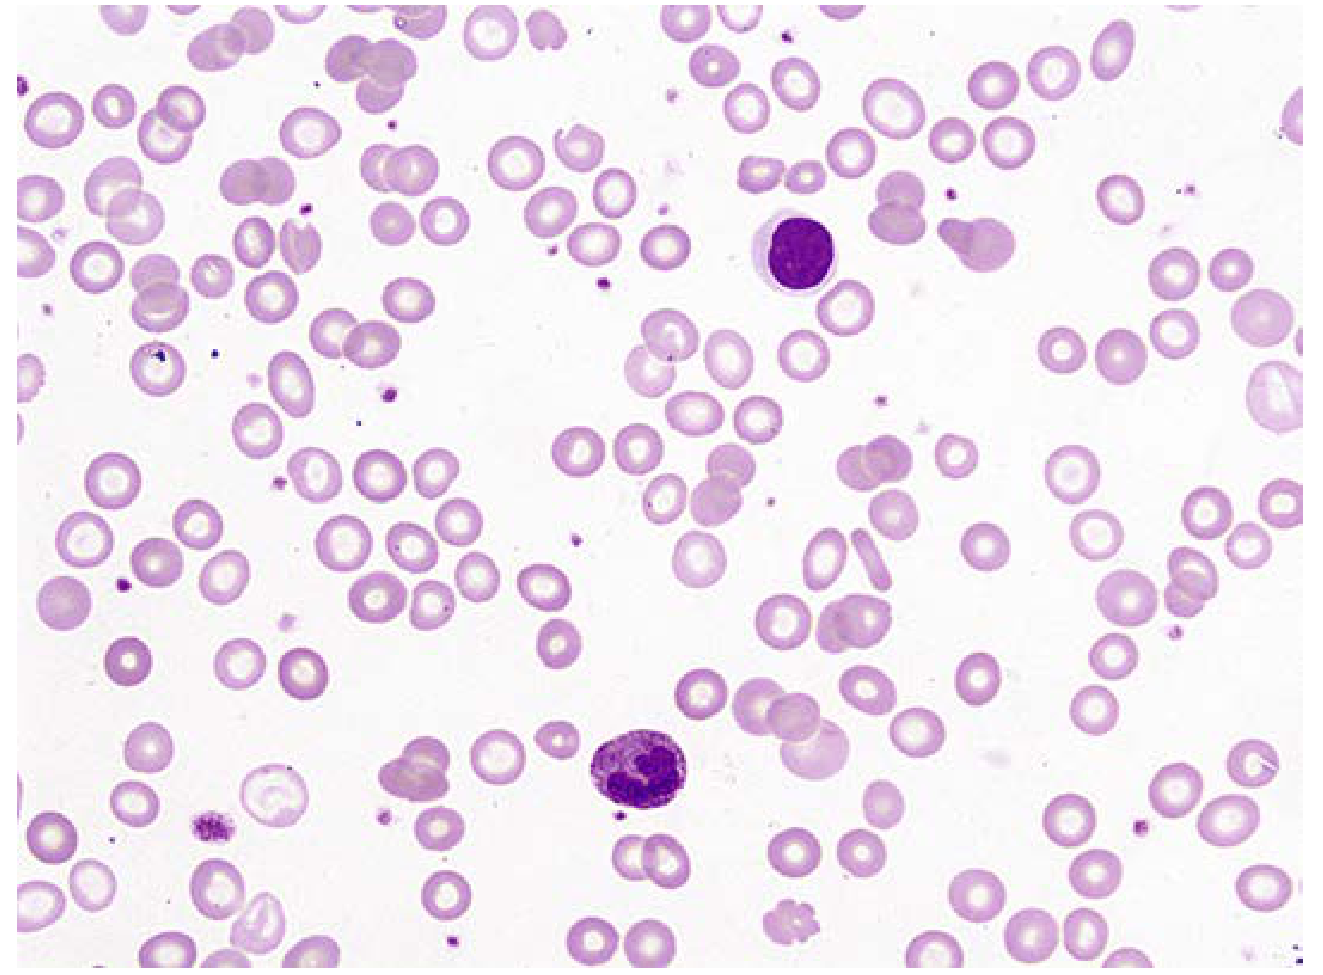
Figure: Microcytic hypochromic RBCs in iron deficiency anemia - central pale area exceeds 1/3 of the cell (Henry's Clinical Diagnosis, Fig. 31.10)
| Feature | Finding |
|---|---|
| RBC size | Small (< 6 µm) - microcytes |
| RBC color | Pale/washed out - central pallor > 1/3 (hypochromia) |
| Uniformity | Anisocytosis and poikilocytosis often present; pencil cells, target cells in thalassemia |
| MCV | Low (< 80 fL) |
| MCH | Low (< 27 pg) |
| MCHC | Low (< 32 g/dL) - this is the hallmark |
| RDW | Elevated in iron deficiency; normal/near-normal in thalassemia trait |
| RBC histogram | Left-shifted (narrow peak shifted leftward) |
Causes: Iron deficiency anemia (most common), thalassemia, anemia of chronic disease (severe/longstanding), lead poisoning, congenital sideroblastic anemia (the hypochromic population)
Key point on MCHC: MCHC is the ratio of hemoglobin to cell volume. When hemoglobin synthesis is impaired (iron deficiency, thalassemia), cells are small AND pale - both MCV and MCHC drop. Thalassemia trait has a low MCV but relatively preserved MCHC compared to iron deficiency, along with a normal RDW.
3. Dimorphic Anemia
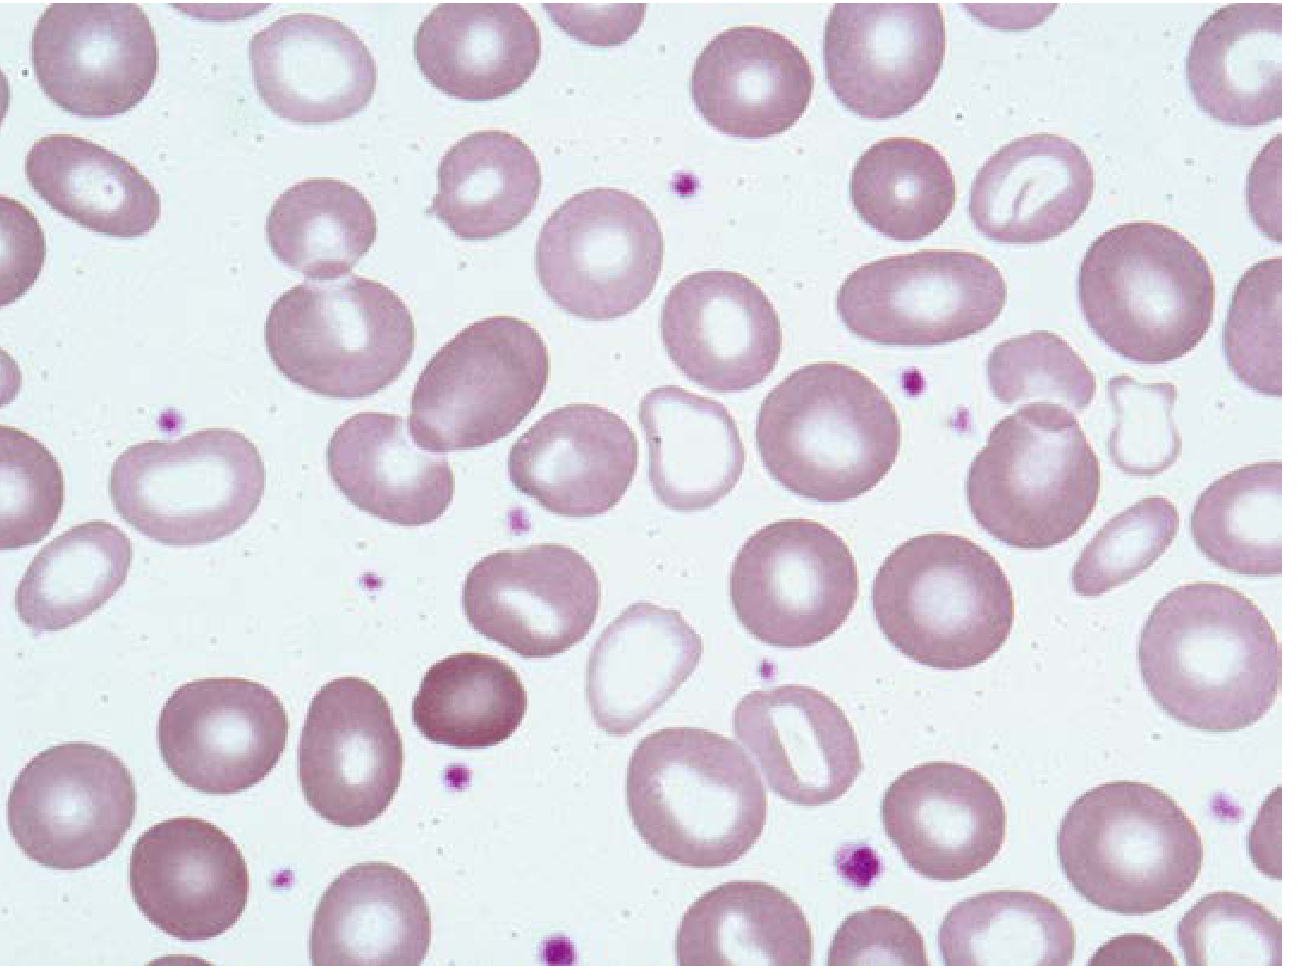
Figure: Dimorphic anemia - two distinct RBC populations: microcytic hypochromic cells alongside normocytic (and even macrocytic) cells, with marked anisocytosis and anisochromia (Henry's Clinical Diagnosis, Fig. 31.13)
| Feature | Finding |
|---|---|
| RBC size | TWO populations - small microcytes AND normal/large cells coexist |
| RBC color | TWO populations - hypochromic cells AND normochromic cells coexist (anisochromia) |
| Uniformity | Marked anisocytosis and anisochromia - this is the defining feature |
| MCV | Can be normal (the two populations "cancel out") or elevated |
| MCH | Variable |
| MCHC | Variable - may appear normal due to mixed populations |
| RDW | Markedly elevated (> 14.5%) - reflects the wide variation in cell size |
| RBC histogram | Bimodal curve (two peaks) - pathognomonic |
Causes:
- Sideroblastic anemia (classic cause) - hypochromic microcytes from defective heme synthesis + normochromic/macrocytic cells; ringed sideroblasts on bone marrow
- Iron deficiency + B12/folate deficiency combined - microcytic hypochromic + macrocytes
- Iron deficiency responding to treatment - new normochromic cells appear alongside old hypochromic cells
- Post-transfusion in hypochromic anemia - transfused normochromic cells + patient's hypochromic cells
- Myelodysplastic syndrome (MDS)
- Erythropoietin therapy in chronic renal failure
Side-by-Side Comparison Table
| Parameter | NCNC | Microcytic Hypochromic (low MCHC) | Dimorphic |
|---|---|---|---|
| RBC populations | One uniform | One - all small/pale | Two distinct populations |
| Cell size | Normal | Small (microcytic) | Mixed: small + normal/large |
| Central pallor | ≤ 1/3 | > 1/3 (hypochromic) | Mixed: pale + normal |
| MCV | Normal | Low | Normal or high |
| MCHC | Normal | Low | Variable/normal |
| RDW | Normal | High (IDA) / Normal (thal) | Markedly high |
| RBC histogram | Bell-shaped | Left-shifted | Bimodal |
| Anisocytosis | Absent/mild | Moderate | Marked |
| Anisochromia | Absent | Absent | Present (defining feature) |
| Key clue on smear | Uniform, normal cells | All cells pale & small | Two "flavors" of RBC visible |
Key Distinguishing Points at a Glance
- NCNC: Every cell looks the same - normal size, normal color. Think hemolysis, renal failure, aplastic anemia early phase.
- Low MCHC (microcytic hypochromic): Every cell looks the same but wrong - all small and pale. Think iron deficiency (RDW elevated) or thalassemia (RDW normal, basophilic stippling, target cells).
- Dimorphic: The smear has two clearly different RBC populations visible simultaneously. Think sideroblastic anemia (classic), or iron deficiency mid-treatment, or combined nutritional deficiency. The RDW is strikingly elevated and the automated histogram shows a bimodal pattern.
Sources: Henry's Clinical Diagnosis and Management by Laboratory Methods (Figs. 31.9, 31.10, 31.13); Goldman-Cecil Medicine (Microcytic Anemias); Harrison's Principles of Internal Medicine 22E (Ch. 65 - Interpreting Peripheral Blood Smears); Rosen's Emergency Medicine
This is a shared conversation. Sign in to Orris to start your own chat.