
Give me cycle for hmp shunt
HMP shunt hexose monophosphate pentose phosphate pathway cycle diagram
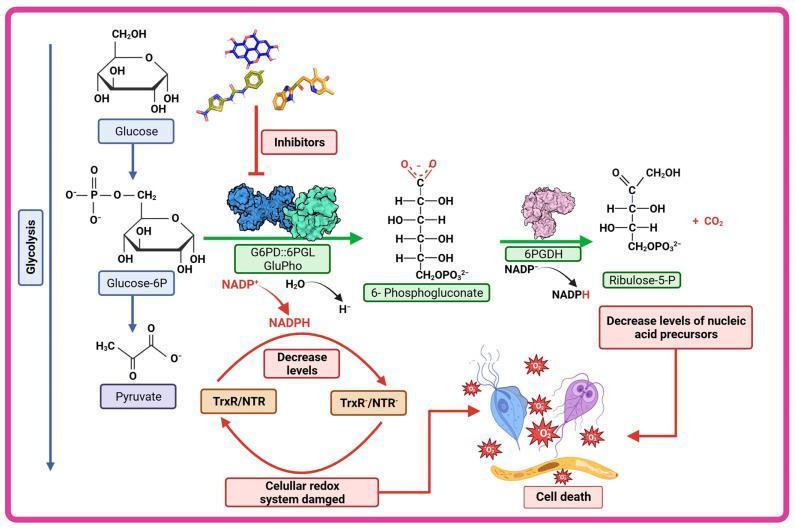
A pathophysiology diagram illustrating the therapeutic strategy of targeting the Pentose Phosphate Pathway (PPP) in parasites such as Giardia lamblia, Trichomonas vaginalis, and Plasmodium falciparum. The pathway begins with Glucose being converted to Glucose-6P. In a normal state, Glucose-6P is processed by the bifunctional enzyme G6PD::6PGL (or GluPho in Plasmodium), leading to the production of NADPH and 6-Phosphogluconate. The 6-Phosphogluconate is then acted upon by 6PGDH to form Ribulose-5-P and more NADPH. Visually, the diagram highlights a therapeutic intervention where small-molecule inhibitors block the G6PD::6PGL complex (indicated by a red inhibition bar). This inhibition results in two critical downstream effects: a decrease in Ribulose-5-P levels, leading to 'Decreased levels of nucleic acid precursors,' and a reduction in NADPH, which impairs the 'TrxR/NTR' redox cycle. The final consequence depicted is a 'Damaged cellular redox system,' characterized by increased reactive oxygen species (ROS) and metabolic deficiency, ultimately culminating in parasite cell death. The diagram integrates chemical structures, protein surface models, and parasitic morphology to demonstrate pharmacological mechanisms.
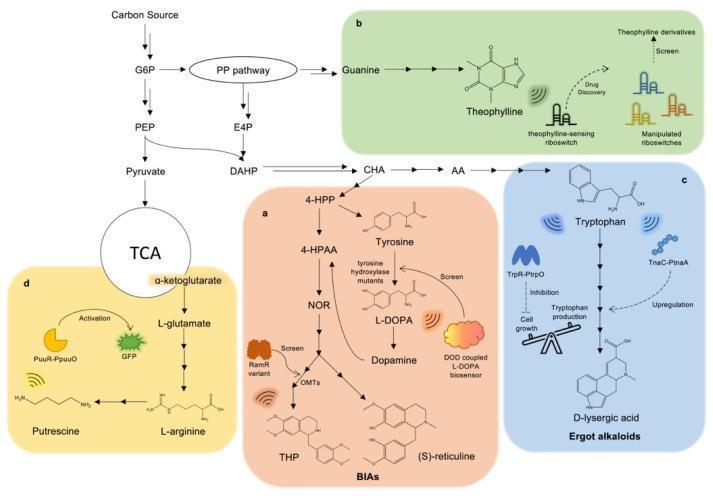
A multi-panel metabolic flowchart illustrating biosynthetic pathways for various alkaloids and their regulation via metabolite-responsive biosensors. The central pathway shows carbon flux from a source through Glucose-6-Phosphate (G6P) into the Pentose Phosphate (PP) pathway and glycolysis (PEP, Pyruvate), feeding into the TCA cycle and shikimate pathway. Section (a) details Benzylisoquinoline Alkaloid (BIA) biosynthesis from Tyrosine, including L-DOPA and Dopamine, highlighting the use of a DOD-coupled L-DOPA biosensor and RamR variants for screening THP and (S)-reticuline production. Section (b) shows Guanine-derived Theophylline biosynthesis and the application of sensing riboswitches for drug discovery. Section (c) depicts Tryptophan-derived Ergot alkaloids, specifically D-lysergic acid, regulated by TrpR (transcriptional repressor for cell growth balance) and TnaC (activator for upregulating synthases). Section (d) illustrates Putrescine synthesis from L-arginine, monitored by a PuuR-PpuuO biosensor with GFP readout. The diagram uses standard biochemical notation and color-coded regions to differentiate specific alkaloid classes (BIAs, Ergot alkaloids, polyamines) and their respective genetic control elements.
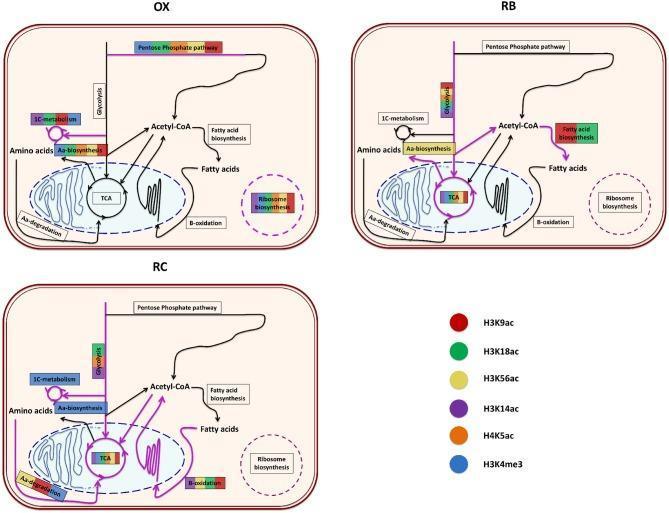
This medical pathophysiology diagram illustrates the functional enrichment of core metabolic pathways regulated by specific histone modifications across the three phases of the Yeast Metabolic Cycle (YMC): Oxidative (OX), Respiration Burst (RB), and Respiration Control (RC). Three cellular models depict pathways including the Pentose Phosphate Pathway, Glycolysis, 1C-metabolism, TCA cycle, Fatty acid biosynthesis, and Beta-oxidation, connecting the cytosol to the mitochondria and cell membrane. Color-coded horizontal bars overlying specific pathways indicate enrichment by specific epigenetic marks: H3K9ac (red), H3K18ac (green), H3K56ac (yellow), H3K14ac (purple), H4K5ac (orange), and H3K4me3 (blue). In the OX phase, enrichment is high in ribosome biosynthesis and the pentose phosphate pathway. The RB phase shows increased glycolysis and fatty acid biosynthesis regulation. The RC phase demonstrates a shift toward amino acid degradation and beta-oxidation. This visualization demonstrates how chromatin modifications coordinate gene expression to drive metabolic transitions during different cellular respiratory states.
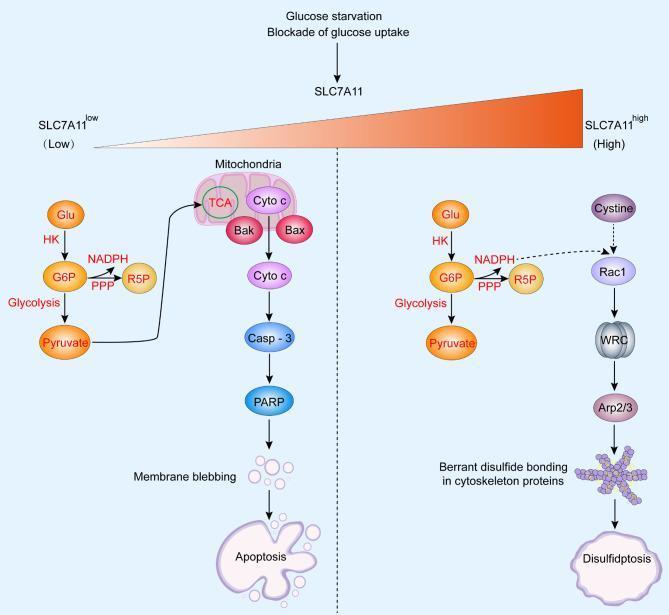
A pathophysiology diagram illustrating the metabolic pathways leading to cell death in response to glucose starvation or blockade of glucose uptake, stratified by SLC7A11 expression levels. The schematic is divided into two vertical panels. The left panel shows SLC7A11-low cells, where reduced glycolysis and pentose phosphate pathway (PPP) activity lead to mitochondrial dysfunction (TCA cycle inhibition, Bak/Bax activation, and cytochrome c release), resulting in Caspase-3 activation, PARP cleavage, membrane blebbing, and classical apoptosis. The right panel shows SLC7A11-high cells, characterized by high cystine uptake. In the absence of glucose-derived NADPH, cystine reduction causes disulfide stress, which triggers the Rac-WRC-Arp2/3 signaling pathway. This leads to aberrant disulfide bonding in cytoskeleton proteins and a distinct form of regulated cell death known as disulfidptosis, depicted by cell shrinkage. Key molecules identified include hexokinase (HK), G6P, pyruvate, NADPH, and Cyto c. The diagram uses color-coded circles and flow arrows to differentiate metabolic intermediates from regulatory signaling complexes and final cellular outcomes.
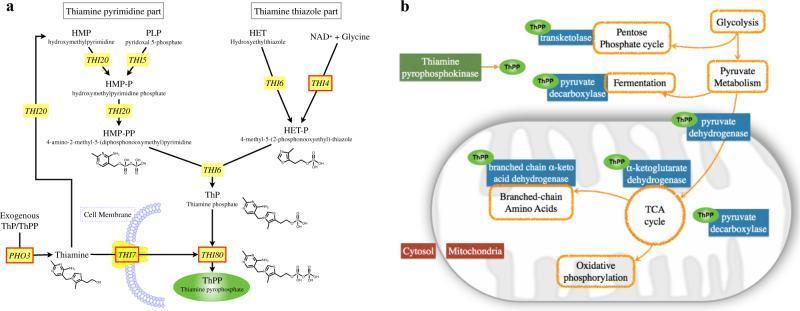
This medical illustration comprises two panels detailing thiamine (Vitamin B1) metabolism. Panel A depicts the de novo thiamine biosynthesis pathway and transport mechanism. It shows the convergence of the thiamine pyrimidine part (from HMP and PLP via THI20 and THI5) and the thiamine thiazole part (from HET and NAD+ via THI6 and THI4). Intermediates include HMP-PP and HET-P, which fuse via THI6 to form thiamine phosphate (ThP). Extracellular thiamine uptake involves PHO3 and the THI7 transporter, culminating in the synthesis of the active cofactor, thiamine pyrophosphate (ThPP), by THI80. Panel B is a metabolic map showing the subcellular localization of ThPP-dependent reactions in the cytosol and mitochondria. Key essential enzymes requiring ThPP as a cofactor are highlighted in blue, including transketolase (Pentose Phosphate pathway), pyruvate decarboxylase (fermentation), and mitochondrial complexes: pyruvate dehydrogenase, alpha-ketoglutarate dehydrogenase (TCA cycle), and branched-chain alpha-keto acid dehydrogenase. The diagram illustrates how thiamine deficiency would disrupt central energy metabolism and carbohydrate processing.
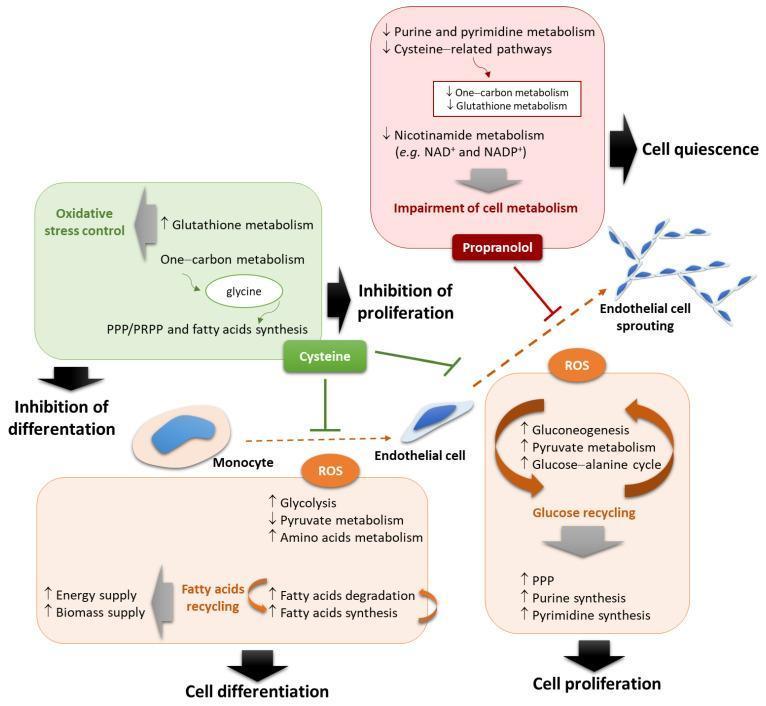
This pathophysiology diagram illustrates the metabolic signaling pathways regulating monocyte-to-endothelial cell differentiation and endothelial cell sprouting (angiogenesis). The visual is divided into three key regulatory branches. 1) ROS-Induced Differentiation: Reactive oxygen species (ROS) promote the differentiation of monocytes into endothelial cells by upregulating glycolysis, amino acid metabolism, and fatty acid recycling (degradation and synthesis) for energy and biomass supply. 2) ROS-Induced Proliferation: In mature endothelial cells, ROS stimulate sprouting and proliferation through glucose recycling (gluconeogenesis, pyruvate metabolism, and the glucose-alanine cycle), which feeds the pentose phosphate pathway (PPP) and purine/pyrimidine synthesis. 3) Inhibition Pathways: Cysteine inhibits monocyte differentiation and endothelial proliferation by diverting glycine from one-carbon metabolism toward fatty acid synthesis and glutathione metabolism for oxidative stress control. Propranolol blocks endothelial sprouting and proliferation by inducing an impairment of cell metabolism (decreasing purine/pyrimidine, cysteine, one-carbon, glutathione, and nicotinamide metabolism), ultimately leading to cell quiescence. The diagram uses up/down arrows and colored flow blocks to highlight how metabolic rewiring determines vascular cell fate.
HMP Shunt (Hexose Monophosphate Shunt / Pentose Phosphate Pathway)
Overview Diagram (Harper's Biochemistry)
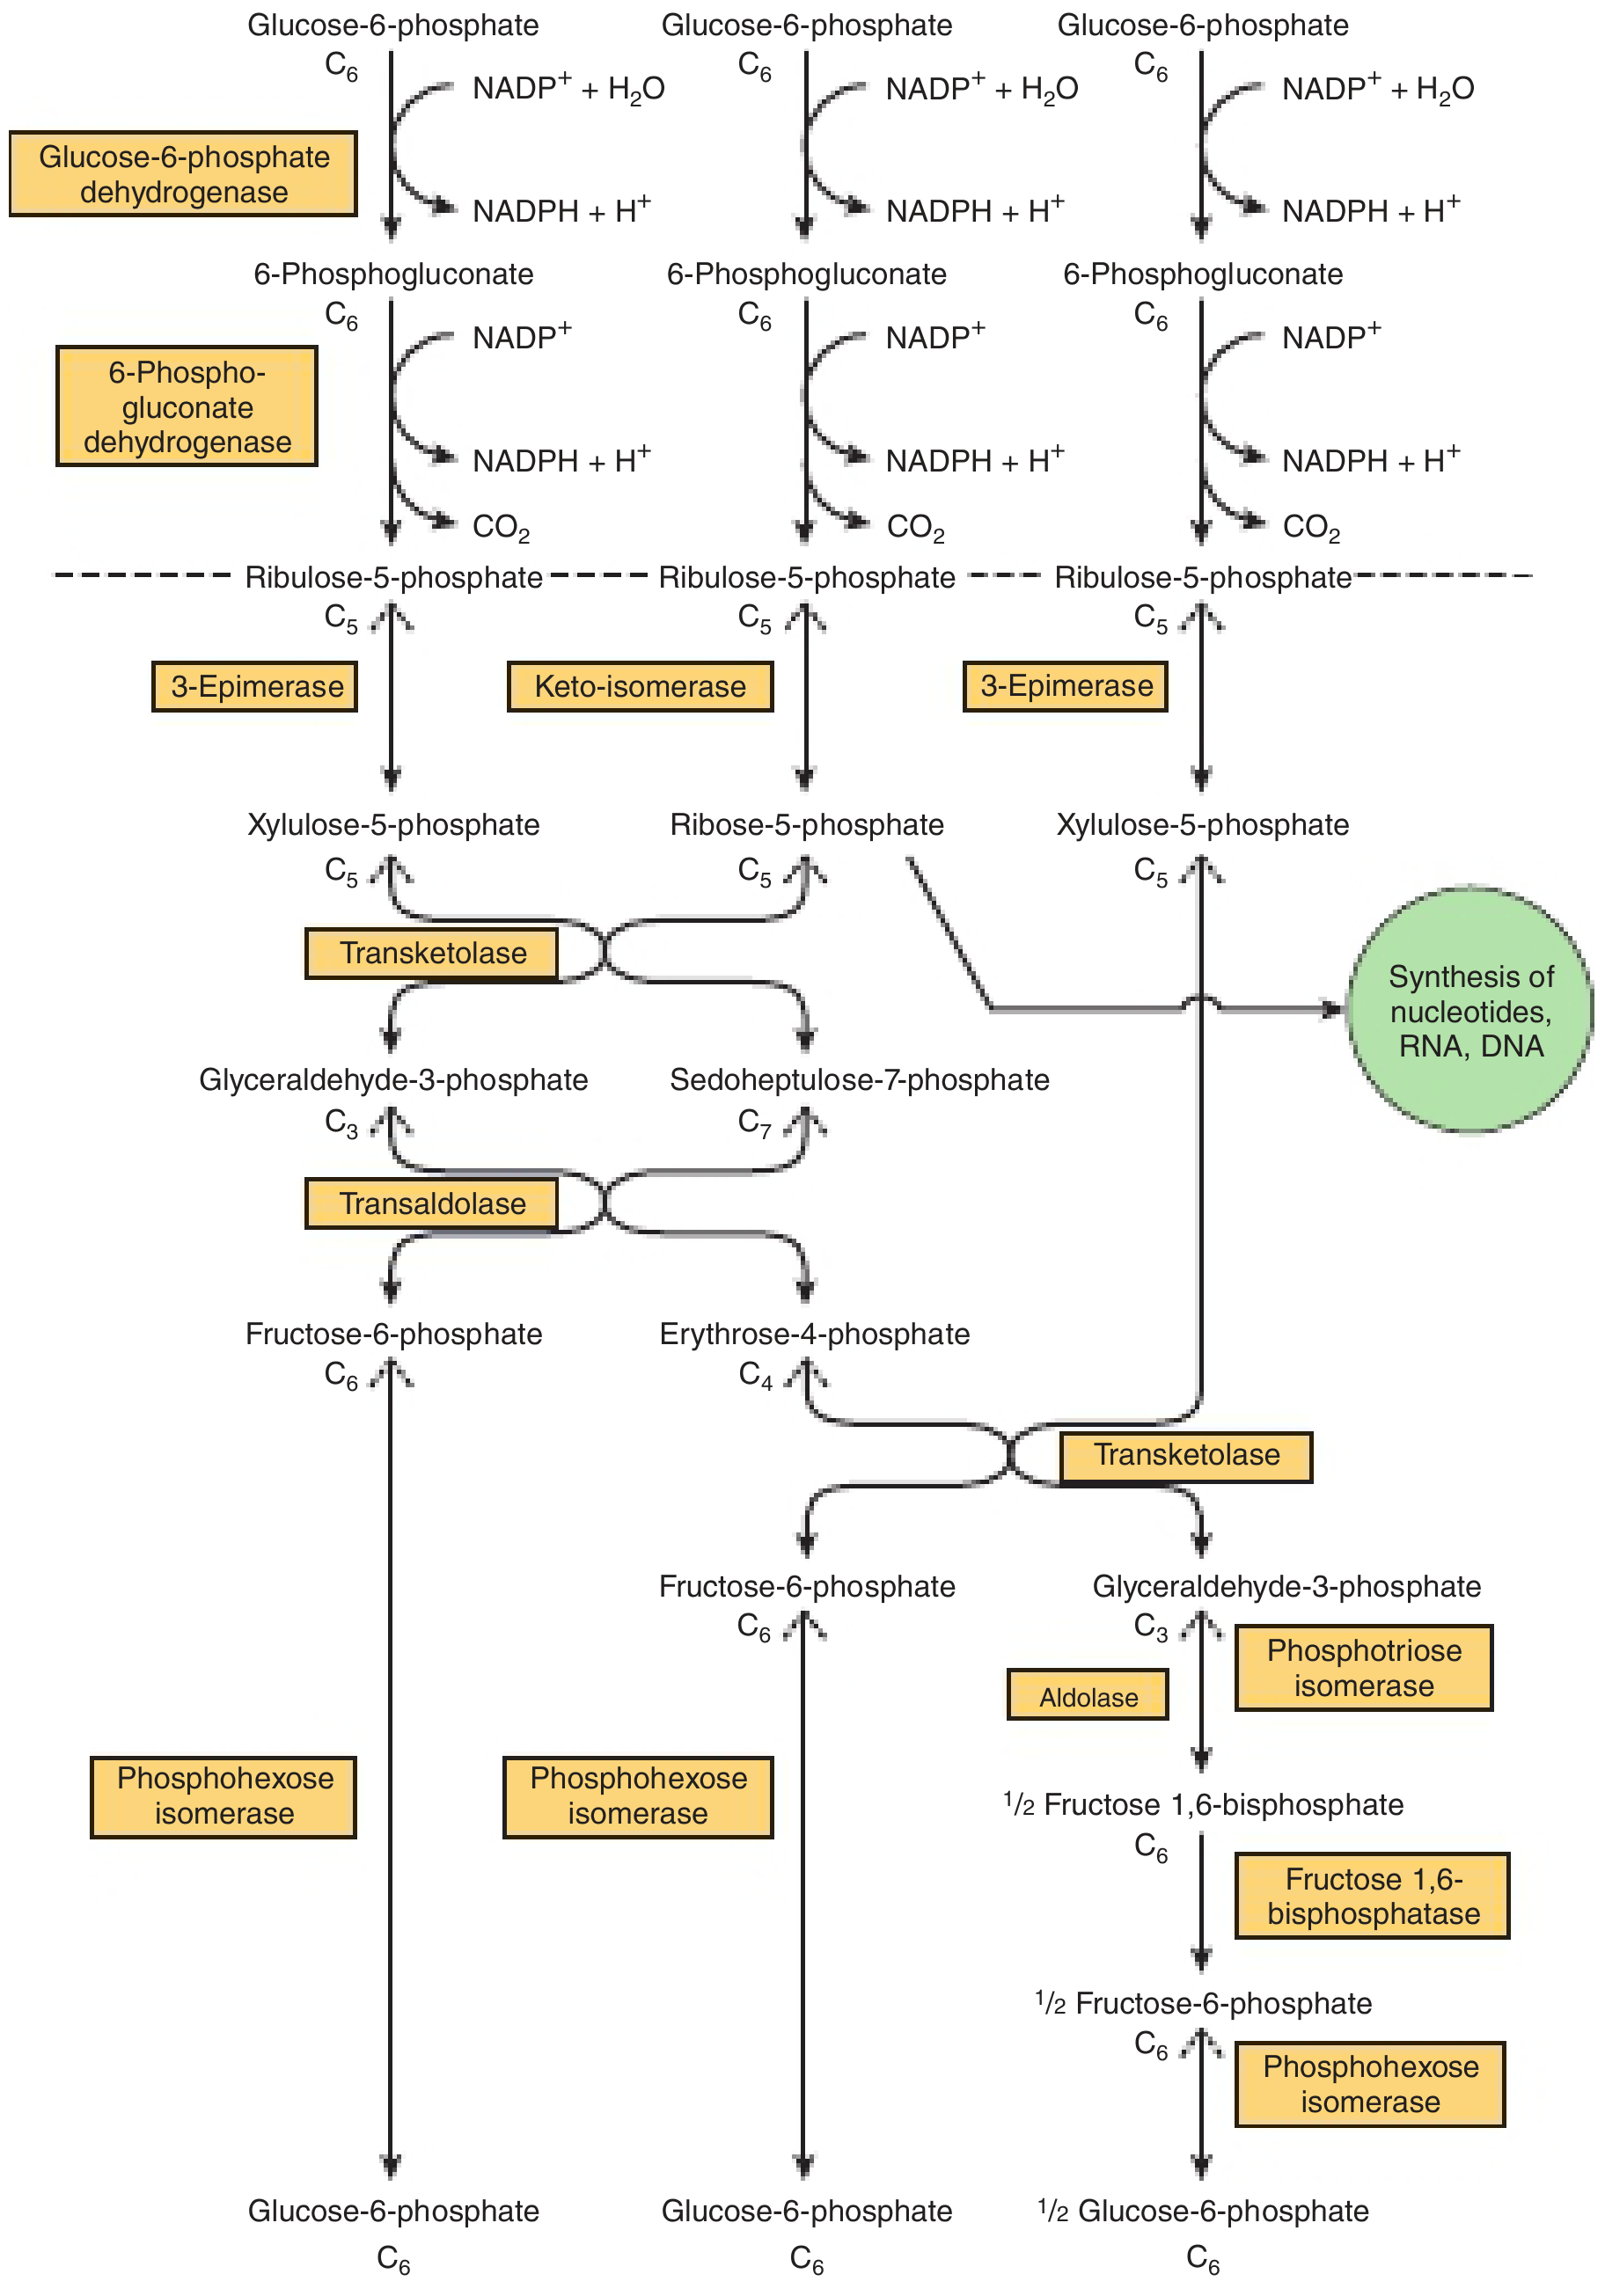
The Two Phases
Phase 1 - Irreversible Oxidative Phase
| Step | Substrate | Enzyme | Product | Cofactor |
|---|---|---|---|---|
| 1 | Glucose-6-phosphate | Glucose-6-phosphate dehydrogenase (G6PD) | 6-Phosphogluconolactone | NADP+ → NADPH |
| 2 | 6-Phosphogluconolactone | Gluconolactone hydrolase | 6-Phosphogluconate | - |
| 3 | 6-Phosphogluconate | 6-Phosphogluconate dehydrogenase | Ribulose-5-phosphate + CO2 | NADP+ → NADPH |
- Net: 1 Glucose-6-phosphate → 1 Ribulose-5-phosphate + 1 CO2 + 2 NADPH
- Step 1 (G6PD) is the rate-limiting, committed, regulated step
- G6PD is inhibited by NADPH (product inhibition) and induced by insulin
Phase 2 - Reversible Non-oxidative Phase
Route A - Cell needs ribose-5-phosphate (for nucleotide synthesis)
Ribulose-5-phosphate → Ribose-5-phosphate (via ribose-5-phosphate isomerase)
Route B - Cell needs more NADPH than ribose-5-phosphate (recycling back to glycolysis)
- Ribulose-5-P → Xylulose-5-P (by phosphopentose epimerase) x2
- Ribulose-5-P → Ribose-5-P (by ribose-5-P isomerase) x1
Xylulose-5-P (C5) + Ribose-5-P (C5) → Sedoheptulose-7-P (C7) + Glyceraldehyde-3-P (C3)
Sedoheptulose-7-P (C7) + Glyceraldehyde-3-P (C3) → Fructose-6-P (C6) + Erythrose-4-P (C4)
Xylulose-5-P (C5) + Erythrose-4-P (C4) → Fructose-6-P (C6) + Glyceraldehyde-3-P (C3)
The Complete Cycle Summary
3 Glucose-6-P + 6 NADP+ + 3 H2O → 3 CO2 + 6 NADPH + 2 Fructose-6-P + 1 Glyceraldehyde-3-P
C6H12O6 + 12 NADP+ + 6 H2O → 6 CO2 + 12 NADPH
Key Enzymes Summary
| Enzyme | Phase | Cofactor | Notes |
|---|---|---|---|
| G6PD | Oxidative | NADP+ | Rate-limiting; X-linked; inhibited by NADPH |
| Gluconolactone hydrolase | Oxidative | - | Spontaneous + enzymatic |
| 6-Phosphogluconate dehydrogenase | Oxidative | NADP+ | Oxidative decarboxylation |
| Ribose-5-P isomerase | Non-oxidative | - | Makes ribose-5-P |
| Phosphopentose epimerase | Non-oxidative | - | Makes xylulose-5-P |
| Transketolase | Non-oxidative | TPP (thiamine) | Transfers 2C units; used to assess thiamine status |
| Transaldolase | Non-oxidative | - | Transfers 3C units |
Functions and Clinical Relevance
| Function | Details |
|---|---|
| NADPH generation | Fatty acid synthesis (liver, adipose, mammary gland), steroid synthesis (adrenal cortex, gonads), glutathione reduction in RBCs |
| Ribose-5-phosphate | Nucleotide and nucleic acid synthesis (all dividing cells) |
| Antioxidant defense | NADPH keeps glutathione reduced; protects RBCs from oxidative hemolysis |
G6PD Deficiency
- X-linked recessive
- RBCs cannot make enough NADPH → glutathione cannot be regenerated → oxidative stress → hemolytic anemia
- Triggered by: primaquine, dapsone, fava beans, infections
- Common in malaria-endemic regions (provides some protection against Plasmodium)
Transketolase as a Thiamine Marker
- Transketolase requires thiamine pyrophosphate (TPP)
- Low transketolase activity stimulated by added TPP = thiamine (B1) deficiency (beriberi, Wernicke's)