
Murmurs according to heart conditions and why
heart murmur cardiac auscultation diagram
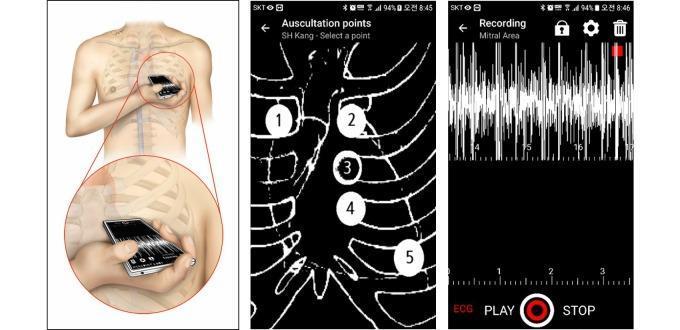
This composite educational graphic illustrates a digital health methodology for heart sound recording using a dedicated smartphone application (CPstethoscope). The image is divided into three sections: Left: An anatomical illustration shows a user positioning a smartphone directly against the chest wall at an intercostal space for auscultation without peripheral devices. Middle: A user interface (UI) screenshot displays the 'Auscultation points' selection screen, featuring a schematic of the rib cage and sternum with five numbered circles (1-5) indicating standard cardiac auscultation areas (aortic, pulmonic, Erb's point, tricuspid, and mitral). Right: A screenshot of the active recording interface shows a high-frequency phonocardiogram waveform in white against a dark background, a horizontal time scale (seconds), and a red recording indicator. Interactive controls include 'ECG', 'PLAY', and 'STOP' buttons. The diagram serves as a technical overview of smartphone-based cardiac monitoring and the graphical representation of clinical examination protocols for medical students and digital health researchers.
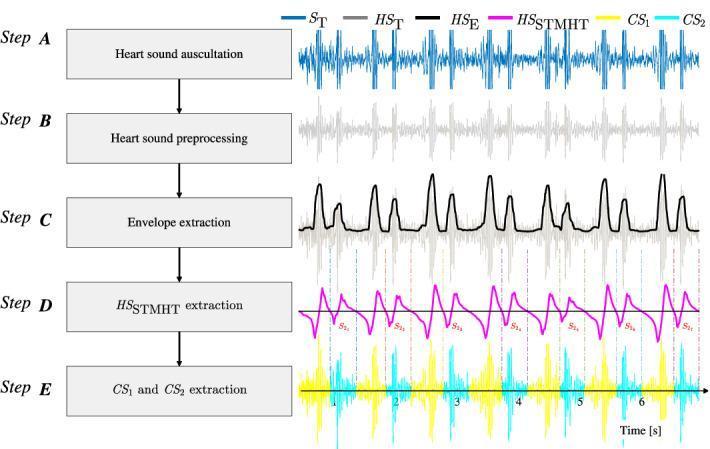
This flowchart illustrates the signal processing methodology for the automated segmentation and extraction of heart sound components, specifically the first (S1) and second (S2) heart sounds, denoted as CS1 and CS2. The process is divided into five sequential stages (Step A through Step E): 1. Step A (Heart Sound Auscultation): Shows the raw digital phonocardiogram signal (ST) as a blue oscillatory waveform. 2. Step B (Heart Sound Preprocessing): Displays a filtered and normalized version of the signal (HST) in gray, reducing noise and baseline drift. 3. Step C (Envelope Extraction): Features a black waveform representing the extracted Viola integral-based envelope (HSE) that traces the signal peaks. 4. Step D (HS STMHT Extraction): Shows a magenta waveform (HS_STMHT) using the Short-Time Modified Hilbert Transform, with marked negative-to-positive points used to identify S1 and S2 centroids. 5. Step E (CS1 and CS2 Extraction): Demonstrates the final segmented cardiac cycle components, with CS1 segments in yellow and CS2 segments in cyan, separated by vertical hashed lines. This educational diagram represents an advanced diagnostic algorithm for cardiovascular signal processing, aimed at enhancing automated cardiac auscultation.
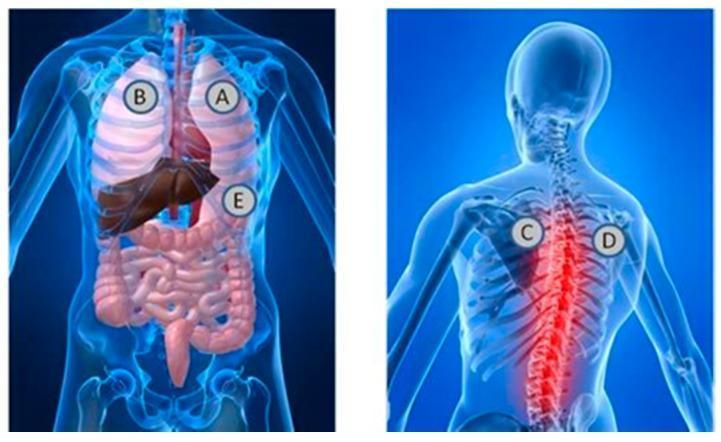
This medical anatomical diagram illustrates the standard stethoscope placement locations for auscultation of heart and lung sounds. The image consists of two panels: an anterior (front) view and a posterior (back) view of a semi-transparent human torso. In the anterior view, labels A and B are positioned over the apical regions of the right and left lungs, respectively, while label E is located at the lower left costal margin, corresponding to the cardiac apex and mitral valve area. Visible internal structures include the lungs, heart, liver, and intestinal tract. In the posterior view, labels C and D are placed in the interscapular region at the level of the upper thoracic spine, typically used for assessing posterior bronchial and vesicular breath sounds. This view highlights the vertebral column, ribs, and scapulae, with a red glow emphasizing the spinal region. This illustration serves as an educational guide for clinical physical examination techniques, demonstrating the relationship between surface landmarks and underlying thoracic and abdominal viscera.
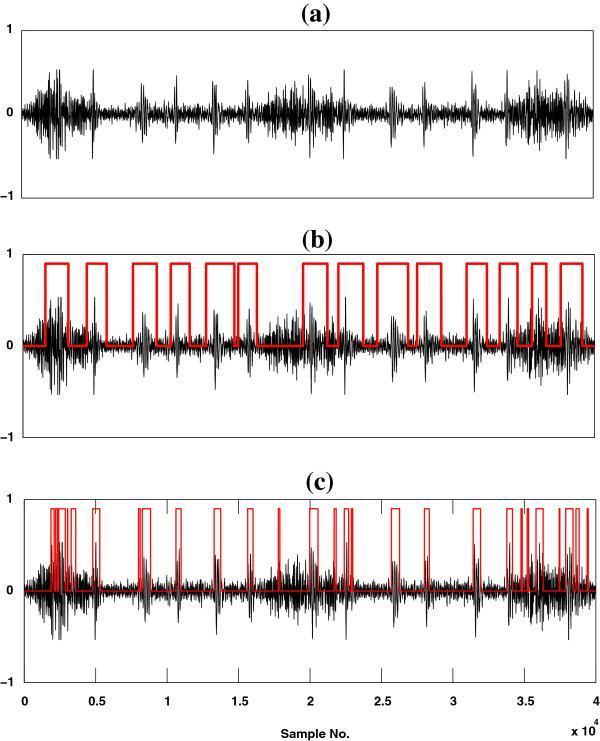
A comparison chart consisting of three time-domain waveforms (a, b, and c) illustrating heart sound (HS) localization within real recorded high-flow lung sound (LS) data. Subfigure (a) presents the raw acoustic signal, showing amplitude fluctuations with periodic bursts corresponding to mechanical cardiac events obscured by respiratory noise. Subfigures (b) and (c) demonstrate the performance of two different computational methods for identifying cardiac segments. The black waveforms represent the sound signal, while the overlaid red rectangular pulses indicate the identified temporal boundaries of heart sound components. Subfigure (b) shows the output of the HHA method, characterized by wider, continuous red blocks that capture the duration of heart sound complexes. Subfigure (c) displays the result of the SSA method, showing fragmented, narrower red pulses that often miss segments or produce discontinuous localization. This clinical signal processing diagram is used in cardiology and pulmonology research to evaluate algorithms for separating cardiac and respiratory sounds in auscultation data.
cardiac murmur timing systolic diastolic valve disease waveform phonocardiogram
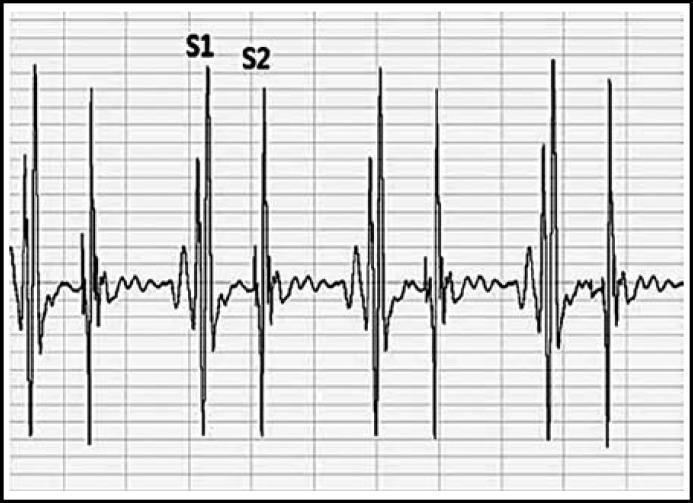
This diagnostic image displays a phonocardiogram tracing showing the amplitude waves of heart sounds recorded via an esophageal stethoscope. The waveform presents a rhythmic, repeating sequence of high-amplitude vertical spikes against a grid background. Key cardiac cycle components are labeled: 'S1' indicates the first heart sound (associated with mitral and tricuspid valve closure during ventricular systole) and 'S2' indicates the second heart sound (associated with aortic and pulmonic valve closure during ventricular diastole). Visually, S1 exhibits a slightly higher peak amplitude and sharper complex compared to S2. The interval between S1 and S2 represents the systolic phase, while the longer interval following S2 before the next S1 represents the diastolic phase. The baseline activity between these primary peaks is relatively stable with minimal noise, demonstrating the clinical utility of filtered esophageal recording for monitoring cardiac acoustic signals and assessing correlations between heart sound intensity and hemodynamic parameters like systolic blood pressure.
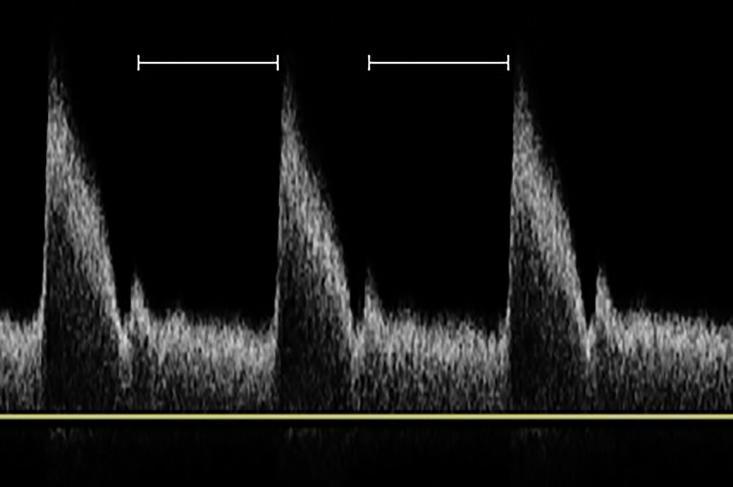
This diagnostic image displays a Doppler ultrasound spectral waveform of an arterial pulse wave, used in clinical imaging to assess hemodynamics. The waveform exhibits a characteristic triphasic or high-resistance pattern, featuring a rapid systolic upstroke (peak) followed by a sharp downstroke and a smaller secondary peak or dicrotic notch, which corresponds to the closure of the aortic valve and the onset of diastole. The base of the waveform shows low-level diastolic flow. White horizontal calipers are overlaid between the systolic peaks, specifically marking the duration of the ventricular diastole phase within the cardiac cycle. This timing is critical in shear wave elastography (SWE) for vascular assessment, as it represents the period when the arterial wall returns to its original morphology, providing a stable window (delta T) for measuring tissue stiffness and Young’s modulus in atherosclerotic plaques without the interference of the high-pressure systolic pulse.
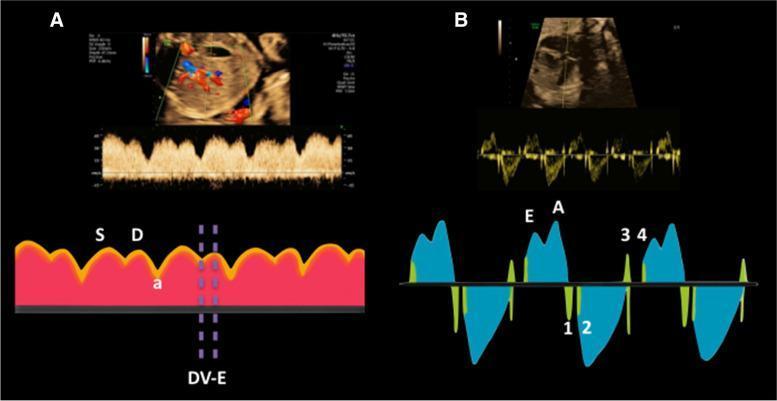
This composite educational graphic illustrates two methods for fetal cardiovascular assessment using spectral Doppler ultrasound. Panel A demonstrates Ductus Venosus (DV) Doppler waveforms. The pulsed-wave Doppler trace and accompanying schematic identify key components: the systolic wave (S), diastolic wave (D), and atrial contraction wave (a). A vertical dashed marker indicates the measurement of the early diastolic filling time (DV-E), representing the interval between ventricular end-systole and the peak of the D-wave. Panel B depicts the Left Myocardial Performance Index (LV-MPI) obtained from a fetal heart. The waveform shows characteristic valve clicks used for timing intervals: mitral valve closure (1), aortic valve opening (2), aortic valve closure (3), and mitral valve opening (4). The schematic also highlights the early (E) and late/atrial (A) diastolic inflow peaks. These markers allow for the calculation of isovolumetric contraction time (ICT), isovolumetric relaxation time (IRT), and ejection time (ET), providing a global assessment of fetal cardiac function. The image serves as a reference for standardized fetal Doppler measurement techniques.
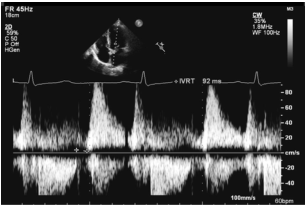
Summary : This figure shows a Doppler echocardiography waveform, specifically a continuous wave (CW) Doppler tracing of blood flow velocities across a cardiac valve, with an inset showing the echocardiographic imaging plane. The image includes measurements of isovolumic relaxation time (IVRT) and displays velocity data over time. echocardiography waveform: Title & Axes : • No explicit title, but the context is a CW Doppler echocardiogram. • X-axis: Time, with scale bar labeled “100 mm/s” and heart rate “60 bpm”. • Y-axis: Velocity (cm/s), ranging from -80 to +80 cm/s. • IVRT (isovolumic relaxation time) is annotated as “92 ms”. Technical Details : • Top left: Imaging parameters (FR 45Hz, 18cm, 2D, 59%, C 50, P Off, HGen). • Top right: Doppler settings (CW, 3.5%, 1.8 MHz, WF 100 Hz). • Inset: Apical four-chamber echocardiographic view with Doppler cursor placement. • Grayscale Doppler spectral display with positive and negative velocities. Waveform Features : • Multiple cardiac cycles are shown, each with characteristic E and A waves (diastolic filling patterns). • Baseline at 0 cm/s, with velocities above and below. • IVRT interval marked between the end of systolic flow and onset of early diastolic filling. Design Encodings : • White spectral Doppler tracing on black background. • Horizontal and vertical grid lines for measurement. • Annotation arrow and text for IVRT. Analysis : • The figure demonstrates typical Doppler velocity patterns across a cardiac valve, with clear E and A waves and a measured IVRT of 92 ms. • The spectral display allows assessment of diastolic function and timing intervals. • No obvious arrhythmias or abnormal flow patterns are visible in the waveform.
Heart Murmurs by Condition
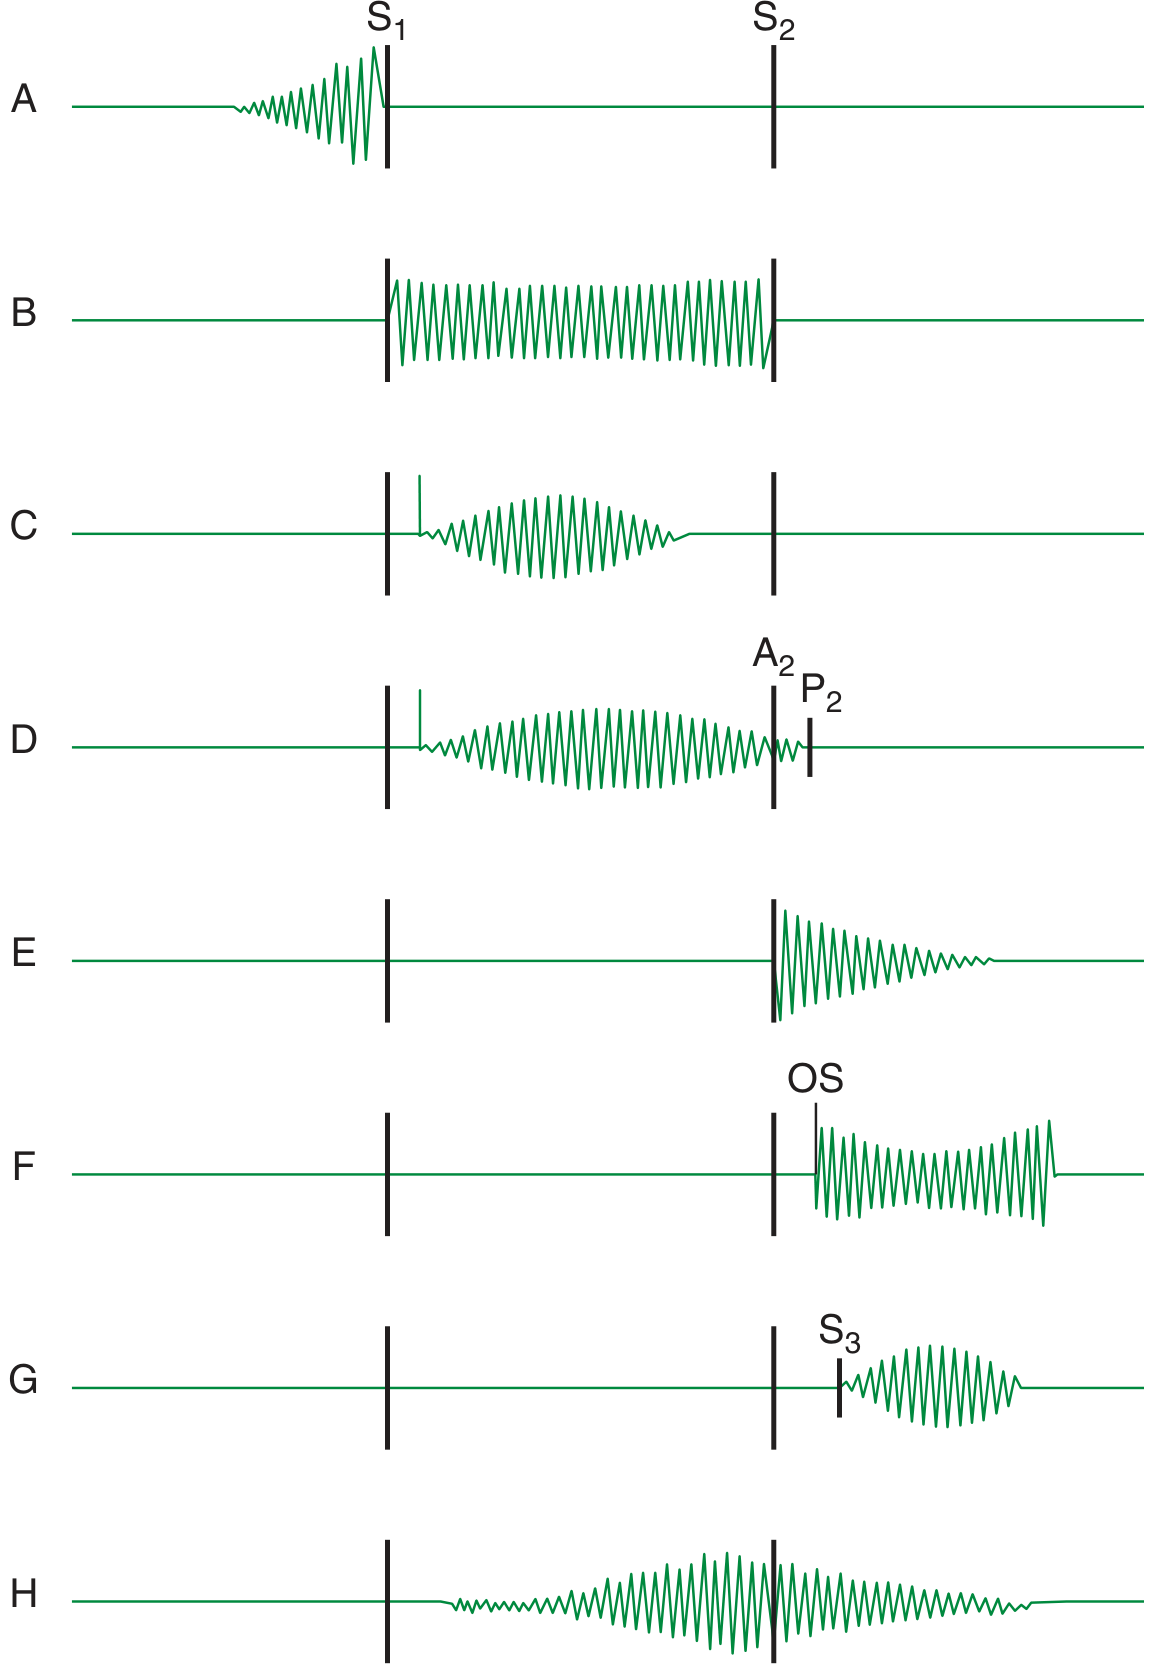
Murmur Grading (Levine Scale)
| Grade | Description |
|---|---|
| 1 | Faint; not heard in all positions |
| 2 | Quiet, but immediately audible on placement |
| 3 | Moderately loud |
| 4 | Loud |
| 5 | Heard with stethoscope partly off chest |
| 6 | Heard with stethoscope entirely off chest |
1. Systolic Murmurs
Holosystolic (Pansystolic) Murmurs
Mitral Regurgitation (MR)
- Murmur: High-pitched, blowing, holosystolic murmur at the apex, radiating to the axilla or left scapula
- Chronic MR: The murmur begins with S1 and persists through and may obscure S2
- Acute MR (e.g. papillary muscle rupture post-MI): Harsh apical systolic murmur that may end before S2 because the acute rise in left atrial pressure equalizes LV-LA pressure early
- Why: The mitral valve fails to coapt properly during systole. Blood flows backwards from the high-pressure LV into the low-pressure LA throughout the entire systolic period, creating sustained turbulence. The regurgitant jet against the LA wall generates the characteristic high-frequency sound
- Associated findings: Soft or absent S1 (poor leaflet closure), S3 gallop (increased LV filling), displaced apical impulse
Tricuspid Regurgitation (TR)
- Murmur: Holosystolic at the lower left sternal border (LLSB); increases with inspiration (Carvallo's sign - increased venous return to the right heart augments the murmur)
- Why: Similar mechanism to MR but in the right heart - the RV ejects blood back into the RA. The Carvallo's sign is pathognomonic because inspiration increases right-sided filling and therefore more blood regurgitates
- Associated: Prominent CV waves in the JVP, pulsatile hepatomegaly
Ventricular Septal Defect (VSD)
- Murmur: Harsh holosystolic murmur, left sternal border, grade 4-5/6, with a palpable thrill
- Why: During systole, the high-pressure LV shunts blood left-to-right through the defect into the lower-pressure RV, generating turbulence throughout systole
- Important exception: In large VSDs with pulmonary hypertension (Eisenmenger syndrome), the RV pressure rises to match LV, the pressure gradient diminishes, and the murmur becomes shorter (early systolic only) or disappears entirely - replaced by signs of pulmonary hypertension
Midsystolic (Ejection) Murmurs
Aortic Stenosis (AS)
- Murmur: Harsh, rough, crescendo-decrescendo (diamond-shaped) midsystolic murmur, loudest at the right 2nd intercostal space (aortic area), radiating into the carotids
- Gallavardin effect: The murmur transmits to the apex where it sounds higher-pitched and more musical - can be mistaken for MR
- Why: The calcified/fused aortic valve leaflets create a narrowed orifice. Blood must accelerate through this stenotic orifice during ejection, producing turbulence that peaks at mid-systole when flow velocity is highest. The crescendo-decrescendo shape mirrors the ventricular ejection profile
- Associated: Slow-rising, sustained, small-amplitude carotid pulse (pulsus parvus et tardus); paradoxical split of S2 (delayed A2 due to prolonged LV ejection); loss of A2 in severe disease; S4 gallop
Pulmonary Stenosis (PS)
- Murmur: Crescendo-decrescendo at the left 2nd intercostal space (pulmonic area); murmur spills through A2 and ends at the delayed P2 (because RV takes longer to eject through the stenotic pulmonic valve)
- Why: Same mechanism as AS but on the right side. The delay in P2 is a key distinguishing feature - pulmonic valve closure is pushed later in time because the RV empties slowly through the stenosis
- Associated: Wide splitting of S2 (delayed P2), ejection click (in mild PS), RV heave
Hypertrophic Obstructive Cardiomyopathy (HOCM)
- Murmur: Harsh midsystolic murmur at the LLSB and apex, does NOT radiate to the carotids (unlike AS)
- Why: The hypertrophied interventricular septum obstructs the LV outflow tract (LVOT) during systole. The systolic anterior motion (SAM) of the mitral valve also contributes. The outflow gradient is dynamic - it worsens when the LV is smaller (preload reduction) and improves when the LV is larger (increased preload)
- Maneuvers (critical for HOCM):
- Valsalva (strain phase) / Standing up: Increases murmur (reduces preload, smaller LV, more obstruction)
- Squatting / Leg raise: Decreases murmur (increases preload, larger LV, less obstruction)
- This is opposite to AS, where Valsalva decreases the murmur
Late Systolic Murmurs
Mitral Valve Prolapse (MVP)
- Murmur: Mid-to-late systolic murmur preceded by a non-ejection mid-systolic click, both heard best at the apex; the murmur crescendos into S2
- Why: The redundant mitral leaflets billow into the LA in mid-systole. When leaflet coaptation fails, a regurgitant jet begins - hence the murmur starts late. The click represents the sudden tensing of the chordae tendineae as the leaflets reach maximal prolapse
- Maneuver trick: With Valsalva or standing (reduced preload, smaller LV), the LV reaches its critical volume earlier - the click and murmur move toward S1. With squatting (increased preload, larger LV), they move toward S2
2. Diastolic Murmurs
Early Diastolic Murmurs
Aortic Regurgitation (AR)
- Murmur: High-pitched, blowing, decrescendo diastolic murmur beginning immediately after A2, heard best at the left sternal border 3rd/4th intercostal space (Erb's point) with the patient leaning forward and breath held in expiration
- Why: The incompetent aortic valve allows blood to flow back from the high-pressure aorta into the LV throughout diastole. The murmur is loudest at the beginning of diastole when the aorto-ventricular pressure gradient is greatest, then decrescendos as the gradient diminishes over diastole
- Austin Flint murmur: In severe AR, the regurgitant jet streams across the open anterior mitral leaflet, causing it to flutter and creating a mid-diastolic rumble (mimics MS but without the opening snap)
- Peripheral signs of severe AR: Wide pulse pressure, collapsing ("water-hammer") pulse, Corrigan's pulse, Quincke's sign, Duroziez's sign, de Musset's sign (head nodding)
Pulmonary Regurgitation (PR)
- Graham Steell murmur: High-pitched, blowing, early diastolic decrescendo at the left 2nd ICS, associated with pulmonary hypertension
- Why: Pulmonary hypertension dilates the pulmonary artery and the annulus, preventing leaflet coaptation. The high diastolic pressure in the pulmonary artery drives blood back into the RV
Mid-to-Late Diastolic Murmurs
Mitral Stenosis (MS)
- Murmur: Low-pitched, rumbling, mid-diastolic murmur (best heard with the bell of the stethoscope) at the apex with the patient in the left lateral decubitus position; presystolic accentuation in sinus rhythm (due to atrial contraction augmenting flow)
- Preceded by: An opening snap (OS) - a high-pitched clicking sound shortly after S2 when the stenotic but pliable valve is forced open by LA pressure. The shorter the S2-OS interval, the more severe the stenosis (high LA pressure opens the valve earlier)
- Why: The thickened/fused mitral leaflets (usually rheumatic) create a narrow orifice. Blood flows from the high-pressure LA into the LV throughout diastole, but the gradient drives turbulent flow that produces the rumble. Presystolic accentuation occurs because atrial contraction squeezes the last bolus of blood through the narrow valve
- Associated: Loud S1 (pliable leaflet snaps shut with force); small, tapping apical impulse (underfilled LV); signs of pulmonary congestion
Tricuspid Stenosis (TS)
- Murmur: Low-pitched mid-diastolic rumble at the LLSB; increases with inspiration (Carvallo's sign - more RA-RV gradient with increased venous return)
- Why: Same mechanism as MS on the right side - narrowed tricuspid orifice creates a diastolic RA-RV gradient
3. Continuous Murmurs
Patent Ductus Arteriosus (PDA)
- Murmur: Continuous, "machinery" murmur peaking at S2, heard best at the left infraclavicular area / left 2nd ICS - the Gibson murmur
- Why: There is a pressure gradient from the aorta to the pulmonary artery in both systole AND diastole. Aortic pressure exceeds pulmonary artery pressure throughout the entire cardiac cycle, so blood flows continuously from aorta to pulmonary artery, generating non-stop turbulence that peaks at the time of greatest aorto-pulmonary gradient (around S2, when aortic pressure is high and the pulmonary artery has just received its last systolic bolus)
Other Causes of Continuous Murmurs
| Condition | Location |
|---|---|
| Coronary AV fistula | Variable |
| Ruptured sinus of Valsalva | Right sternal border |
| Aortopulmonary window | Left sternal border |
| Cervical venous hum | Neck/clavicle |
| Mammary soufflé (pregnancy) | Breast area |
| Pulmonary AV fistula | Localized over fistula |
Quick Reference Table
| Condition | Timing | Character | Best Heard | Radiation | Key Clues |
|---|---|---|---|---|---|
| Mitral Stenosis | Mid-diastolic (presystolic accentuation) | Low rumble | Apex (bell, LLD position) | None | OS, loud S1, narrow S2-OS = severe |
| Mitral Regurgitation | Holosystolic | High-pitched blowing | Apex | Axilla/back | Soft S1, S3, displaced apex |
| Mitral Valve Prolapse | Late systolic | Varies | Apex | None | Mid-systolic click moves with maneuvers |
| Aortic Stenosis | Midsystolic ejection | Harsh, rough | R 2nd ICS | Carotids | Pulsus parvus et tardus, paradoxical S2 split |
| Aortic Regurgitation | Early diastolic | High blowing decrescendo | L 3rd/4th ICS (Erb's) | None | Wide pulse pressure, Austin Flint murmur |
| Pulmonary Stenosis | Midsystolic | Crescendo-decrescendo | L 2nd ICS | None | Wide split S2, ejection click |
| Pulmonary Regurgitation | Early diastolic | Blowing decrescendo | L 2nd ICS | None | With pulmonary HTN (Graham Steell) |
| Tricuspid Regurgitation | Holosystolic | Blowing | LLSB | None | Increases with inspiration (Carvallo's) |
| Tricuspid Stenosis | Mid-diastolic | Low rumble | LLSB | None | Increases with inspiration |
| VSD | Holosystolic | Harsh | L sternal border | None | Thrill; softer if Eisenmenger's |
| HOCM | Midsystolic | Harsh | LLSB/apex | None | Increases with Valsalva/standing |
| PDA | Continuous | Machinery | L infraclavicular | None | Peaks at S2; Gibson murmur |
Key Bedside Maneuvers Summary
| Maneuver | Effect | Why |
|---|---|---|
| Inspiration | Increases right-sided murmurs (TR, TS, PR) | Increases venous return to right heart |
| Valsalva (strain) | Decreases most murmurs; increases HOCM and MVP (earlier) | Decreases LV preload and size |
| Squatting | Increases most murmurs; decreases HOCM and MVP (later) | Increases preload and afterload |
| Standing | Decreases most murmurs; increases HOCM; MVP click moves earlier | Decreases LV preload |
| Exercise | Increases most murmurs | Increases cardiac output and transvalvular gradients |
| Amyl nitrite | Increases AS, HOCM; decreases MR, AR | Reduces afterload, increases flow through stenotic valves |
Breath sounds and why
breath sounds lung auscultation normal vesicular bronchial diagram
This medical anatomical diagram illustrates the standard stethoscope placement locations for auscultation of heart and lung sounds. The image consists of two panels: an anterior (front) view and a posterior (back) view of a semi-transparent human torso. In the anterior view, labels A and B are positioned over the apical regions of the right and left lungs, respectively, while label E is located at the lower left costal margin, corresponding to the cardiac apex and mitral valve area. Visible internal structures include the lungs, heart, liver, and intestinal tract. In the posterior view, labels C and D are placed in the interscapular region at the level of the upper thoracic spine, typically used for assessing posterior bronchial and vesicular breath sounds. This view highlights the vertebral column, ribs, and scapulae, with a red glow emphasizing the spinal region. This illustration serves as an educational guide for clinical physical examination techniques, demonstrating the relationship between surface landmarks and underlying thoracic and abdominal viscera.
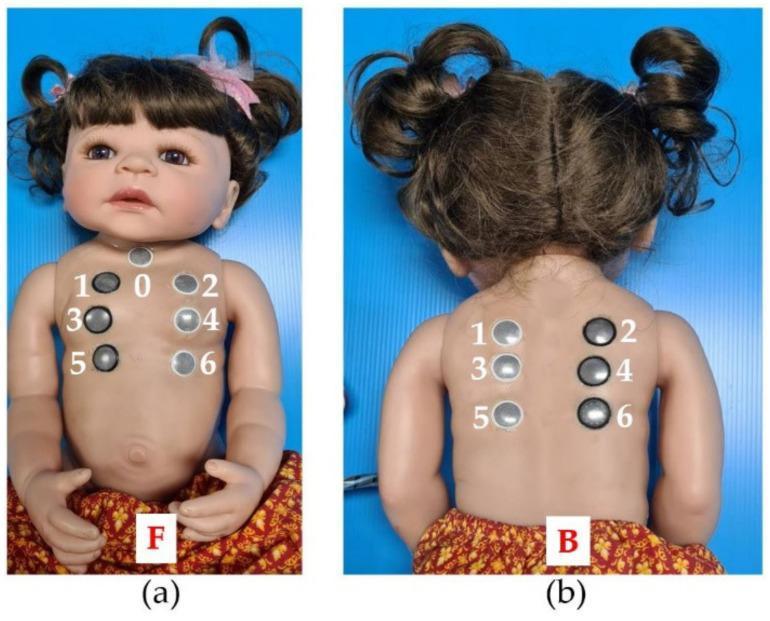
This clinical photograph shows a specialized high-fidelity simulation (HFS) child mannequin designed for nursing education, specifically for practicing pediatric respiratory auscultation. Figure (a) displays the anterior (front) view, featuring seven integrated earphone sensors labeled 0-6. These sensors are strategically positioned over the tracheal, bronchial, and vesicular areas of the chest. Figure (b) shows the posterior (back) view, with six labeled sensors (1-6) arranged along the paravertebral and infrascapular regions. Each numbered location corresponds to a specific programmed lung sound (normal or adventitious), allowing students to practice systematic auscultation using a stethoscope. The mannequin is constructed from soft, flexible silicone vinyl to mimic human skin and is sized to represent an infant under three months of age. This educational tool is used to bridge the gap between theoretical knowledge and clinical skill proficiency in detecting pediatric breathing pathologies.
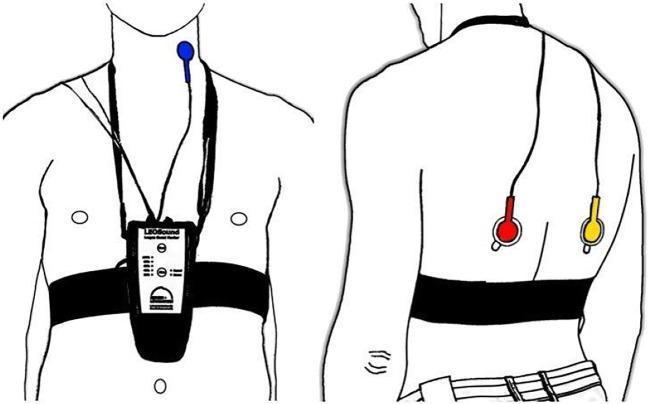
An anatomical diagram illustrating the placement of the LEOSound lung-sound monitor and its bio-acoustical sensors on a patient. The illustration includes two views: an anterior (front) view and a posterior (back) view. In the anterior view, a recording device is secured to the mid-thorax by a black chest belt and a neck strap. A blue tracheal microphone is positioned on the neck near the trachea. In the posterior view, two additional microphones are attached using adhesive pads to the inferior region of the left (red microphone) and right (yellow microphone) scapula. The system is designed for mobile, long-term recording and automated analysis of respiratory sounds such as coughing and wheezing. The diagrams emphasize the standardized anatomical landmarks required for optimal auscultation and data collection in clinical or home settings.
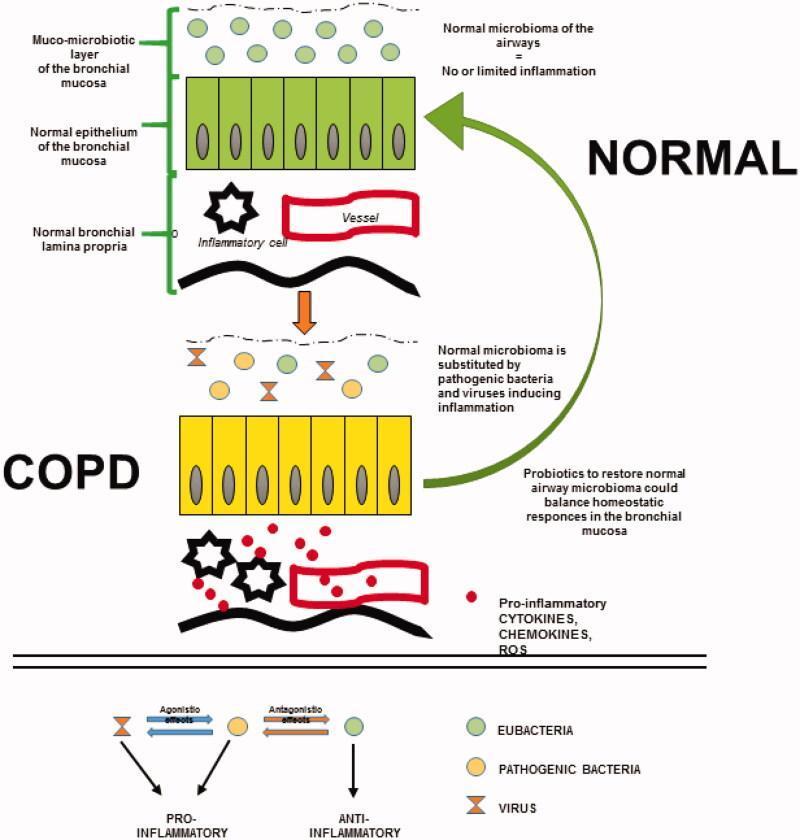
This medical schematic contrasts the airway mucosa and muco-microbiotic layer between healthy (Normal) subjects and Chronic Obstructive Pulmonary Disease (COPD) patients. The diagram is divided into two primary sections. The top 'Normal' section shows a healthy bronchial mucosa consisting of a muco-microbiotic layer populated by eubacteria (green circles), an orderly green columnar epithelium, and a lamina propria with minimal inflammatory presence. The middle 'COPD' section illustrates dysbiosis, where the eubacteria are replaced by pathogenic bacteria (yellow circles) and viruses (hourglass symbols). This microbial shift is associated with an inflammatory state in the bronchial-bronchiolar mucosa, characterized by increased inflammatory cells (black star shapes), pro-inflammatory cytokines, chemokines, and reactive oxygen species (ROS) (red dots), and vascular involvement in the lamina propria. A bottom legend describes the signaling logic: eubacteria exert anti-inflammatory effects and act as antagonists to pathogenic bacteria, while pathogenic bacteria and viruses exert agonist-challenging pro-inflammatory effects. The diagram highlights the potential role of probiotics in restoring lung homeostasis.
Breath Sounds: Types, Mechanisms, and Clinical Significance
Important Note on Terminology
Part 1: Normal Breath Sounds
1. Normal Breath Sounds (previously "Vesicular")
- Where heard: Over most of the lung periphery
- Character: Soft, low-pitched (200-600 Hz), non-musical; inspiratory phase is longer and louder than expiratory; expiratory sounds may be barely audible
- Why they sound this way:
- The inspiratory component is generated by turbulent airflow in the lobar and segmental bronchi as air accelerates inward
- The expiratory component originates in the larger, more central airways - by the time those sounds reach the chest wall, they have been dampened and filtered by the large air-filled lung volume, making them soft or absent
- Intensity varies with regional ventilation - diminishes in hypoventilated zones
- Clinical pearl: Diminished or absent normal breath sounds = reduced airflow through that region (obstruction, effusion, pneumothorax, emphysema)
2. Tracheal Breath Sounds
- Where heard: Over the trachea, just below the sternal notch
- Character: Loud, hollow, harsh, non-musical (75-1600 Hz); equal in inspiration and expiration with a brief pause between phases
- Why: Air passes through the wide, rigid tracheal tube at high velocity with pronounced turbulence. There is minimal lung parenchyma to dampen the sound, so both phases are equally loud
- Normal only here - if heard in the lung periphery, they become pathological (see bronchial breath sounds below)
3. Bronchovesicular Breath Sounds
- Where heard: Over the 1st and 2nd intercostal spaces anteriorly, and between the scapulae posteriorly (near the main bronchi)
- Character: Intermediate intensity; inspiration and expiration roughly equal in length and loudness
- Why: These zones overlie large bronchi but also have surrounding alveolar tissue, creating a blend of tracheal-quality and peripheral dampening
Part 2: Adventitious (Abnormal) Breath Sounds
Continuous Adventitious Sounds
Bronchial (Tubular) Breath Sounds
- Character: Loud, harsh, high-pitched; expiratory phase is longer and louder than inspiratory (the reverse of normal); a distinct gap exists between inspiration and expiration
- Where pathologically heard: Peripheral lung zones where vesicular sounds should be present
- Why this happens: In normal lungs, the large central airway sounds are filtered and dampened by air-filled alveoli before reaching the chest wall. When alveoli become consolidated (filled with fluid, pus, or blood - as in pneumonia) or collapsed (atelectasis), they lose their air cushion but remain connected to a patent bronchus. They now transmit large-airway sounds directly to the chest wall without filtering - like listening through a solid medium instead of air
- Conditions: Lobar pneumonia (classic), pulmonary infarction, compression atelectasis adjacent to a large effusion (Skodaic resonance zone)
- Associated signs: Increased vocal fremitus, bronchophony, egophony ("E to A" change), whispered pectoriloquy
Wheezes
- Character: Continuous musical sound lasting >250 ms; high-pitched (dominant frequency ≥400 Hz); hissing quality; predominantly expiratory but can be bi-phasic in severe airflow obstruction
- Mechanism: Generated by two mechanisms acting together in a narrowed airway:
- Limitation of airflow - narrowed lumen creates a velocity gradient
- Airway wall vibration - the walls flutter like a reed instrument as high-velocity air flows past them (the "flutter mechanism")
- Expiration is more commonly affected because during expiration, dynamic airway compression adds to any existing narrowing, causing walls to appose and vibrate
- Conditions producing wheezes:
- Asthma: Diffuse bronchospasm + mucosal edema + mucus plugging; can be bi-phasic in a severe attack. A "silent chest" in severe asthma is ominous - so little air movement that no wheeze is generated
- COPD: Chronic airway narrowing from inflammation, loss of elastic recoil, and mucus; typically diffuse, expiratory
- Cardiac asthma: Left heart failure floods peribronchial tissue, compressing airways from the outside
- Anaphylaxis: Massive bronchospasm
- Focal/fixed wheeze: A single persistent wheeze at the same location = partial bronchial obstruction by a tumour, foreign body, or lymph node pressing on airway; does not clear with coughing
Rhonchi
- Character: Continuous, low-pitched (dominant frequency <200 Hz); snoring or gurgling quality; lasting >250 ms; heard in expiration (occasionally both phases)
- Mechanism: Caused by secretions (liquid or mucus) in large airways partially blocking the lumen. As airflow passes through or around mucus, it causes the secretions and the airway walls to oscillate
- Key distinguishing feature: Rhonchi change or clear after coughing (the cough repositions or expels the secretions, altering or eliminating the sound). Wheezes do NOT clear with coughing
- Conditions: Bronchitis, COPD with mucus hypersecretion, bronchiectasis, retained secretions post-operatively
Stridor
- Character: High-pitched, continuous, predominantly inspiratory musical sound; best heard over the neck and upper trachea, not the chest
- Mechanism: Turbulent airflow through a significantly narrowed extrathoracic (upper) airway. During inspiration, negative intraluminal pressure causes the already-narrowed extrathoracic airway to collapse further, generating intense turbulence and the characteristic sound. During expiration, positive intraluminal pressure stents the airway open, so the sound is less prominent
- Fixed lesions (not dynamic) produce stridor in both inspiration and expiration
- Conditions: Croup (in children - subglottic edema), epiglottitis, anaphylaxis (laryngeal edema), foreign body, laryngeal tumour, postintubation subglottic stenosis, tracheal compression by a goitre or mediastinal mass
- Clinically critical: Stridor signals a potentially life-threatening upper airway obstruction and demands urgent assessment. It is sometimes mistaken for a wheeze - the key difference is that stridor is inspiratory, over the neck, while wheeze is expiratory, over the chest
Discontinuous Adventitious Sounds
Fine Crackles (Fine Rales / Crepitations)
- Character: Soft, high-pitched, short-duration explosive pops; mid-to-late inspiratory (heard toward the end of inspiration); not altered by coughing; sound like rubbing strands of hair together near the ear, or the sound of pulling velcro apart
- Mechanism: During expiration, small airways and alveoli in dependent lung zones close prematurely under the weight of the lung and increased surface tension. On the next inspiration, when airway opening pressure is reached, these collapsed airways snap open explosively - the rapid release of stored pressure creates the crackling pop. The sound occurs late in inspiration because the terminal airways open last, after the larger airways have already opened
- Conditions:
- Pulmonary fibrosis / Interstitial lung disease: Stiff, inelastic alveoli and airways collapse and snap open repeatedly; classic bilateral basal fine crackles, sometimes described as "Velcro rales"
- Pulmonary oedema (heart failure): Fluid in alveoli increases surface tension, causing premature airway closure; bilateral basal fine crackles, may become more widespread as oedema worsens
- Early pneumonia: Alveolar fluid causes the same mechanism as oedema
- Atelectasis: Crackles from re-expansion of collapsed segments; may clear with deep breathing
Coarse Crackles
- Character: Louder, lower-pitched, longer-duration explosive pops; early inspiratory (and sometimes expiratory); often change or clear with coughing
- Mechanism: Opening of larger, more proximal airways (bronchi) that have collapsed due to secretions or loss of structural support. The larger airway generates a louder, lower-frequency pop
- Conditions: Bronchiectasis (classic), chronic bronchitis, COPD with secretions, resolving pneumonia with retained secretions. The fact that they change with coughing distinguishes them from fine crackles
Clinical distinction - Fine vs. Coarse Crackles
| Feature | Fine Crackles | Coarse Crackles |
|---|---|---|
| Pitch | High | Low |
| Timing | Mid-to-late inspiratory | Early inspiratory (± expiratory) |
| Coughing | No change | May clear or change |
| Sound | Velcro/hair rubbing | Bubbling/gurgling |
| Mechanism | Small airway snap-open | Large airway secretions |
| Key conditions | Fibrosis, pulmonary oedema | Bronchiectasis, bronchitis |
Extrapulmonary Sounds
Pleural Friction Rub
- Character: Coarse, leathery, creaking, or grating sound; heard in both inspiration and expiration (biphasic); typically loudest at the lung base; sounds "close to the ear"; does NOT change with coughing; may be exaggerated by pressing the stethoscope firmly
- Mechanism: Normally the visceral and parietal pleural surfaces slide smoothly over each other, lubricated by a thin film of pleural fluid. When pleural surfaces are thickened and roughened by inflammation or tumour, sliding is impaired and friction generates the sound - like two pieces of leather rubbing together. The sound is generated by the change in shape of thickened pleura itself (even a small amount of fluid remains between surfaces)
- Conditions: Pleuritis (pleurisy) from pneumonia, pulmonary embolism/infarction, viral pleuritis, tuberculosis, mesothelioma, uraemic pleuritis
- Important: A rub may temporarily disappear if a large effusion develops (fluid separates the surfaces) - but can reappear at the effusion margins
Mediastinal Crunch (Hamman's Sign)
- Character: Crunching, crackling sounds synchronous with cardiac contraction (not respiration); heard over the precordium
- Mechanism: Air in the mediastinum (pneumomediastinum) is compressed by each heartbeat, creating the crunching sound
- Conditions: Spontaneous pneumomediastinum, oesophageal rupture (Boerhaave syndrome), barotrauma
Part 3: Voice Sounds
| Sign | Technique | Normal | Abnormal finding | Condition |
|---|---|---|---|---|
| Bronchophony | Ask patient to say "99" | Muffled, indistinct | Louder, clearer transmission | Consolidation (pneumonia) |
| Egophony | Ask patient to say "E" | Heard as "E" | Heard as "A" ("E to A" change) | Consolidation + adjacent effusion; most specific sign of pneumonia |
| Whispered pectoriloquy | Ask patient to whisper "1-2-3" | Faint, indistinct | Clearly heard whisper | Consolidation |
| Decreased tactile fremitus | Palm flat on chest while patient says "99" | Equal bilaterally | Reduced/absent | Effusion, pneumothorax, emphysema |
| Increased tactile fremitus | Same | Equal bilaterally | Increased | Consolidation |
Part 4: Complete Clinical Reference Table
| Disorder | Percussion | Breath Sounds | Adventitious Sounds | Voice Sounds | Trachea |
|---|---|---|---|---|---|
| Normal | Resonant | Normal | None | Normal | Midline |
| Pneumonia (consolidation) | Dull | Bronchial | Crackles (fine/coarse) | Bronchophony, egophony, pectoriloquy | Midline |
| Pleural effusion (large) | Stony dull | Absent/reduced | None (rub above effusion) | Absent; egophony at top of effusion | Shifted away |
| Pneumothorax | Hyperresonant | Absent | None | Absent/reduced | Shifted away (tension) |
| Atelectasis (lobar) | Dull | Absent/bronchial | Crackles | Reduced | Shifted toward |
| Asthma (acute) | Hyperresonant | Normal or reduced | Diffuse expiratory wheeze; silent chest if severe | Normal | Midline |
| COPD | Hyperresonant | Reduced ("barrel chest") | Expiratory wheeze, rhonchi | Reduced | Midline |
| Pulmonary fibrosis (ILD) | Normal | Normal or reduced | Bilateral basal fine crackles ("Velcro") | Normal | Midline |
| Pulmonary oedema (CHF) | Normal → dull (if effusion) | Normal or bronchial | Bilateral basal fine crackles | Normal | Midline |
| Bronchiectasis | Normal | Normal or reduced | Coarse crackles, change with coughing | Normal | Midline |
| Pleuritis | Normal | Normal | Pleural friction rub | Normal | Midline |
| Upper airway obstruction | Normal | Normal | Inspiratory stridor (heard over neck) | Normal | Midline/deviated |
Summary: Why Each Sound Occurs
| Sound | Mechanism in one line |
|---|---|
| Normal breath sounds | Turbulent flow in bronchi, filtered and dampened by air-filled alveoli |
| Bronchial breath sounds | Consolidated/airless alveoli transmit large-airway sounds directly without dampening |
| Wheeze | Narrowed airway walls flutter like a reed in high-velocity airflow |
| Rhonchus | Secretions in large airways vibrate the lumen walls |
| Stridor | Narrowed extrathoracic airway collapses further on inspiration, generating intense turbulence |
| Fine crackles | Small airways that closed prematurely snap open explosively in late inspiration |
| Coarse crackles | Larger airways with secretions open explosively in early inspiration |
| Pleural friction rub | Roughened, inflamed pleural surfaces scrape against each other during respiratory movement |