
Explain me 10 common heart diseases with ECG changes and ECG image of those disease
Reading File
Now let me search the medical library and for ECG images in parallel:
Finding Sources
Searching Images
ECG myocardial infarction ST elevation STEMI
Searching Images
atrial fibrillation ECG electrocardiogram
Finding Sources
Searching Images
heart block complete AV block ECG
Searching Images
ventricular tachycardia ECG electrocardiogram
Searching Images
left ventricular hypertrophy ECG voltage criteria
Searching Images
Wolff-Parkinson-White syndrome delta wave ECG
Searching Images
pulmonary embolism ECG S1Q3T3 right heart strain
Searching Images
hypertrophic cardiomyopathy ECG deep Q waves
Searching Images
pericarditis ECG diffuse ST elevation saddle shape
Searching Images
long QT syndrome ECG prolonged QT interval
I now have excellent ECG images for all 10 conditions. Let me compile the comprehensive answer.# 10 Common Heart Diseases — ECG Changes & Images
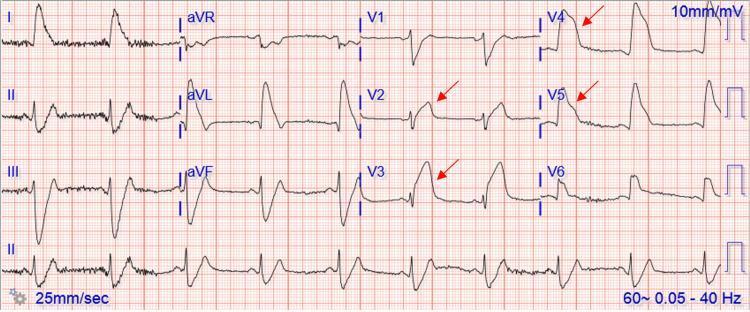
1. 🫀 ST-Elevation Myocardial Infarction (STEMI)
Pathophysiology: Complete occlusion of a coronary artery causes transmural ischemia, injuring the full thickness of the myocardial wall.
Key ECG Changes:
| Feature | Description |
|---|---|
| ST elevation | ≥1 mm in ≥2 contiguous leads (≥2 mm in V1–V3) |
| Hyperacute T waves | Tall, peaked T waves — earliest sign |
| Reciprocal ST depression | In leads opposite the infarct zone |
| Pathological Q waves | Develop within hours → indicate necrosis |
| T-wave inversion | Evolves after ST elevation resolves |
Localization by leads:
- Anterior (LAD): V1–V4
- Inferior (RCA): II, III, aVF
- Lateral (LCx): I, aVL, V5–V6
2. 💓 Atrial Fibrillation (AF)
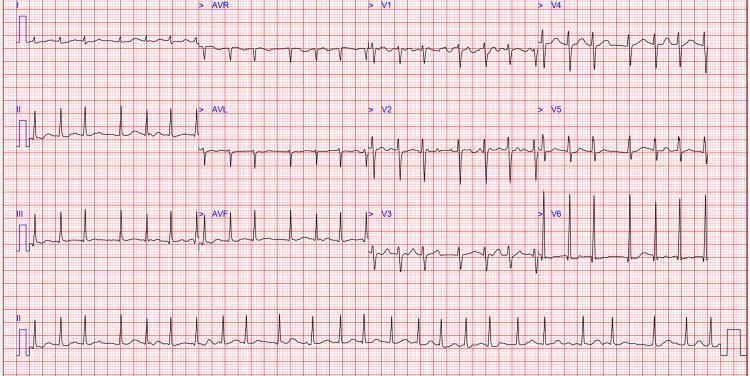
Pathophysiology: Chaotic, disorganized atrial electrical activity from multiple re-entrant wavelets; the AV node receives irregular impulses and conducts them irregularly to the ventricles.
Key ECG Changes:
| Feature | Description |
|---|---|
| Absent P waves | Replaced by irregular fibrillatory (f) waves |
| Irregularly irregular rhythm | Hallmark — no two R-R intervals are equal |
| Fibrillatory baseline | Best seen in V1 and lead II (350–600 cycles/min) |
| Narrow QRS | Unless aberrant conduction (BBB or accessory pathway) |
| Variable ventricular rate | 60–180 bpm depending on AV nodal conduction |
3. 🧱 Complete (Third-Degree) AV Block
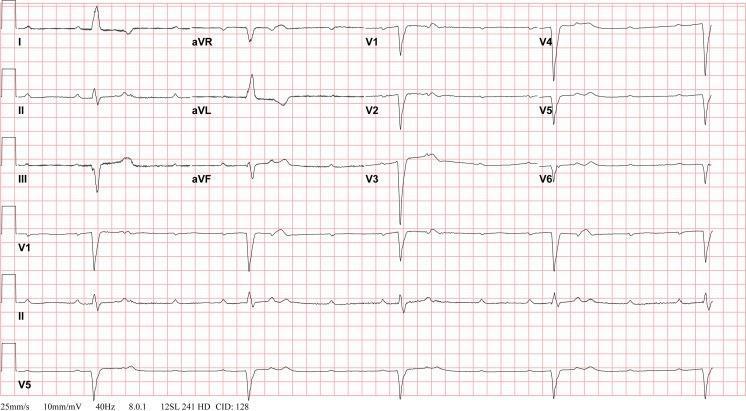
Pathophysiology: Total failure of conduction between the atria and ventricles. The atria and ventricles beat independently — atria controlled by the SA node, ventricles by an escape pacemaker (junctional or ventricular).
Key ECG Changes:
| Feature | Description |
|---|---|
| AV dissociation | P waves and QRS complexes march independently |
| Regular P-P intervals | Normal or faster atrial rate |
| Regular R-R intervals | Slow, regular ventricular escape rhythm |
| No fixed PR interval | P waves appear before, within, and after QRS |
| QRS morphology | Narrow if junctional escape; wide (>120 ms) if ventricular escape |
| Bradycardia | Ventricular rate 20–50 bpm |
4. ⚡ Ventricular Tachycardia (VT)
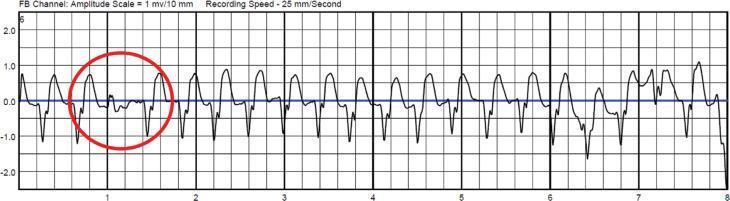
Pathophysiology: Three or more consecutive ventricular beats at >100 bpm originating below the Bundle of His. Often occurs in structurally diseased hearts (ischaemic cardiomyopathy, scarring).
Key ECG Changes:
| Feature | Description |
|---|---|
| Wide QRS | >120 ms (typically >140 ms) |
| Rate | 100–250 bpm, usually regular |
| AV dissociation | Independent P waves (seen in ~50%) |
| Fusion beats | Transitional QRS when sinus and ventricular impulse merge |
| Capture beats | Rare narrow QRS — sinus briefly "captures" ventricle |
| Concordance | All precordial leads point same direction (positive or negative) |
| Northwest axis | Extreme right axis deviation |
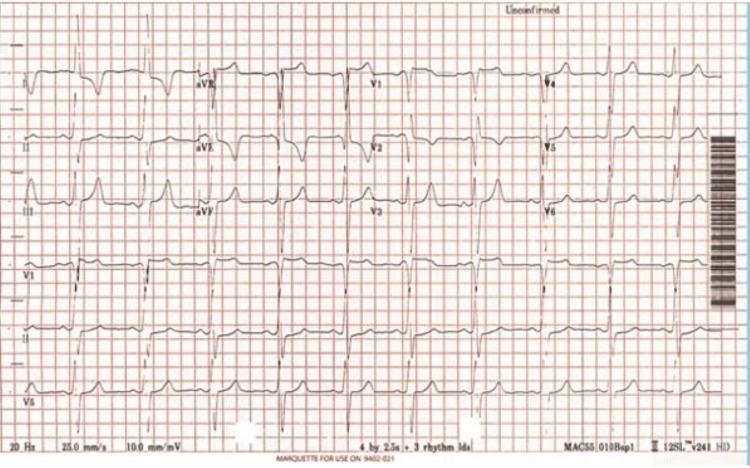
5. 🏋️ Left Ventricular Hypertrophy (LVH)
Pathophysiology: Increased LV muscle mass (usually from longstanding hypertension or aortic stenosis) increases the electrical voltage of the LV, and delayed repolarization produces the "strain pattern."
Key ECG Changes:
| Feature | Description |
|---|---|
| Sokolow-Lyon criteria | S in V1 + R in V5 or V6 ≥35 mm |
| Cornell criteria | R in aVL + S in V3 >28 mm (men) or >20 mm (women) |
| Strain pattern | ST depression + T-wave inversion in I, aVL, V5–V6 |
| Left axis deviation | QRS axis more negative than −30° |
| Left atrial enlargement | Broad notched P waves (P mitrale) |
| Deep S in V1/V2 | Large depolarization vector |
6. 🌀 Wolff-Parkinson-White (WPW) Syndrome
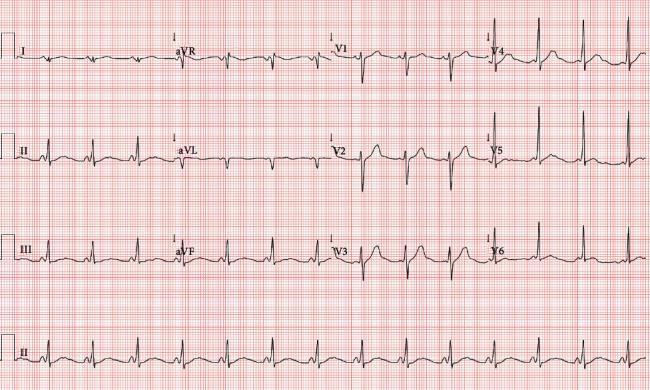
Pathophysiology: An accessory conduction pathway (Bundle of Kent) bypasses the AV node, pre-exciting part of the ventricle before the normal conduction system arrives. This creates a characteristic short PR + delta wave pattern.
Key ECG Changes:
| Feature | Description |
|---|---|
| Short PR interval | <120 ms — AV node delay bypassed |
| Delta wave | Slurred upstroke at start of QRS |
| Wide QRS | >120 ms (from delta wave fusion) |
| Secondary ST-T changes | ST/T in opposite direction to delta wave |
| Pseudo-infarction Q waves | Negative delta waves mimic Q waves |
| Risk | AF with pre-excitation → extremely rapid ventricular rate → VF |
7. 🫁 Pulmonary Embolism (PE)
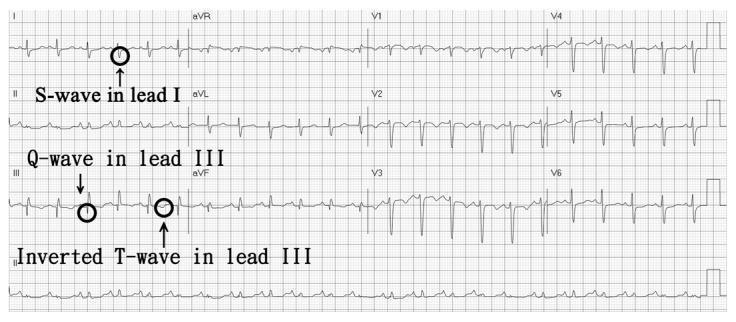
Pathophysiology: Massive PE causes acute right ventricular pressure overload. The RV dilates, shifts the interventricular septum left, and causes characteristic ECG changes of acute right heart strain.
Key ECG Changes:
| Feature | Description |
|---|---|
| Sinus tachycardia | Most common finding (>100 bpm) |
| S1Q3T3 pattern | S wave in lead I, Q wave in lead III, T-wave inversion in lead III |
| T-wave inversions V1–V4 | Right ventricular strain pattern |
| Incomplete/complete RBBB | Due to RV pressure overload |
| P pulmonale | Peaked P waves in inferior leads (right atrial strain) |
| Right axis deviation | Acute rightward shift |
| Low-voltage / sinus tachycardia | In smaller PE |
8. 🧬 Hypertrophic Cardiomyopathy (HCM)
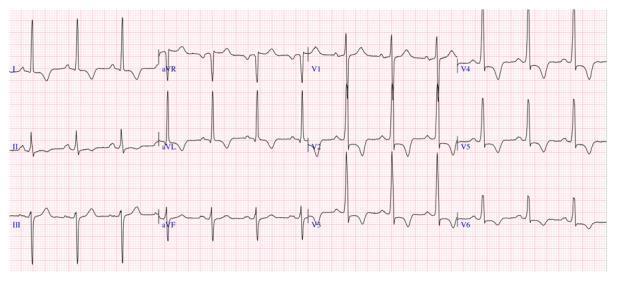
Pathophysiology: Genetic sarcomere mutation causes asymmetric myocardial hypertrophy, myofiber disarray, and fibrosis. The massive LV mass and disorganized depolarization produce dramatic ECG abnormalities.
Key ECG Changes:
| Feature | Description |
|---|---|
| LVH voltage criteria | Deep S in V1 + tall R in V5/V6 often >50 mm |
| Deep septal Q waves | Narrow, deep Q waves in I, aVL, V5–V6 (from septal depolarization) |
| Giant T-wave inversions | Deep symmetric T inversions V2–V6 (especially apical HCM / Yamaguchi syndrome ≥10 mm) |
| ST depression | Lateral leads — "strain" pattern |
| LAE | Broad notched P waves |
| Absent septal Q waves | In obstructive septal HCM variants |
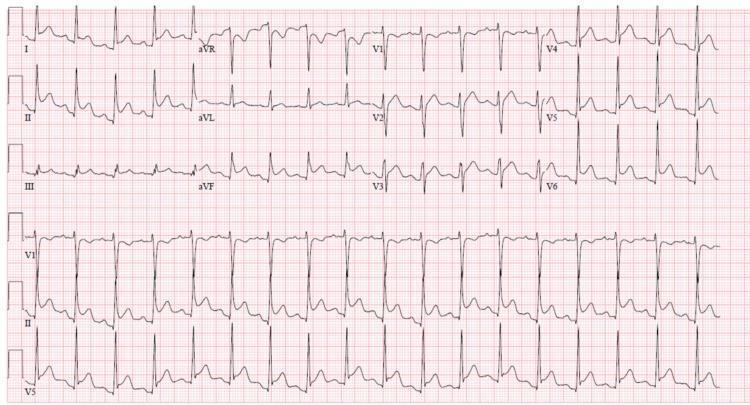
9. 🔥 Acute Pericarditis
Pathophysiology: Inflammation of the pericardium causes myocardial epicardial irritation, leading to diffuse (non-territory-specific) ST and PR changes — distinguishing it from focal STEMI.
Key ECG Changes:
| Feature | Description |
|---|---|
| Diffuse saddle-shaped ST elevation | Concave-upward in almost all leads (except aVR and V1) |
| PR depression | Classic early sign — best seen in lead II; reflects atrial injury |
| PR elevation in aVR | Reciprocal to PR depression |
| Spodick's sign | Downsloping TP segment — specific for pericarditis |
| ST depression in aVR | Reciprocal change |
| 4 evolutionary stages | ST elevation → ST normalizes → T-wave inversion → resolution |
| No reciprocal ST depression | (unlike STEMI — key differentiator) |
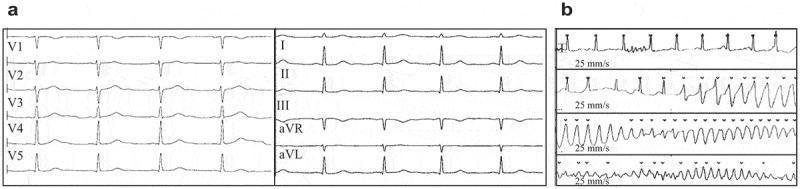
10. ⏱️ Long QT Syndrome (LQTS)
Pathophysiology: Congenital (channelopathy — KCNQ1, KCNH2, SCN5A mutations) or acquired (drugs, electrolyte abnormalities) impairment of ventricular repolarization. Predisposes to Torsades de Pointes (TdP) → ventricular fibrillation → sudden cardiac death.
Key ECG Changes:
| Feature | Description |
|---|---|
| Prolonged QTc | QTc >450 ms (men), >460 ms (women); pathological >500 ms |
| LQT1 | Broad-based smooth T wave; triggered by exercise |
| LQT2 | Low-amplitude, notched/bifid T wave; triggered by sudden sounds |
| LQT3 | Long flat ST segment, late-peaking T wave; worse at rest/bradycardia |
| T-wave alternans | Beat-to-beat alternation in T-wave morphology — risk marker |
| Torsades de Pointes | Polymorphic VT with characteristic QRS "twisting" around isoelectric line |
| Bradycardia | Exacerbates QT prolongation |
Quick Reference Summary
| # | Disease | Hallmark ECG Finding |
|---|---|---|
| 1 | STEMI | Convex ST elevation + reciprocal depression + Q waves |
| 2 | Atrial Fibrillation | Irregularly irregular, no P waves, f-wave baseline |
| 3 | Complete AV Block | AV dissociation, slow escape rhythm |
| 4 | Ventricular Tachycardia | Wide complex tachycardia, AV dissociation, fusion/capture beats |
| 5 | LVH | High voltage (Sokolow/Cornell) + lateral strain pattern |
| 6 | WPW Syndrome | Short PR + delta wave + wide QRS |
| 7 | Pulmonary Embolism | S1Q3T3 + sinus tachycardia + RV strain |
| 8 | HCM | Giant T-wave inversions + high voltage + deep Q waves |
| 9 | Acute Pericarditis | Diffuse saddle ST elevation + PR depression (all leads) |
| 10 | Long QT Syndrome | QTc >460 ms + notched/broad T waves → Torsades |
Clinical note: ECG findings should always be interpreted in the clinical context. Many conditions can produce overlapping patterns — serial ECGs and correlation with symptoms, history, and biomarkers is essential.Here's a complete guide to all 10 common heart diseases with their ECG changes and actual clinical ECG images:
What's covered:
- STEMI — Convex ST elevation, tombstone pattern, Q waves, reciprocal changes localized by vascular territory
- Atrial Fibrillation — Irregularly irregular rhythm, absent P waves, fibrillatory baseline
- Complete AV Block — Full AV dissociation, independent slow ventricular escape rhythm
- Ventricular Tachycardia — Wide complex tachycardia, AV dissociation, capture and fusion beats
- Left Ventricular Hypertrophy — High voltage (Sokolow-Lyon/Cornell criteria), lateral strain pattern
- WPW Syndrome — Classic triad: short PR + delta wave + wide QRS
- Pulmonary Embolism — S1Q3T3 pattern, sinus tachycardia, RV strain
- Hypertrophic Cardiomyopathy — Giant T-wave inversions, high precordial voltage, deep Q waves
- Acute Pericarditis — Diffuse saddle-shaped ST elevation across all leads, PR depression, Spodick's sign
- Long QT Syndrome — Prolonged QTc, notched T waves, progression to Torsades de Pointes
Each section includes a feature table with specific diagnostic criteria and a real ECG image from the medical literature. The summary table at the bottom provides a rapid reference for the hallmark finding of each condition.
This is a shared conversation. Sign in to Orris to start your own chat.