
Explain hypertension in simple and easy way by mission parichari book
hypertension blood pressure causes treatment diagram
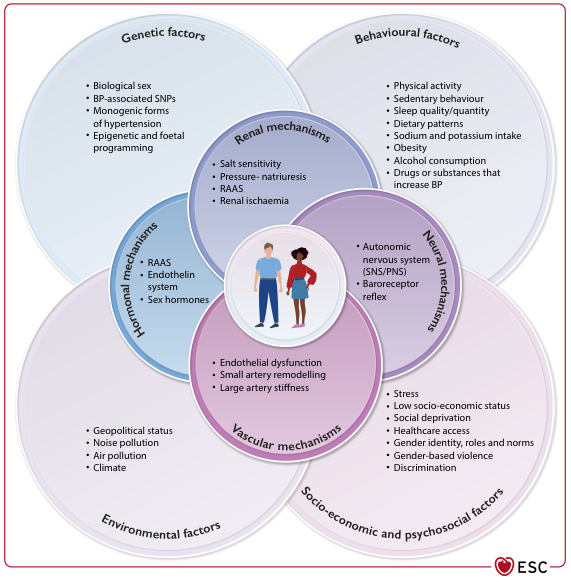
Summary : This figure presents a comprehensive overview of the multifactorial causes and mechanisms underlying blood pressure (BP) elevation and hypertension, organised as overlapping Venn diagrams. It categorises risk factors into genetic, behavioural, environmental, and socio-economic/psychosocial domains, and details the physiological mechanisms (renal, hormonal, neural, vascular) that mediate BP regulation. venn diagram / conceptual illustration: # Main Domains : • Genetic factors: Biological sex, BP-associated SNPs, monogenic forms of hypertension, epigenetic and foetal programming. • Behavioural factors: Physical activity, sedentary behaviour, sleep quality/quantity, dietary patterns, sodium and potassium intake, obesity, alcohol consumption, drugs/substances that increase BP. • Environmental factors: Geopolitical status, noise pollution, air pollution, climate. • Socio-economic and psychosocial factors: Stress, low socio-economic status, social deprivation, healthcare access, gender identity/roles/norms, gender-based violence, discrimination. # Physiological Mechanisms (Central Overlapping Circles) : ## Renal mechanisms : • Salt sensitivity • Pressure-natriuresis • RAAS (Renin-Angiotensin-Aldosterone System) • Renal ischaemia ## Hormonal mechanisms : • RAAS • Endothelin system • Sex hormones ## Neural mechanisms : • Autonomic nervous system (SNS/PNS) • Baroreceptor reflex ## Vascular mechanisms : • Endothelial dysfunction • Small artery remodelling • Large artery stiffness # Central Illustration : • At the centre, a cartoon of a man and woman symbolises the affected population. # Design Encodings : • Each domain is represented by a large, coloured circle with overlapping regions for mechanisms. • Mechanisms are shown as smaller, darker circles overlapping the main domains. • Bulleted lists within each circle detail specific factors/mechanisms. • ESC logo at bottom right. # Analysis : • The figure visually emphasises that hypertension is a complex, multifactorial condition resulting from the interplay of genetic, behavioural, environmental, and socio-economic/psychosocial factors. • Physiological mechanisms (renal, hormonal, neural, vascular) are central and overlap with all domains, indicating their integrative role in BP regulation. • The central placement of the affected individuals highlights the human impact and the need for a holistic approach to hypertension prevention and management. • No quantitative data or statistical relationships are presented; the figure is conceptual and descriptive.
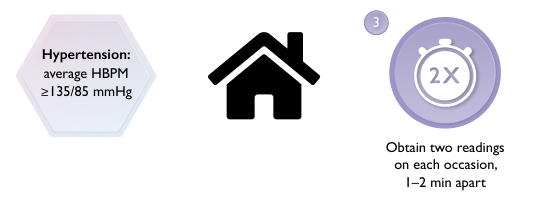
Summary : This diagram illustrates the protocol for diagnosing hypertension using home blood pressure monitoring (HBPM), specifying the threshold for hypertension and the recommended measurement procedure. flowchart: # Nodes : • "Hypertension: average HBPM ≥135/85 mmHg" (hexagon) • House icon (represents home measurement) • "3" (circle, step number) • "2X" stopwatch icon (indicates two readings) • "Obtain two readings on each occasion, 1–2 min apart" (text) # Connectors : • Implied sequential flow from hypertension definition → home measurement → step 3 (obtain two readings). # Layout : • Left-to-right arrangement: hypertension threshold (left), home icon (center), step 3 instructions (right). • Visual icons supplement text for clarity. # Analysis : • The figure communicates that hypertension is defined as an average HBPM of ≥135/85 mmHg. • It instructs users to take two blood pressure readings at home on each occasion, spaced 1–2 minutes apart, as part of the diagnostic protocol. • The use of icons and step numbering enhances clarity and guides the user through the recommended measurement process.
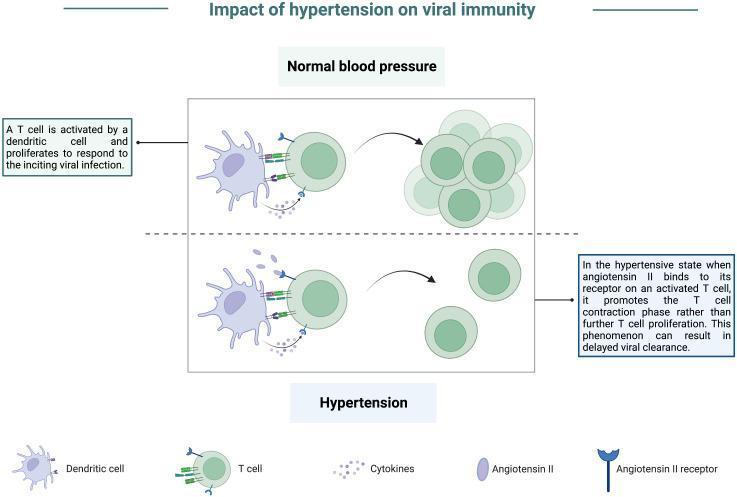
A pathophysiology diagram titled 'Impact of hypertension on viral immunity' comparing cellular immune responses under normal and hypertensive conditions. The top panel, 'Normal blood pressure,' illustrates a dendritic cell presenting antigens to a T cell via receptor-ligand interactions and cytokine release. This stimulation leads to robust T-cell activation and proliferation, resulting in a large cluster of effector T cells essential for viral clearance. The bottom panel, 'Hypertension,' depicts the same initial dendritic cell-T cell interaction but highlights the presence of elevated Angiotensin II. Angiotensin II binds to Angiotensin II receptors expressed on the activated T cell. This signaling inhibits sustained proliferation and instead promotes a T-cell contraction phase, resulting in a significantly reduced population of T cells. The diagram indicates that this hypertensive state leads to an impaired effector response and delayed viral clearance. Key components labeled include dendritic cells, T cells, cytokines, Angiotensin II, and Angiotensin II receptors.
hypertension complications heart kidney stroke organ damage
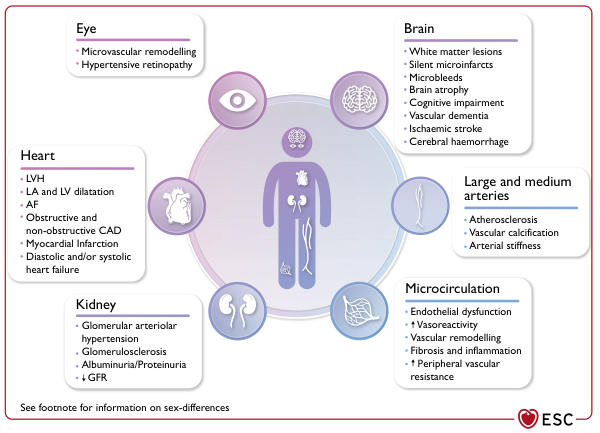
Summary : This figure illustrates the organ-specific and vascular effects of hypertension, detailing pathological changes in the eye, heart, kidney, brain, large and medium arteries, and microcirculation. Each organ system is listed with its associated hypertensive complications. diagram: # Organ Systems and Hypertensive Effects : ## Eye : • Microvascular remodelling • Hypertensive retinopathy ## Heart : • LVH (left ventricular hypertrophy) • LA and LV dilatation (left atrial and left ventricular) • AF (atrial fibrillation) • Obstructive and non-obstructive CAD (coronary artery disease) • Myocardial infarction • Diastolic and/or systolic heart failure ## Kidney : • Glomerular arteriolar hypertension • Glomerulosclerosis • Albuminuria/Proteinuria • ↓ GFR (glomerular filtration rate) ## Brain : • White matter lesions • Silent microinfarcts • Microbleeds • Brain atrophy • Cognitive impairment • Vascular dementia • Ischaemic stroke • Cerebral haemorrhage ## Large and Medium Arteries : • Atherosclerosis • Vascular calcification • Arterial stiffness ## Microcirculation : • Endothelial dysfunction • ↑ Vasoreactivity • Vascular remodelling • Fibrosis and inflammation • ↑ Peripheral vascular resistance # Layout : • Central human figure with icons representing each organ system. • Each organ system is connected to a text box listing its hypertensive complications. • Colour-coded circles and boxes for each organ/vascular system. # Additional Information : • Footnote mentions sex-differences (not detailed in the figure). • ESC (European Society of Cardiology) logo at the bottom right. # Analysis : • The figure demonstrates that hypertension affects multiple organ systems, with distinct pathological changes in each. • Both macrovascular (large arteries) and microvascular (small vessels, microcirculation) complications are highlighted. • The heart, brain, and kidney are shown to be particularly vulnerable, with a wide range of structural and functional consequences. • The diagram visually emphasises the systemic nature of hypertensive disease and its multi-organ impact.
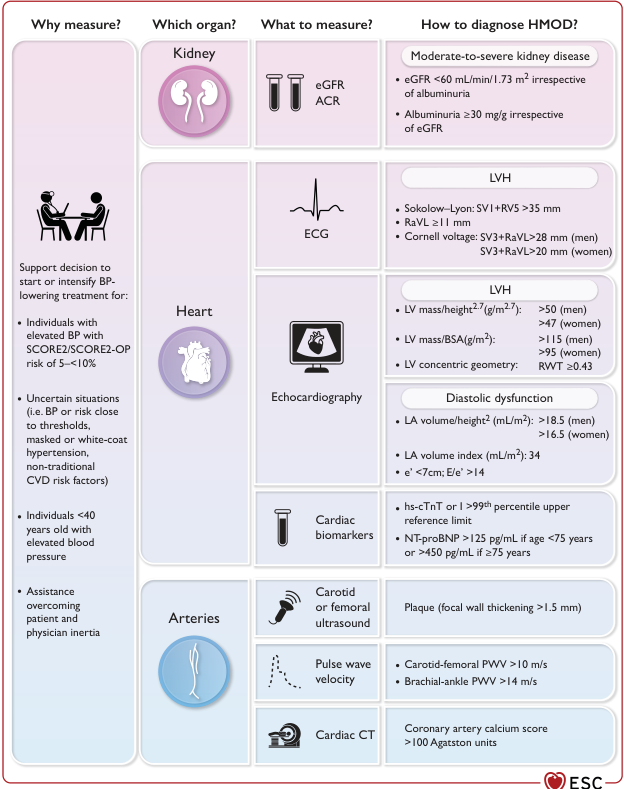
Summary : This figure provides a structured overview of how to measure and diagnose hypertension-mediated organ damage (HMOD) in the kidney, heart, and arteries, including what to measure, diagnostic criteria, and clinical indications for assessment. flowchart/table hybrid: # Why measure? : • Support decision to start or intensify blood pressure (BP)-lowering treatment for: – Individuals with elevated BP and SCORE2/SCORE2-OP risk of 5–<10% – Uncertain situations (BP/risk close to thresholds, masked/white-coat hypertension, non-traditional CVD risk factors) – Individuals <40 years old with elevated BP – Assistance overcoming patient/physician inertia # Which organ? : • Kidney • Heart • Arteries # What to measure? : ## Kidney : • eGFR (estimated glomerular filtration rate) • ACR (albumin-to-creatinine ratio) ## Heart : • ECG • Echocardiography • Cardiac biomarkers ## Arteries : • Carotid or femoral ultrasound • Pulse wave velocity • Cardiac CT # How to diagnose HMOD? : ## Kidney : • Moderate-to-severe kidney disease: – eGFR <60 mL/min/1.73 m² (irrespective of albuminuria) – Albuminuria ≥30 mg/g (irrespective of eGFR) ## Heart : • LVH (left ventricular hypertrophy) by ECG: – Sokolow–Lyon: SV1+RV5 >35 mm – RaVL ≥11 mm – Cornell voltage: SV3+RaVL >28 mm (men), >20 mm (women) • LVH by echocardiography: – LV mass/height².⁷ (g/m².⁷): >50 (men), >47 (women) – LV mass/BSA (g/m²): >115 (men), >95 (women) – LV concentric geometry: RWT ≥0.43 • Diastolic dysfunction: – LA volume/height² (mL/m²): >18.5 (men), >16.5 (women) – LA volume index (mL/m²): 34 – e’ <7cm; E/e’ >14 • Cardiac biomarkers: – hs-cTnT or >99th percentile upper reference limit – NT-proBNP >125 pg/mL (<75 years) or >450 pg/mL (≥75 years) ## Arteries : • Carotid/femoral ultrasound: Plaque (focal wall thickening >1.5 mm) • Pulse wave velocity: – Carotid-femoral PWV >10 m/s – Brachial-ankle PWV >14 m/s • Cardiac CT: Coronary artery calcium score >100 Agatston units # Design Encodings : • Organ sections are colour-coded: kidney (purple), heart (light purple), arteries (blue). • Icons represent each organ and measurement modality. • Diagnostic criteria are listed in shaded boxes for each organ. # Layout : • Four main columns: Why measure?, Which organ?, What to measure?, How to diagnose HMOD? • Rows for kidney, heart, and arteries, each with corresponding measurements and criteria. # Analysis : • The figure provides a comprehensive, organ-based approach to diagnosing HMOD, with clear measurement modalities and diagnostic thresholds for kidney, heart, and arterial damage. • It highlights the importance of tailored assessment based on clinical context and risk, and provides actionable criteria for each organ system. • The use of colour and icons aids rapid identification of organ systems and measurement types.
Note: The "Mission Parichari" book is not available in this medical library's collection. The library searched does not contain that specific book. Below is a clear, simple explanation of hypertension based on authoritative medical textbooks (Textbook of Family Medicine 9e, Braunwald's Heart Disease, and ESC Guidelines).
Hypertension - A Simple Explanation
What Is Blood Pressure?
- Top number (Systolic) = pressure when the heart beats (pumping)
- Bottom number (Diastolic) = pressure when the heart is resting between beats
What Is Hypertension?
| Category | Systolic | Diastolic |
|---|---|---|
| Normal | Less than 120 | Less than 80 |
| Elevated | 120-129 | Less than 80 |
| Hypertension Stage 1 | 130-139 | 80-89 |
| Hypertension Stage 2 | 140 or above | 90 or above |
| Hypertensive Crisis | Over 180 | Over 120 |
Why Does It Happen? (Causes)
1. Primary (Essential) Hypertension - Most Common (90-95%)
- Getting older (arteries stiffen with age)
- Family history / genetics
- Too much salt in the diet (salt retains water, increases pressure)
- Obesity / overweight
- Physical inactivity
- Smoking and alcohol
- Stress
- Poor sleep
2. Secondary Hypertension - Less Common (5-10%)
- Kidney disease
- Hormonal disorders (thyroid problems, adrenal gland tumors)
- Certain medications (birth control pills, NSAIDs, steroids)
- Sleep apnea
Why Is It Called the "Silent Killer"?
- Headaches (usually at the back of the head)
- Dizziness
- Blurred vision
- Nose bleeds
What Happens If Untreated? (Complications)
| Organ | What Happens |
|---|---|
| Heart | Heart attack, heart failure, thickened heart muscle (LVH) |
| Brain | Stroke, memory loss, dementia |
| Kidneys | Kidney failure, protein in urine |
| Eyes | Retina damage, vision loss |
| Arteries | Hardening and narrowing (atherosclerosis) |
How Is It Treated?
Lifestyle Changes (First and Always)
- Reduce salt intake (less than 5-6 g/day)
- Exercise regularly - 30 minutes of walking, 5 days a week
- Lose weight if overweight
- Stop smoking and limit alcohol
- Eat more fruits, vegetables, less fatty food (DASH diet)
- Manage stress - yoga, meditation, good sleep
Medications (When lifestyle alone is not enough)
- ACE Inhibitors (e.g., Ramipril, Enalapril) - relax blood vessels; also protect the kidneys
- ARBs (e.g., Losartan) - similar to ACE inhibitors, good for diabetics
- Calcium Channel Blockers (e.g., Amlodipine) - relax and widen arteries
- Diuretics / "Water pills" (e.g., Hydrochlorothiazide) - remove excess salt and water
- Beta-Blockers (e.g., Atenolol) - slow the heart rate, reduce force of pumping
Key Points to Remember
- Hypertension = silent killer - no symptoms, but serious damage occurs slowly
- Normal BP = below 120/80; anything above 130/90 needs attention
- It is caused by a mix of lifestyle, genetics, and sometimes other diseases
- It is NOT curable but is very well controllable with lifestyle + medication
- Never stop medications without asking your doctor - even if you feel fine
- Check your blood pressure regularly at home or pharmacy
- Hypertension is the single biggest risk factor for heart attack and stroke worldwide
Explain in easy ways and simple way hypertension for norcer 11 with latest guidline
hypertension latest guidelines 2024 2025 JNC ESC classification treatment
hypertension classification blood pressure stages simple diagram
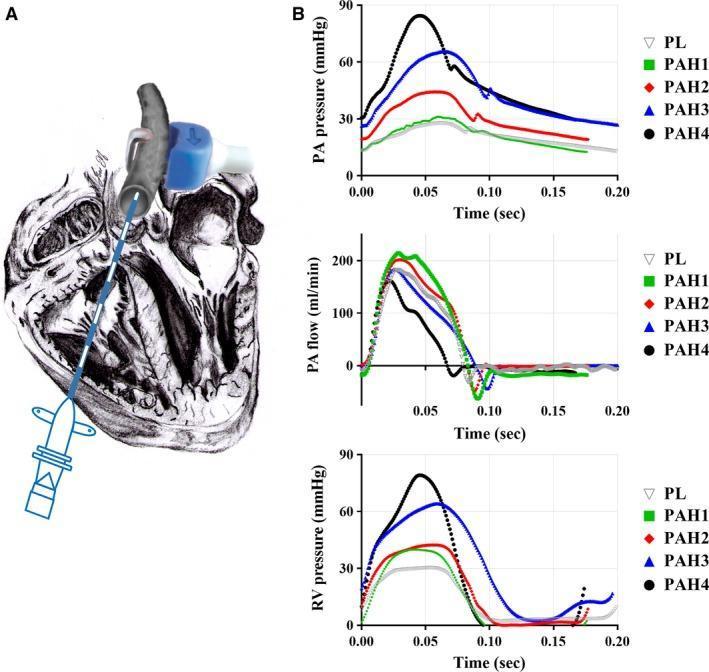
This composite educational graphic details in vivo hemodynamic measurement techniques and results in the context of pulmonary arterial hypertension (PAH). Panel A presents an anatomical diagram of a heart, illustrating the positioning of a dual pressure sensor catheter inserted through the right ventricle into the main pulmonary artery (MPA), complemented by an ultrasonic flow probe wrapped around the MPA. Panel B displays three time-series hemodynamic graphs (0.0 to 0.20 seconds) comparing a placebo (PL) control group with four progressive stages of PAH (PAH1-PAH4). The top graph shows MPA blood pressure (mmHg), demonstrating a progressive increase in peak systolic pressure and steeper systolic slopes as disease severity increases. The middle graph depicts MPA flow (ml/min), showing relatively stable peak flow across stages but altered waveform morphology. The bottom graph shows right ventricular (RV) pressure (mmHg), highlighting a significant rise in RV systolic pressure (RVSP) from ~30 mmHg in PL/PAH1 to nearly 80 mmHg in stage PAH4, indicating increased ventricular afterload and disease progression.
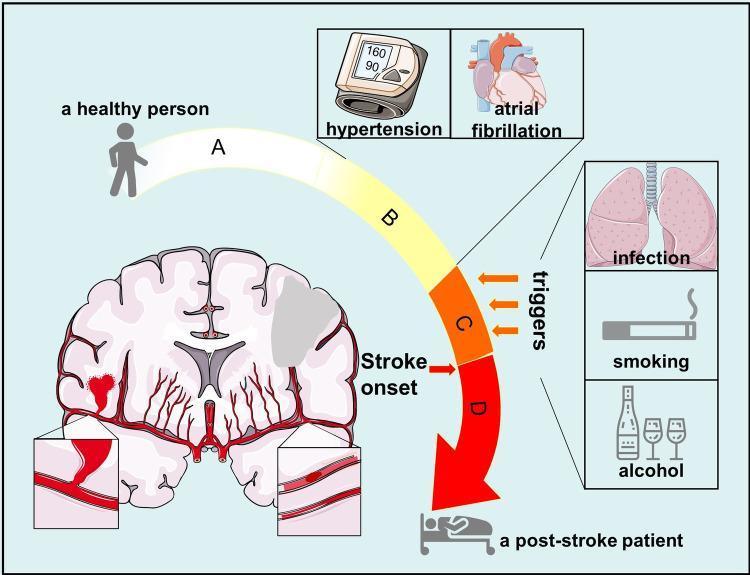
Educational pathophysiology diagram illustrating the progression from a healthy state to post-stroke status across four stages (A-D). Stage A represents a healthy individual with no chronic disease. Stage B depicts the accumulation of chronic risk factors, specifically hypertension (shown with a blood pressure monitor reading 160/90) and atrial fibrillation (illustrated by a heart diagram). Stage C describes a 'stroke-prone status' where external acute triggers, represented by icons for lung infection, smoking, and alcohol consumption, act upon existing risk factors. The final stage D represents the post-stroke state, symbolized by a patient in a hospital bed. Central to the diagram is a coronal cross-section of the human brain showing pathological changes: the right hemisphere contains a gray ischemic or infarcted area, and the left hemisphere depicts a hemorrhagic event. Zoomed insets highlight vascular pathologies, including a vessel rupture with active bleeding and an intraluminal thrombus or embolism. This infographic serves as a conceptual model for stroke risk accumulation and the transition from chronic pathology to acute cerebrovascular events.
Summary : This diagram illustrates the protocol for diagnosing hypertension using home blood pressure monitoring (HBPM), specifying the threshold for hypertension and the recommended measurement procedure. flowchart: # Nodes : • "Hypertension: average HBPM ≥135/85 mmHg" (hexagon) • House icon (represents home measurement) • "3" (circle, step number) • "2X" stopwatch icon (indicates two readings) • "Obtain two readings on each occasion, 1–2 min apart" (text) # Connectors : • Implied sequential flow from hypertension definition → home measurement → step 3 (obtain two readings). # Layout : • Left-to-right arrangement: hypertension threshold (left), home icon (center), step 3 instructions (right). • Visual icons supplement text for clarity. # Analysis : • The figure communicates that hypertension is defined as an average HBPM of ≥135/85 mmHg. • It instructs users to take two blood pressure readings at home on each occasion, spaced 1–2 minutes apart, as part of the diagnostic protocol. • The use of icons and step numbering enhances clarity and guides the user through the recommended measurement process.
hypertension treatment algorithm first line drugs antihypertensive
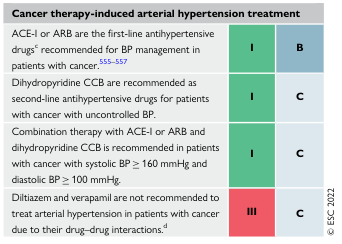
Cancer therapy-induced arterial hypertension treatment <table><thead><tr><th colspan="3">Cancer therapy-induced arterial hypertension treatment</th></tr></thead><tbody><tr><td>ACE-I or ARB are the first-line antihypertensive drugs<sup>c</sup> recommended for BP management in patients with cancer.<sup>555-557</sup></td><td>I</td><td>B</td></tr><tr><td>Dihydropyridine CCB are recommended as second-line antihypertensive drugs for patients with cancer with uncontrolled BP.</td><td>I</td><td>C</td></tr><tr><td>Combination therapy with ACE-I or ARB and dihydropyridine CCB is recommended in patients with cancer with systolic BP ≥ 160 mmHg and diastolic BP ≥ 100 mmHg.</td><td>I</td><td>C</td></tr><tr><td>Diltiazem and verapamil are not recommended to treat arterial hypertension in patients with cancer due to their drug–drug interactions.<sup>d</sup></td><td>III</td><td>C</td></tr></tbody></table> © ESC 2022
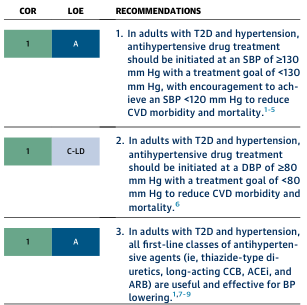
<table><thead><tr><th>COR</th><th>LOE</th><th>RECOMMENDATIONS</th></tr></thead><tbody><tr><td>1</td><td>A</td><td>1. In adults with T2D and hypertension, antihypertensive drug treatment should be initiated at an SBP of ≥130 mm Hg with a treatment goal of <130 mm Hg, with encouragement to achieve an SBP <120 mm Hg to reduce CVD morbidity and mortality.1-5</td></tr><tr><td>1</td><td>C-LD</td><td>2. In adults with T2D and hypertension, antihypertensive drug treatment should be initiated at a DBP of ≥80 mm Hg with a treatment goal of <80 mm Hg to reduce CVD morbidity and mortality.6</td></tr><tr><td>1</td><td>A</td><td>3. In adults with T2D and hypertension, all first-line classes of antihypertensive agents (ie, thiazide-type diuretics, long-acting CCB, ACEi, and ARB) are useful and effective for BP lowering.1,7-9</td></tr></tbody></table>
hypertension causes pathophysiology RAAS renin angiotensin simple
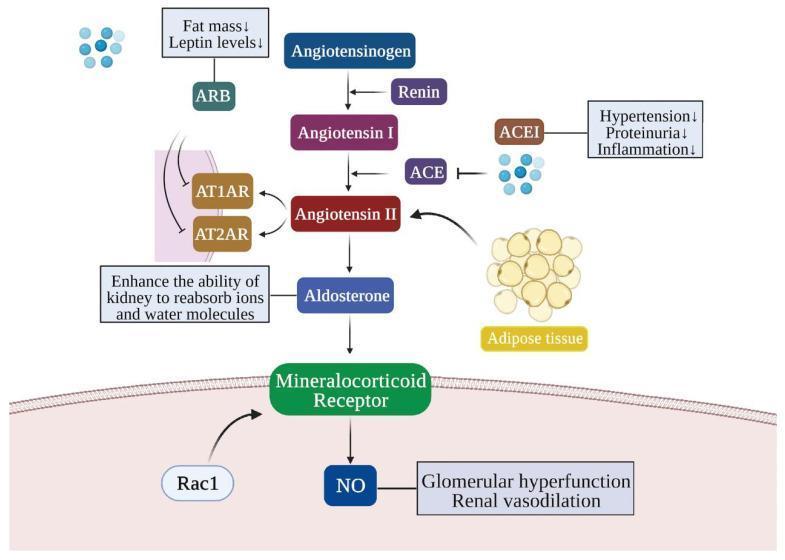
This pathophysiology diagram illustrates the Renin-Angiotensin-Aldosterone System (RAAS) pathway and its role in obesity-related kidney injury, highlighting pharmaceutical intervention points. The central pathway shows the enzymatic conversion of Angiotensinogen to Angiotensin I by Renin, and Angiotensin I to Angiotensin II via Angiotensin-Converting Enzyme (ACE). Angiotensin II acts on receptors AT1AR and AT2AR, facilitating kidney reabsorption of ions and water. The diagram specifically notes that adipose tissue contributes to increased Angiotensin II levels. Further down the cascade, Angiotensin II stimulates Aldosterone, which activates the Mineralocorticoid Receptor (supported by Rac1). This activation leads to the production of Nitric Oxide (NO), contributing to glomerular hyperfunction and renal vasodilation. Two major drug classes are highlighted: ACE Inhibitors (ACEI), which block the ACE enzyme to reduce hypertension, proteinuria, and inflammation; and Angiotensin Receptor Blockers (ARB), which inhibit AT1AR/AT2AR receptors and are associated with decreased fat mass and leptin levels.
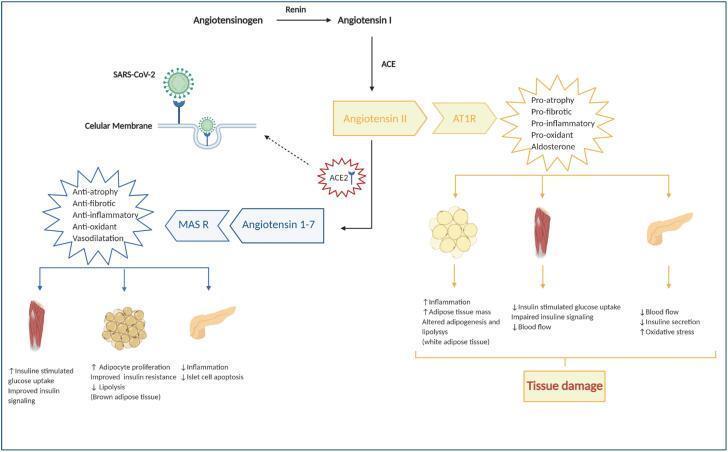
A pathophysiology diagram illustrating the Renin-Angiotensin-Aldosterone System (RAAS) and its deregulation in the context of COVID-19. The diagram outlines two competing metabolic pathways starting from Angiotensinogen. The primary pathway involves Renin converting Angiotensinogen to Angiotensin I, followed by ACE converting it to Angiotensin II. Binding of Angiotensin II to the AT1R receptor triggers pro-atrophy, pro-fibrotic, pro-inflammatory, and pro-oxidant effects, leading to tissue damage in white adipose tissue (increased inflammation and mass), skeletal muscle (impaired insulin signaling and blood flow), and the pancreas (reduced insulin secretion and blood flow). A counter-regulatory pathway shows ACE2 converting Angiotensin II into Angiotensin 1-7, which binds to the MAS receptor (MAS R) to produce protective anti-inflammatory, anti-fibrotic, and vasodilatory effects, improving insulin signaling in muscle and brown adipose tissue while reducing islet cell apoptosis in the pancreas. Critically, the diagram shows SARS-CoV-2 binding to the ACE2 receptor on the cellular membrane, inhibiting this protective pathway and shifting the balance toward tissue damage and systemic inflammation.
hypertension lifestyle modification diet exercise weight loss sodium restriction
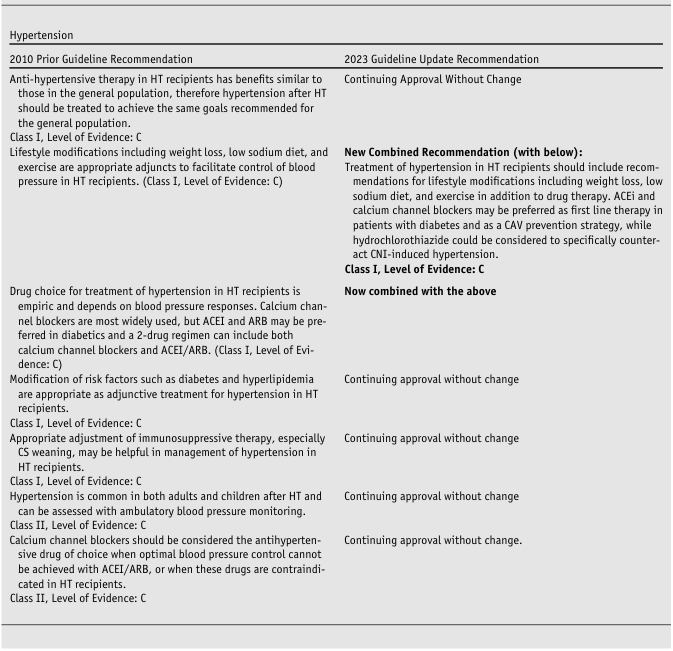
<table> <tr> <th>2010 Prior Guideline Recommendation</th> <th>2023 Guideline Update Recommendation</th> </tr> <tr> <td>Anti-hypertensive therapy in HT recipients has benefits similar to those in the general population, therefore hypertension after HT should be treated to achieve the same goals recommended for the general population.<br> Class I, Level of Evidence: C<br> Lifestyle modifications including weight loss, low sodium diet, and exercise are appropriate adjuncts to facilitate control of blood pressure in HT recipients. (Class I, Level of Evidence: C)</td> <td>Continuing Approval Without Change<br><br> <b>New Combined Recommendation (with below):</b><br> Treatment of hypertension in HT recipients should include recommendations for lifestyle modifications including weight loss, low sodium diet, and exercise in addition to drug therapy. ACEi and calcium channel blockers may be preferred as first line therapy in patients with diabetes and as a CAV prevention strategy, while hydrochlorothiazide could be considered to specifically counteract CNI-induced hypertension.<br> <b>Class I, Level of Evidence: C</b></td> </tr> <tr> <td>Drug choice for treatment of hypertension in HT recipients is empiric and depends on blood pressure responses. Calcium channel blockers are most widely used, but ACEI and ARB may be preferred in diabetics and a 2-drug regimen can include both calcium channel blockers and ACEI/ARB. (Class I, Level of Evidence: C)</td> <td><b>Now combined with the above</b></td> </tr> <tr> <td>Modification of risk factors such as diabetes and hyperlipidemia are appropriate as adjunctive treatment for hypertension in HT recipients.<br> Class I, Level of Evidence: C</td> <td>Continuing approval without change</td> </tr> <tr> <td>Appropriate adjustment of immunosuppressive therapy, especially CS weaning, may be helpful in management of hypertension in HT recipients.<br> Class I, Level of Evidence: C</td> <td>Continuing approval without change</td> </tr> <tr> <td>Hypertension is common in both adults and children after HT and can be assessed with ambulatory blood pressure monitoring.<br> Class II, Level of Evidence: C</td> <td>Continuing approval without change</td> </tr> <tr> <td>Calcium channel blockers should be considered the antihypertensive drug of choice when optimal blood pressure control cannot be achieved with ACEI/ARB, or when these drugs are contraindicated in HT recipients.<br> Class II, Level of Evidence: C</td> <td>Continuing approval without change.</td> </tr> </table>
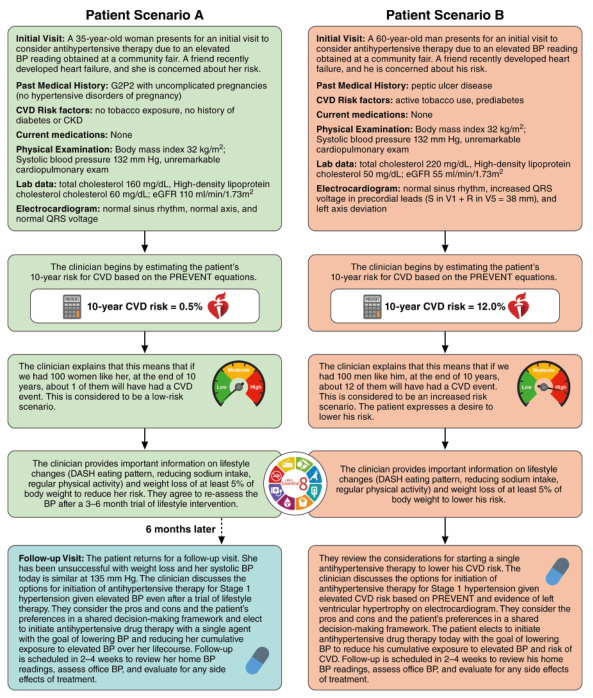
Summary : This figure presents two patient scenarios (A and B) for evaluating and managing cardiovascular disease (CVD) risk and hypertension, using a flowchart format to illustrate the clinical decision-making process, risk estimation, lifestyle intervention, and follow-up. flowchart: # Patient Scenario A : • Initial Visit (rectangle): 35-year-old woman, elevated BP, no hypertension in pregnancy, no CVD risk factors, normal exam and labs, 10-year CVD risk = 0.5%. • Risk Explanation (rectangle): Low risk; 1 in 100 women like her would have a CVD event in 10 years. • Lifestyle Advice (rectangle): DASH diet, reduce sodium, increase physical activity, lose ≥5% body weight; reassess BP after 3–6 months. • 6 Months Later (rectangle): Unsuccessful weight loss, BP still high, discuss antihypertensive therapy for Stage 1 hypertension, shared decision-making, follow-up in 2–4 weeks. # Patient Scenario B : • Initial Visit (rectangle): 60-year-old man, elevated BP, active tobacco use, prediabetes, peptic ulcer disease, abnormal ECG, 10-year CVD risk = 12.0%. • Risk Explanation (rectangle): Increased risk; 12 in 100 men like him would have a CVD event in 10 years. • Lifestyle Advice (rectangle): DASH diet, reduce sodium, increase physical activity, lose ≥5% body weight. • Therapy Decision (rectangle): Consider antihypertensive therapy for Stage 1 hypertension, shared decision-making, patient elects drug therapy, follow-up in 2–4 weeks. # Connectors : • Each scenario flows top-to-bottom: Initial Visit → Risk Explanation → Lifestyle Advice → Follow-up/Therapy Decision. • Arrows indicate sequential steps; no branching or loops. # Layout : • Two parallel columns (A on left, B on right), each with a vertical sequence of colored boxes. • Color coding: yellow for initial visit, pink/orange for risk explanation, green/blue for lifestyle/therapy, gray for follow-up. # Analysis : • The flowchart contrasts a low-risk (Scenario A) and high-risk (Scenario B) patient, showing how CVD risk estimation guides the intensity of intervention. • Both scenarios emphasize lifestyle modification, but only the higher-risk patient (B) proceeds directly to antihypertensive drug therapy. • Shared decision-making and follow-up are highlighted in both cases, with risk stratification central to management choices.
hypertension antihypertensive drug classes mechanism of action nursing
<table><thead><tr><th>COR</th><th>LOE</th><th>RECOMMENDATIONS</th></tr></thead><tbody><tr><td>1</td><td>A</td><td>1. In adults with T2D and hypertension, antihypertensive drug treatment should be initiated at an SBP of ≥130 mm Hg with a treatment goal of <130 mm Hg, with encouragement to achieve an SBP <120 mm Hg to reduce CVD morbidity and mortality.1-5</td></tr><tr><td>1</td><td>C-LD</td><td>2. In adults with T2D and hypertension, antihypertensive drug treatment should be initiated at a DBP of ≥80 mm Hg with a treatment goal of <80 mm Hg to reduce CVD morbidity and mortality.6</td></tr><tr><td>1</td><td>A</td><td>3. In adults with T2D and hypertension, all first-line classes of antihypertensive agents (ie, thiazide-type diuretics, long-acting CCB, ACEi, and ARB) are useful and effective for BP lowering.1,7-9</td></tr></tbody></table>
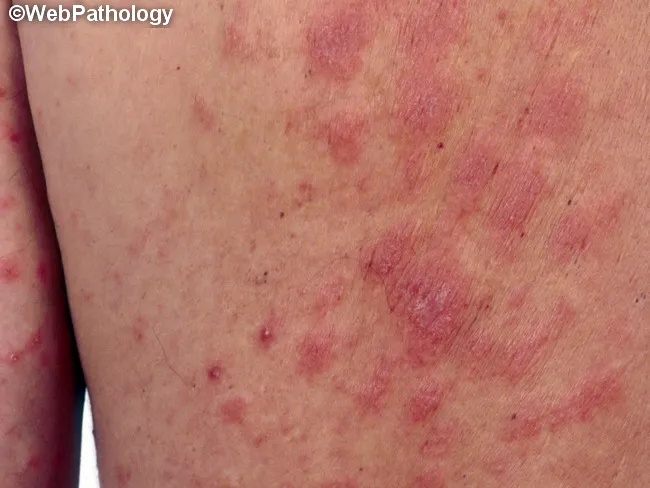
Clinical photography of a generalized morbilliform drug eruption on the skin illustrating an exanthematous eruption due to fosinopril, an ACE inhibitor prescribed for hypertension. The image depicts numerous erythematous macules and papules, some coalescing into diffuse patches on the trunk and proximal limbs, including the exposed upper arm. Lesions are blanching on pressure, non-vesicular, slightly raised, and pruritic in many patients. There is no mucosal involvement evident in this view. Morphology is stereotypical for a morbilliform eruption: symmetric distribution, rapid onset after drug exposure, and a proximal-to-distal spread pattern. The clinical context supports a cutaneous adverse drug reaction triggered by fosinopril, with timing typically 5–14 days after initiation or dose escalation, consistent with a type IV hypersensitivity mechanism. Diagnostic significance lies in recognizing drug-induced exanthem to prevent progression, guide drug withdrawal, and prompt substitution with an alternative antihypertensive (e.g., an ARB). Differential diagnoses include viral exanthem, allergic contact dermatitis, and pityriasis rosea; clinical correlation with medication history is essential. If biopsy is performed, histology would commonly show superficial perivascular lymphocytic infiltrate with eosinophils and mild spongiosis. This image is useful for clinical education, pharmacovigilance, and dermatology training on ACE inhibitor–related rashes and drug eruption management. Prompt action improves patient outcomes.
🩺 Hypertension - Simple & Easy Explanation for Nursing (NORCER 11)
Based on Latest Guidelines (ESC 2024 + AHA/ACC 2025)
1. What Is Blood Pressure? (The Basics)
| Number | Name | Meaning |
|---|---|---|
| Top number | Systolic BP | Pressure when the heart BEATS and pumps blood out |
| Bottom number | Diastolic BP | Pressure when the heart is RESTING between beats |
2. What Is Hypertension?
Hypertension = Persistently HIGH blood pressure
3. Classification of Blood Pressure - 2024 ESC Guidelines (LATEST)
| Category | Systolic (mmHg) | Diastolic (mmHg) |
|---|---|---|
| Optimal | < 120 | < 80 |
| Normal | 120-129 | 70-79 |
| Elevated BP (NEW category 2024) | 120-139 | 70-89 |
| Hypertension (Grade 1) | 140-159 | 90-99 |
| Hypertension (Grade 2) | 160-179 | 100-109 |
| Hypertension (Grade 3) | ≥ 180 | ≥ 110 |
Key 2024 update: A new "Elevated BP" category (120-139/70-89 mmHg) was added - aligning with US guidelines. This alerts clinicians early, before true hypertension develops.
4. How to Correctly Measure Blood Pressure (Nursing Skill)
- Patient should be seated, quiet, rested for 5 minutes
- No coffee, smoking, or exercise 30 minutes before
- Take 2 readings, 1-2 minutes apart and record the average
- Confirm with readings on 2-3 separate occasions before diagnosing hypertension
- Home BP threshold for hypertension = ≥ 135/85 mmHg (slightly lower than office)
5. Causes of Hypertension
Type 1 - Primary (Essential) Hypertension - 90-95% of cases
- Genetics / family history
- High salt diet
- Obesity
- Lack of exercise
- Smoking and alcohol
- Chronic stress
- Aging (arteries stiffen)
- Poor sleep / sleep apnea
Type 2 - Secondary Hypertension - 5-10% of cases
| Cause | Example |
|---|---|
| Kidney disease | Renal artery stenosis, CKD |
| Hormonal | Primary aldosteronism, Cushing's, Phaeochromocytoma |
| Thyroid | Hypothyroidism or Hyperthyroidism |
| Drugs | NSAIDs, oral contraceptives, steroids, decongestants |
| Sleep apnea | Obstructive sleep apnea |
6. Why Is It Called the "Silent Killer"?
- Headache (occipital - back of head)
- Blurred vision
- Dizziness
- Nosebleed (epistaxis)
- Shortness of breath
7. The Risk: Higher BP = Higher Mortality (Straight Line Relationship)
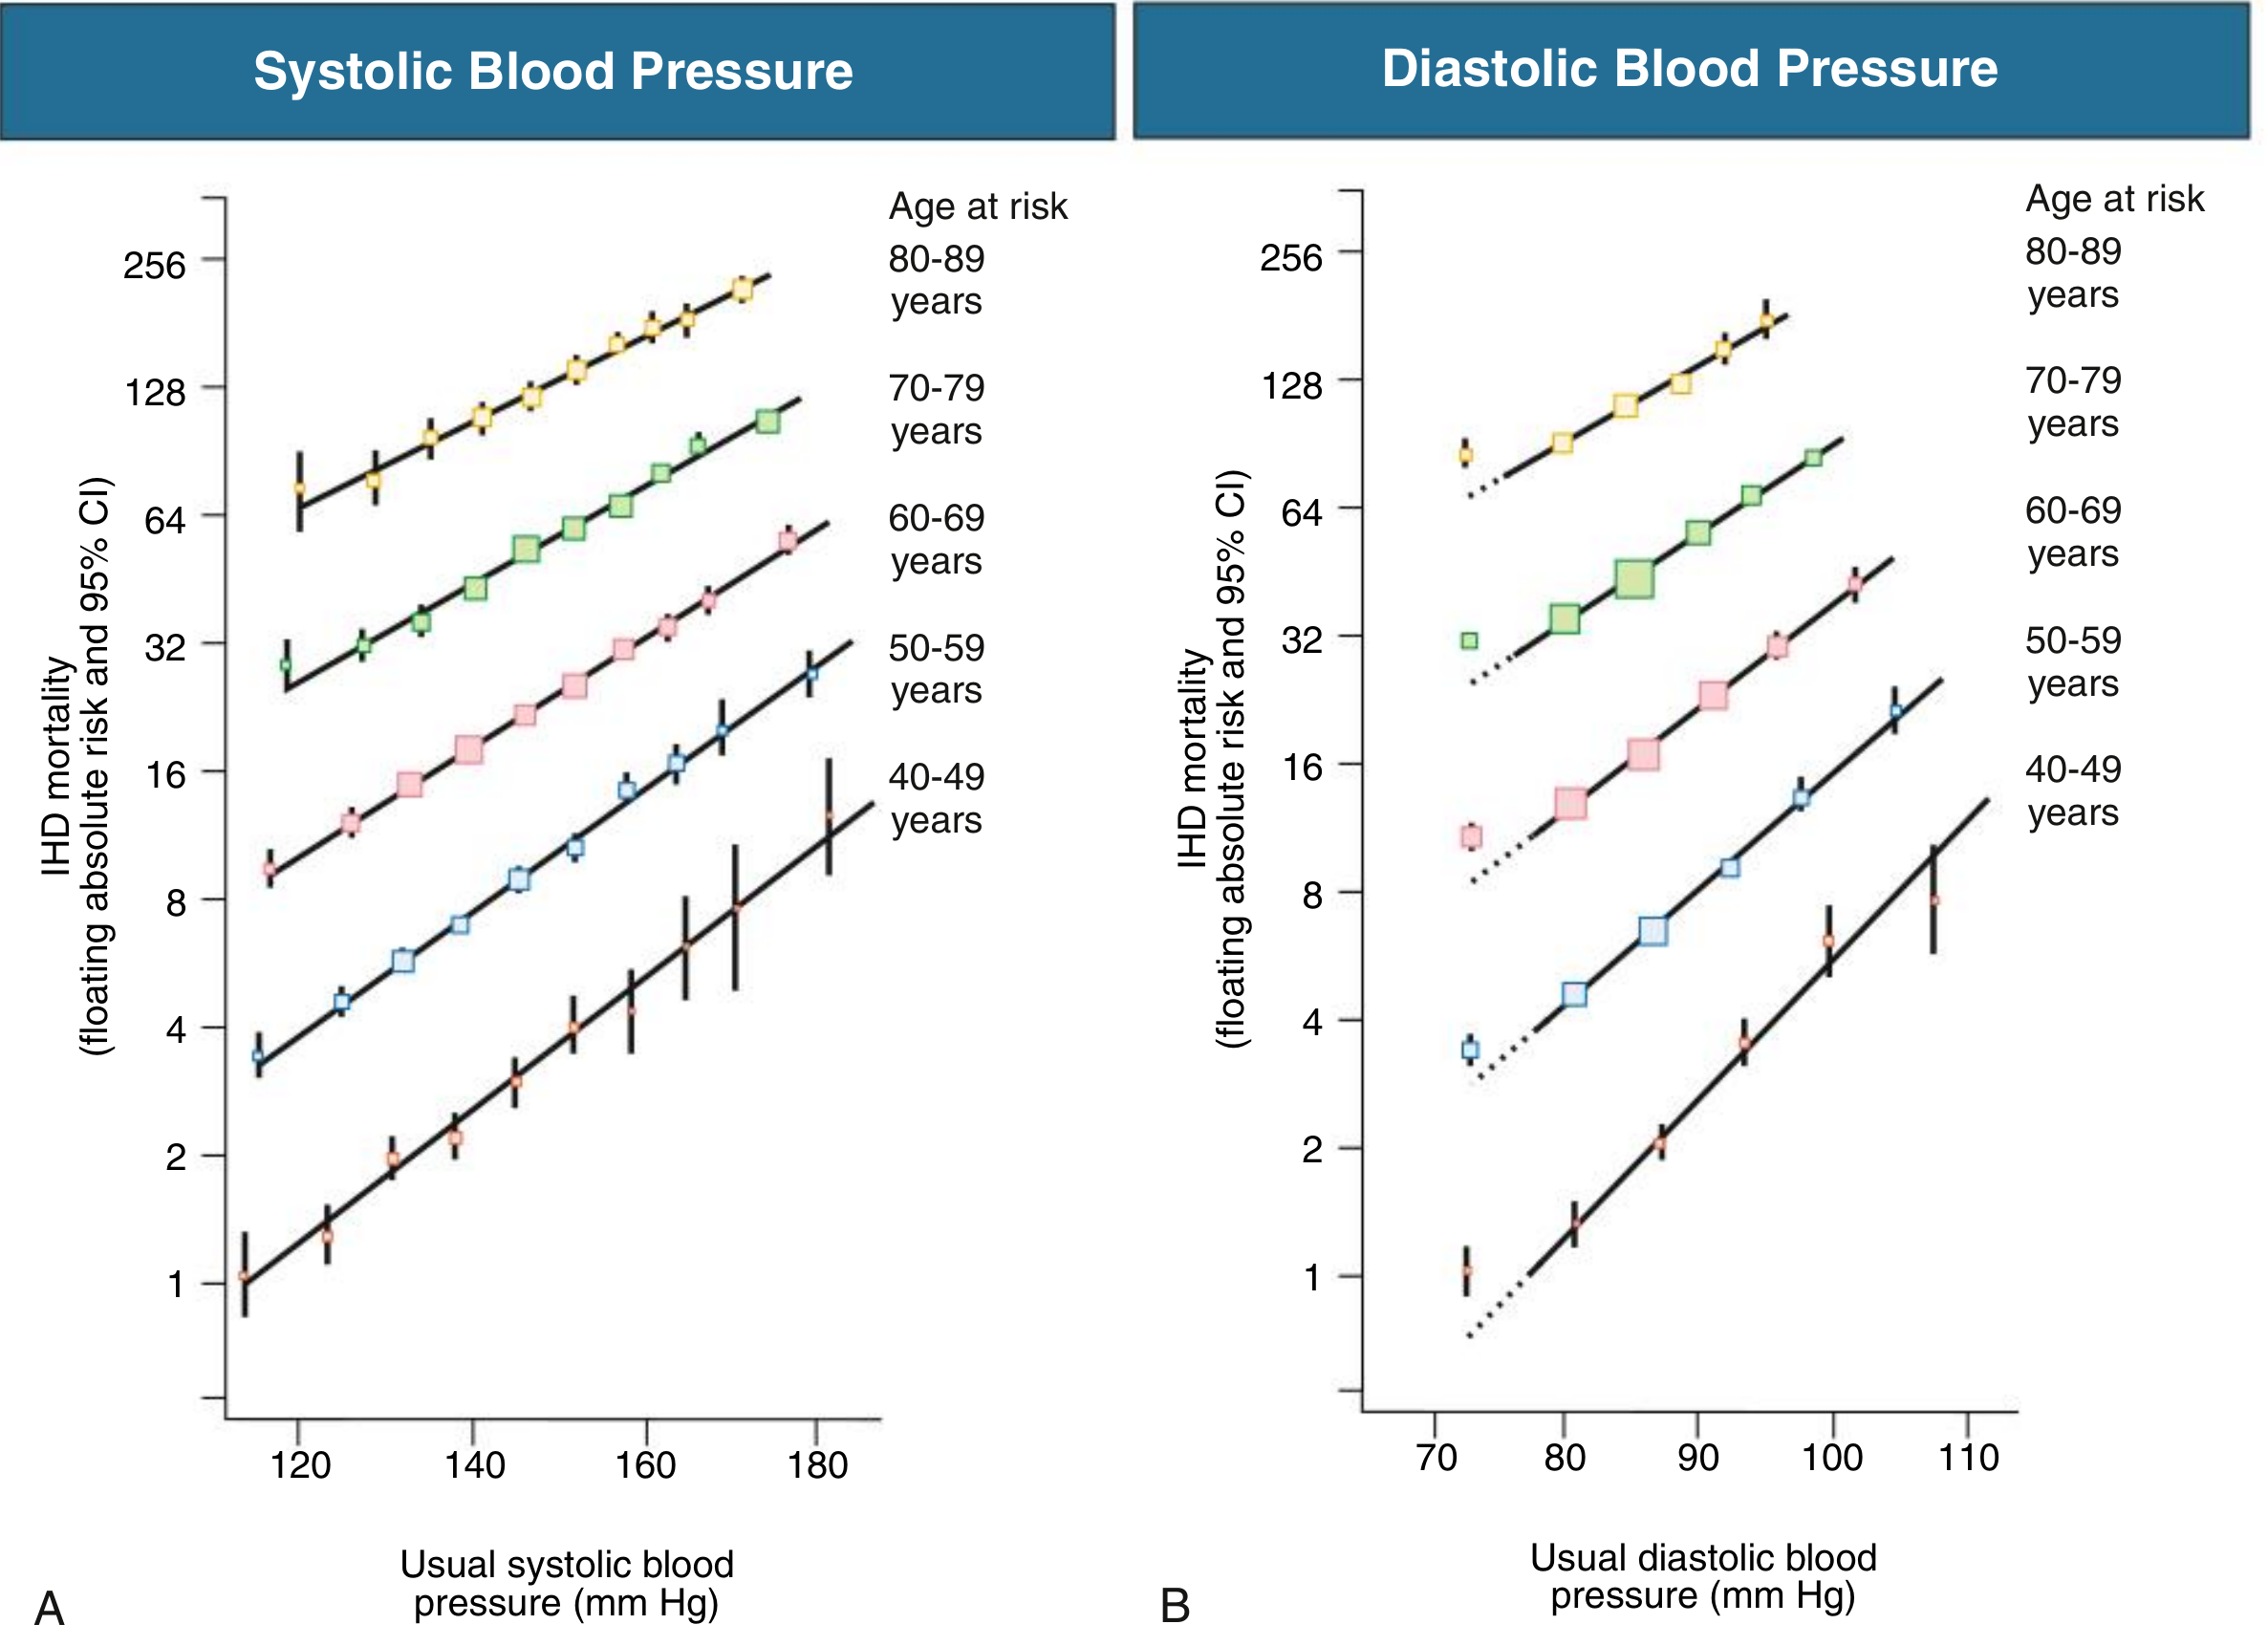
Key fact: Every 20 mmHg rise in systolic BP or 10 mmHg rise in diastolic BP doubles the risk of dying from heart disease or stroke.
8. Complications (What Happens If Untreated)
| Organ | Complication |
|---|---|
| Heart | Heart attack (MI), Left Ventricular Hypertrophy (LVH), Heart failure, Atrial fibrillation |
| Brain | Stroke (ischaemic or haemorrhagic), Vascular dementia, Cognitive impairment |
| Kidneys | Chronic kidney disease, Proteinuria, Kidney failure |
| Eyes | Hypertensive retinopathy, Vision loss |
| Arteries | Atherosclerosis, Arterial stiffness, Peripheral artery disease |
9. Management of Hypertension
A. Lifestyle Modifications (ALWAYS First - for Everyone)
| Intervention | What to do | BP Reduction |
|---|---|---|
| Reduce salt | Less than 5 g/day (1 teaspoon) | -5 to -6 mmHg |
| Exercise | 30 min aerobic exercise, 5 days/week | -4 to -5 mmHg |
| Weight loss | Lose at least 5% body weight | -1 mmHg per kg lost |
| DASH diet | More fruits, vegetables, less saturated fat | -8 to -11 mmHg |
| Stop smoking | Complete cessation | Reduces overall CV risk |
| Limit alcohol | Men: ≤2 drinks/day, Women: ≤1 drink/day | -3 to -4 mmHg |
| Stress reduction | Yoga, meditation, adequate sleep | Variable |
2024 ESC guideline: For elevated BP (120-139/70-89), try lifestyle changes for 3-6 months before starting medication if low-risk.
B. Drug Treatment (Pharmacological)
- Low-to-moderate CV risk: Start drugs if BP remains ≥ 140/90 mmHg after lifestyle changes
- High CV risk (diabetes, CKD, CVD): Start drugs if BP ≥ 130/80 mmHg
| Drug Class | Example | How It Works (Simple) |
|---|---|---|
| ACE Inhibitors (ACEi) | Ramipril, Enalapril | Block a hormone (angiotensin) that tightens vessels - vessels relax |
| ARBs | Losartan, Valsartan | Same as ACEi but different mechanism; used if ACEi causes cough |
| Calcium Channel Blockers (CCB) | Amlodipine | Block calcium entry into vessel muscle - vessels dilax and widen |
| Thiazide Diuretics | Hydrochlorothiazide, Chlorthalidone | Act on kidneys to remove extra salt and water - reduces blood volume |
Note: About 2/3 of patients need 2 or more drugs to reach BP target. This is normal and expected.
- Diabetes + Hypertension: ACEi or ARB preferred (also protect kidneys)
- CKD + Hypertension: ACEi or ARB first; target BP < 130/80 mmHg
- Heart failure: ACEi/ARB + beta-blocker + diuretic
- Elderly: Start with low doses; check standing BP (risk of falls)
10. BP Targets (Latest 2024/2025 Guidelines)
| Patient Group | Target BP |
|---|---|
| General adults (low-moderate risk) | < 140/90 mmHg |
| High CV risk / Diabetes / CKD | < 130/80 mmHg |
| Ideal target (if tolerated) | 120-129 / 70-79 mmHg |
| Elderly ≥ 75 years | 130-139 mmHg systolic (avoid too low) |
| Pregnant women | 110-139 / 81-85 mmHg |
11. Hypertensive Emergency vs. Urgency (Nursing Must-Know)
| Hypertensive Urgency | Hypertensive Emergency | |
|---|---|---|
| BP | > 180/120 mmHg | > 180/120 mmHg |
| Organ Damage | NO | YES (brain, heart, kidneys) |
| Symptoms | Severe headache, anxiety | Chest pain, stroke, confusion, blurred vision, pulmonary oedema |
| Setting | Can be managed in clinic | ICU admission required |
| Treatment | Oral drugs, gradual reduction | IV medications, controlled BP reduction |
Warning: Do NOT lower BP too fast in emergency - can cause stroke or MI from reduced organ perfusion.
12. Key Nursing Responsibilities
- Measure BP accurately - correct cuff size, patient seated, two readings
- Educate patient on lifestyle changes (diet, exercise, salt reduction)
- Medication adherence - never stop antihypertensives abruptly
- Monitor side effects - ACEi causes dry cough, diuretics cause electrolyte loss
- Teach self-monitoring at home (target ≥ 135/85 = hypertension at home)
- Recognize hypertensive emergency - immediate medical escalation
- Regular follow-up - BP, kidney function (creatinine/eGFR), electrolytes
Quick Memory Summary
HYPERTENSION = BP stays too HIGH → damages vessels silently

Normal: < 120/80
Hypertension: ≥ 140/90 (or ≥ 130/80 in high-risk patients)

Causes: Salt, Obesity, Stress, Genetics, Kidney disease
Silent Killer: NO symptoms usually

Complications: Heart attack | Stroke | Kidney failure | Blindness

Treatment:
  STEP 1: Lifestyle (DASH diet, exercise, less salt, no smoking)
  STEP 2: Drugs (ACEi / ARB / CCB / Diuretic)

Target: < 130/80 mmHg in most patients (2024 ESC / 2025 AHA/ACC)