oxygen and carbondiovide transport physiology allied science assay
Reading File
Finding Sources
Finding Sources
Reading File
Reading File
Reading File
Reading File
Reading File
Searching Images
oxygen-hemoglobin dissociation curve
Searching Images
carbon dioxide transport bicarbonate chloride shift RBC
Reading File
Loading Image
Reading File
Loading Image
Reading File
I now have all the content needed to produce a comprehensive, well-structured answer. Let me compile everything.
Oxygen and Carbon Dioxide Transport Physiology
1. Overview
Gas transport depends on two mechanisms working together: diffusion (driven by partial pressure gradients) and blood flow (cardiac output). Hemoglobin increases O₂-carrying capacity ~70-fold and CO₂-handling reactions increase CO₂ transport ~17-fold compared to simple dissolution alone.
"The presence of hemoglobin increases the O₂-carrying capacity of the blood 70-fold, and the reactions of CO₂ increase the blood CO₂ content 17-fold." — Ganong's Review of Medical Physiology, 26th Ed.
2. Oxygen Transport
2.1 Forms of O₂ in Blood
O₂ is carried in two forms:
| Form | % of Total O₂ | Key Points |
|---|---|---|
| Dissolved O₂ | ~2% | Obeys Henry's Law: concentration = PO₂ × 0.003 mL/100 mL/mmHg; only dissolved O₂ creates partial pressure and drives diffusion |
| Bound to Hemoglobin (HbO₂) | ~98% | Reversible binding; far greater capacity |
Why dissolved O₂ alone is insufficient: At a normal PaO₂ of 100 mmHg, dissolved O₂ = only 0.3 mL/100 mL blood. At rest, O₂ demand is ~250 mL/min; dissolved O₂ alone delivers only ~15 mL/min (cardiac output 5 L/min × 0.3 mL/100 mL). — Costanzo Physiology, 7th Ed.
2.2 Hemoglobin Structure and O₂ Binding
- Hemoglobin (Hb) is a globular protein with 4 subunits; each contains a heme moiety (iron-binding porphyrin ring with Fe²⁺) and a polypeptide chain (α or β)
- Adult Hb (HbA) = α₂β₂
- Each subunit binds one O₂ molecule → total: 4 O₂ per Hb molecule
- The Fe²⁺ remains ferrous (Fe²⁺); the reaction is oxygenation, not oxidation
Cooperative binding (T→R transition):
- Deoxygenated Hb = tense (T) configuration → low O₂ affinity
- When first O₂ binds, bonds break → relaxed (R) configuration → exposes more binding sites → 500-fold increase in affinity
- This cooperativity produces the characteristic sigmoid-shaped O₂-Hb dissociation curve
Sequential binding reactions:
Hb₄ + O₂ ⇌ Hb₄O₂
Hb₄O₂ + O₂ ⇌ Hb₄O₄
Hb₄O₄ + O₂ ⇌ Hb₄O₆
Hb₄O₆ + O₂ ⇌ Hb₄O₈
— Ganong's Review of Medical Physiology, 26th Ed.
2.3 Oxygen–Hemoglobin Dissociation Curve
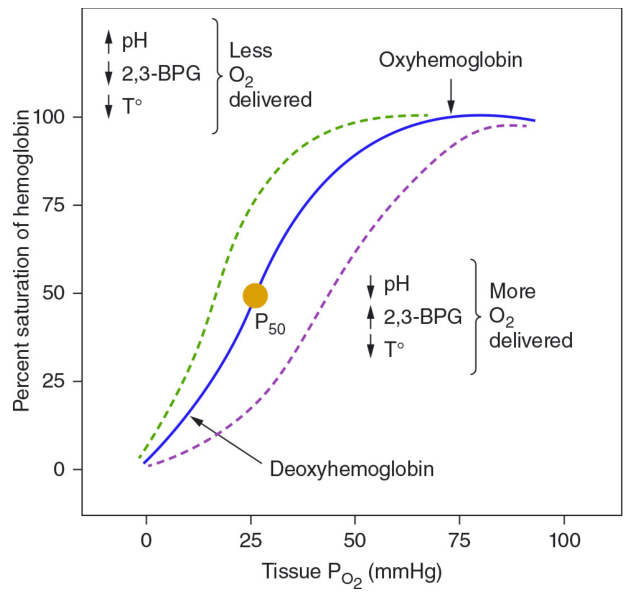
Key values:
- P₅₀ = PO₂ at which Hb is 50% saturated = ~26 mmHg (normal)
- Normal arterial PO₂ = 100 mmHg → SaO₂ ~97–98%
- Normal venous PO₂ = 40 mmHg → SvO₂ ~75%
Factors shifting the curve:
| Shift | Direction | Factors | Effect |
|---|---|---|---|
| Left (↑ affinity, ↓ P₅₀) | ← | ↑ pH, ↓ PCO₂, ↓ temperature, ↓ 2,3-DPG | Less O₂ delivered to tissues |
| Right (↓ affinity, ↑ P₅₀) | → | ↓ pH, ↑ PCO₂, ↑ temperature, ↑ 2,3-DPG | More O₂ delivered to tissues |
Bohr Effect: CO₂ and H⁺ (↓ pH) cause a right shift — promotes O₂ unloading in metabolically active tissues.
2,3-Diphosphoglycerate (2,3-DPG):
- Generated in RBCs via glycolysis
- Binds to deoxyhemoglobin, stabilizing the T-state → right shift
- Elevated in: anemia, chronic hypoxia, high altitude → facilitates O₂ delivery
- Decreased in: stored blood (old bank blood loses 2,3-DPG) → left shift, impaired O₂ delivery
Fetal Hemoglobin (HbF):
- γ chains replace β chains; γ chains bind 2,3-DPG poorly → left shift relative to adult HbA
- Higher O₂ affinity facilitates O₂ transfer from maternal to fetal circulation
2.4 Oxygen Delivery (DO₂)
DO₂ = Cardiac Output (CO) × Arterial O₂ Content (CaO₂)
CaO₂ = (Hb × 1.34 × SaO₂) + (PaO₂ × 0.003)
Where 1.34 mL O₂/g Hb = O₂-carrying capacity of each gram of hemoglobin.
DO₂ depends on:
- Amount of O₂ entering the lungs
- Adequacy of pulmonary gas exchange
- Blood flow (cardiac output)
- O₂-carrying capacity of blood (Hb concentration + affinity)
2.5 Oxygen Delivery in the Pulmonary Capillary
- Alveolar PO₂ ≈ 104 mmHg; Mixed venous PO₂ ≈ 40 mmHg
- Initial diffusion gradient = 104 − 40 = 64 mmHg
- Blood equilibrates with alveolar gas within the first third of the pulmonary capillary
- During exercise, diffusing capacity increases ~3-fold (more capillary surface area, better V/Q matching)
2.6 Myoglobin
- Found in skeletal muscle; resembles Hb but binds 1 O₂ per molecule (no cooperative binding)
- Dissociation curve = hyperbola (not sigmoid), shifted left relative to Hb → higher O₂ affinity
- Stores O₂ in muscle; releases it only at very low PO₂ (e.g., during intense exercise when blood flow is compressed)
3. Carbon Dioxide Transport
3.1 Forms of CO₂ in Blood
CO₂ is carried in three forms:
| Form | % of Total CO₂ | Notes |
|---|---|---|
| Dissolved CO₂ | ~5% | Solubility = 0.07 mL/100 mL/mmHg (20× more soluble than O₂) |
| Carbaminohemoglobin | ~3% | CO₂ bound to terminal amino groups on Hb (different site from O₂) |
| Bicarbonate (HCO₃⁻) | >90% | The dominant form; produced inside RBCs |
"By far, HCO₃⁻ is quantitatively the most important of these forms." — Costanzo Physiology, 7th Ed.
3.2 Bicarbonate Formation – The Key Reaction
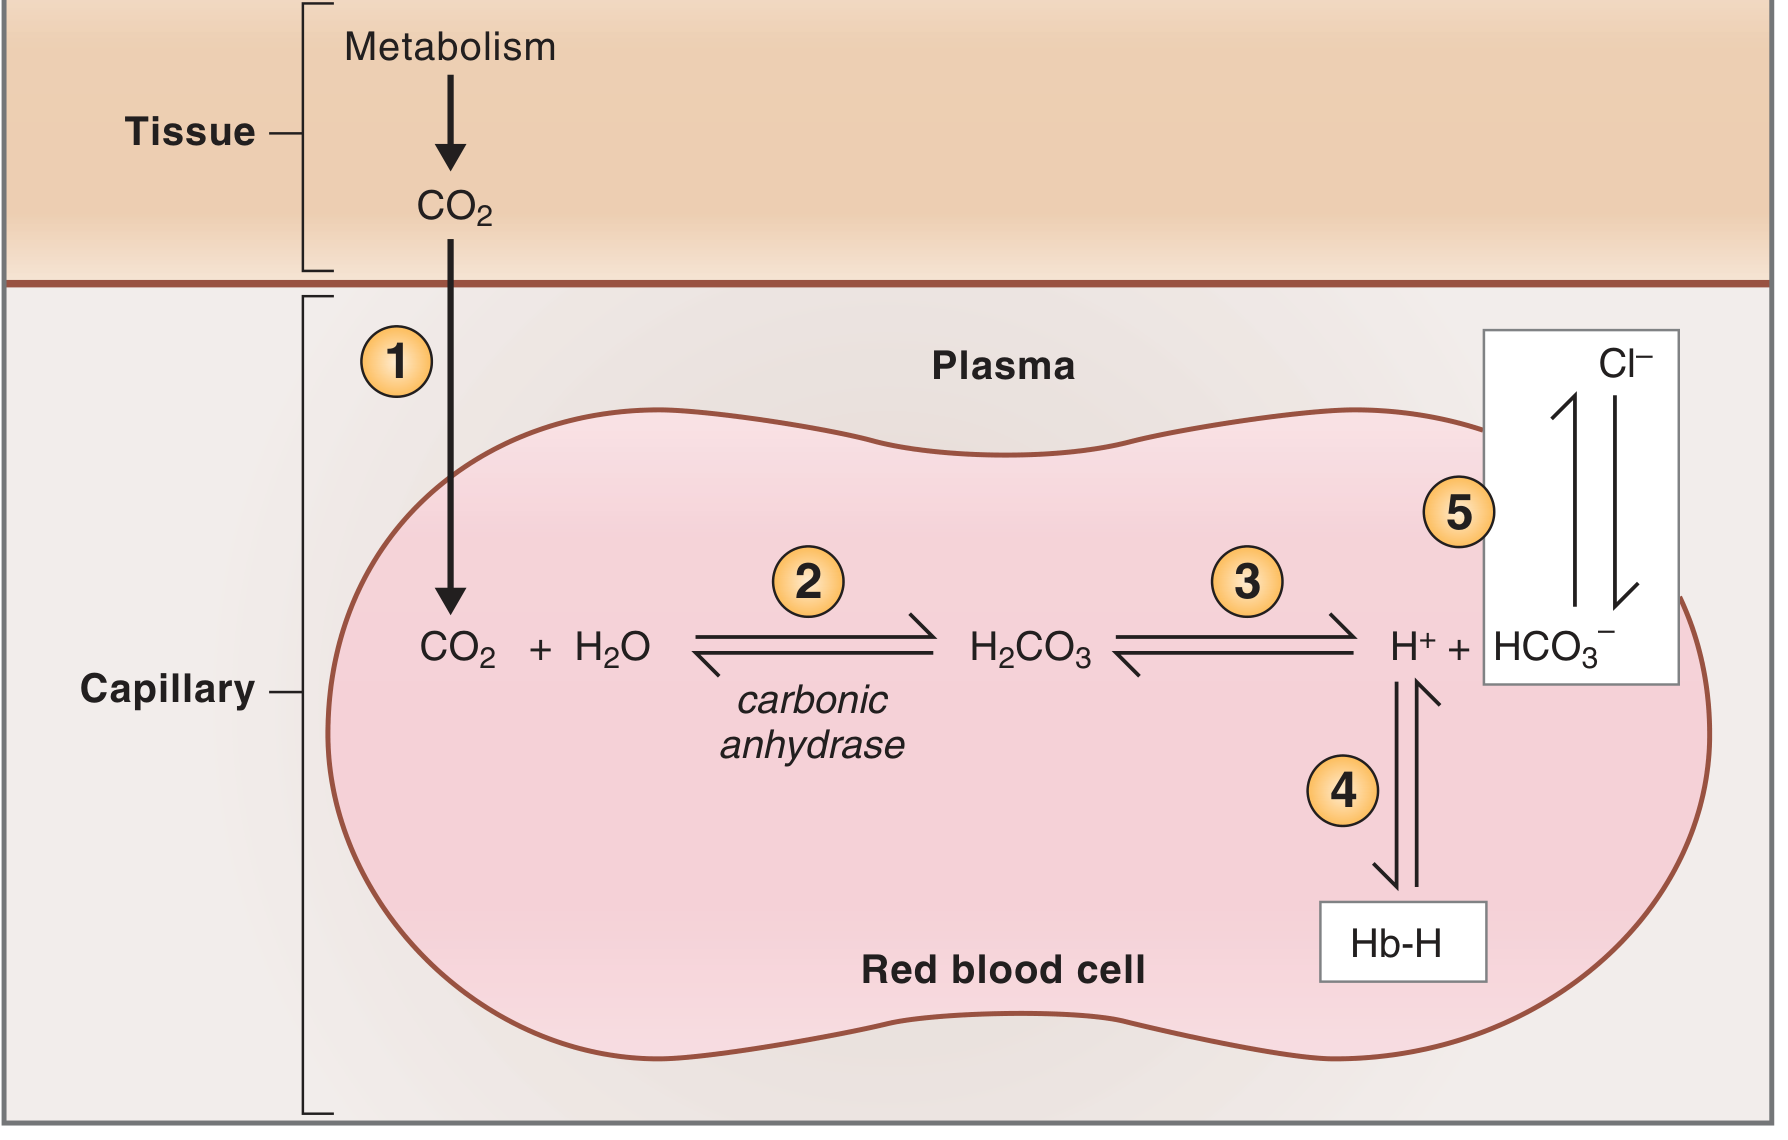
Step-by-step in systemic capillaries (tissue level):
- CO₂ produced by aerobic tissue metabolism; diffuses down its partial pressure gradient into the RBC
- Inside the RBC, carbonic anhydrase catalyzes: CO₂ + H₂O ⇌ H₂CO₃ (extremely fast)
- H₂CO₃ dissociates: H₂CO₃ ⇌ H⁺ + HCO₃⁻
- H⁺ is buffered by deoxyhemoglobin inside the RBC (forms Hb-H); deoxyhemoglobin is a better H⁺ buffer than oxyhemoglobin — convenient because Hb has already given up its O₂ to the tissues
- HCO₃⁻ is exchanged for Cl⁻ across the RBC membrane via the band 3 anion exchanger protein → this is the Chloride Shift (Hamburger shift). HCO₃⁻ then travels in plasma to the lungs
In the lungs — all reactions reverse:
- HCO₃⁻ re-enters RBCs (Cl⁻ exits)
- H⁺ released from Hb, recombines with HCO₃⁻ → H₂CO₃ → CO₂ + H₂O
- CO₂ is expired
— Costanzo Physiology, 7th Ed.
3.3 The Haldane Effect
Definition: Deoxygenation of hemoglobin increases its affinity for CO₂ (as carbaminohemoglobin) and also increases its capacity to buffer H⁺.
- In tissues: Hb releases O₂ → becomes deoxyhemoglobin → binds more CO₂ and buffers more H⁺ → facilitates CO₂ loading
- In lungs: Hb binds O₂ → affinity for CO₂ falls → CO₂ is released → expired
The Haldane and Bohr effects are complementary and mutually reinforcing:
- Bohr effect: rising CO₂/H⁺ in tissues → Hb unloads O₂ more readily
- Haldane effect: deoxygenated Hb → better CO₂ carrier and H⁺ buffer
3.4 CO₂ Dissociation Curve
Unlike the O₂–Hb dissociation curve, the CO₂ dissociation curve is nearly linear over the physiological range:
- Venous blood PCO₂ ≈ 46 mmHg, CO₂ content ~52 mL/100 mL
- Arterial blood PCO₂ ≈ 40 mmHg, CO₂ content ~48 mL/100 mL
- ~4 mL CO₂/100 mL blood is exchanged per cycle
4. Key Clinical and Allied Science Pearls
| Concept | Key Point |
|---|---|
| Cyanosis | Appears when reduced Hb in capillaries >5 g/dL; most visible in nail beds, lips, mucous membranes |
| Carbon monoxide poisoning | CO has ~250× higher affinity for Hb than O₂; shifts curve left (impairs O₂ unloading); treatment = 100% O₂ |
| Anemia | Reduces CaO₂ despite normal PaO₂ and saturation; 2,3-DPG rises to compensate |
| High altitude | Reduced alveolar PO₂ → slower O₂ equilibration along pulmonary capillary; compensated by ↑ RBC/Hb and ↑ 2,3-DPG |
| Pulse oximetry | Measures SaO₂ (not PaO₂); falsely elevated in CO poisoning |
| Carbonic anhydrase inhibitors (e.g., acetazolamide) | Block CO₂→HCO₃⁻ conversion; used at altitude (stimulates ventilation via metabolic acidosis) |
| Banked blood | Low 2,3-DPG → left-shifted curve → impaired O₂ delivery; replenished after transfusion in ~24 h |
Summary Diagram
LUNGS                           TISSUES
Alveolar PO₂ 104 mmHg          Tissue PO₂ 40 mmHg
       │ O₂ diffuses in              │ O₂ diffuses out
       │                             │
Hb + O₂ → HbO₂              HbO₂ → Hb + O₂
(loading)                    (unloading – Bohr effect)

Alveolar PCO₂ 40 mmHg         Tissue PCO₂ 46 mmHg
       │ CO₂ diffuses out           │ CO₂ diffuses in
       │                            │
HCO₃⁻ → CO₂ (expired)     CO₂ → HCO₃⁻ (chloride shift)
                            CO₂ + Hb → HbCO₂ (Haldane effect)
Sources:
- Costanzo Physiology, 7th Edition, pp. 223–231
- Ganong's Review of Medical Physiology, 26th Edition, pp. 641–643
- Guyton and Hall Textbook of Medical Physiology, pp. 2614–2619
- Harrison's Principles of Internal Medicine, 21st Edition, p. 2909
This is a shared conversation. Sign in to Orris to start your own chat.