
Stroke mri findings
Stroke mri findings
stroke MRI DWI diffusion weighted imaging acute infarct
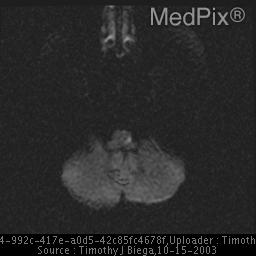
**Medical Image Description**
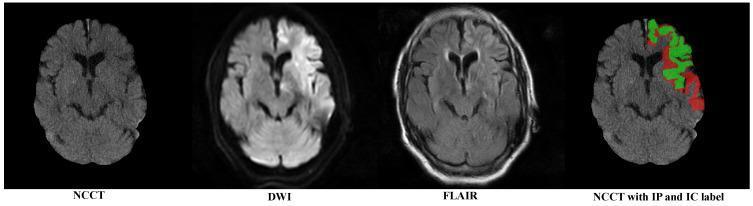
A multi-modal comparison of brain imaging from a patient with an acute ischemic stroke, featuring four axial views: Non-Contrast Computed Tomography (NCCT) with skull removal, Diffusion-Weighted Imaging (DWI), Fluid-Attenuated Inversion Recovery (FLAIR), and a labeled NCCT. The image demonstrates a clear clinicoradiological mismatch. The DWI modality reveals a distinct area of hyperintensity in the left hemisphere, signifying cytotoxic edema and the restricted diffusion characteristic of an acute infarct. In contrast, the FLAIR sequence shows minimal signal changes in the corresponding area, suggesting a 'DWI-FLAIR mismatch' indicative of hyperacute stroke within the thrombolysis window. The final panel displays the NCCT with manual segmentations: the 'Infarct Core' (IC) is highlighted in green, while the surrounding 'Infarct Penumbra' (IP) is highlighted in red. This comparison highlights the difficulty of visualizing early ischemic changes on NCCT compared to the sensitivity of MRI sequences, emphasizing the role of automated segmentation in identifying salvageable brain tissue.
![This diagnostic image set consists of four axial MRI sequences (A: T1-weighted, B: T2-weighted, C: Diffusion-weighted Imaging [DWI], and D: Apparent Diffusion Coefficient [ADC] map) of the human brain. The images demonstrate a large acute ischemic infarct in the left middle cerebral artery (MCA) territory, specifically involving the left parietal region. Key visual findings include: (A) T1 sequence showing an isointense signal with subtle effacement of cortical sulci; (B) T2 sequence displaying a distinct hyperintense (bright) signal indicating cytotoxic edema; (C) DWI sequence showing intense hyperintensity, signifying restricted water diffusion characteristic of acute ischemia; and (D) ADC map showing a corresponding hypointense (dark) signal, confirming that the DWI hyperintensity represents true restricted diffusion rather than T2 shine-through. The infarct demonstrates mass effect with partial effacement of the ipsilateral lateral ventricle. This comparison set is an educational tool for identifying the radiological evolution and multi-sequence presentation of acute stroke in neuroradiology.](https://cdn.orris.care/cdss_images/pmc_clinical_VQA_0fbdee789a4b391597c56b5bfae64b20151ef58bdc5d6af91ee1adfd74232483.jpg)
This diagnostic image set consists of four axial MRI sequences (A: T1-weighted, B: T2-weighted, C: Diffusion-weighted Imaging [DWI], and D: Apparent Diffusion Coefficient [ADC] map) of the human brain. The images demonstrate a large acute ischemic infarct in the left middle cerebral artery (MCA) territory, specifically involving the left parietal region. Key visual findings include: (A) T1 sequence showing an isointense signal with subtle effacement of cortical sulci; (B) T2 sequence displaying a distinct hyperintense (bright) signal indicating cytotoxic edema; (C) DWI sequence showing intense hyperintensity, signifying restricted water diffusion characteristic of acute ischemia; and (D) ADC map showing a corresponding hypointense (dark) signal, confirming that the DWI hyperintensity represents true restricted diffusion rather than T2 shine-through. The infarct demonstrates mass effect with partial effacement of the ipsilateral lateral ventricle. This comparison set is an educational tool for identifying the radiological evolution and multi-sequence presentation of acute stroke in neuroradiology.
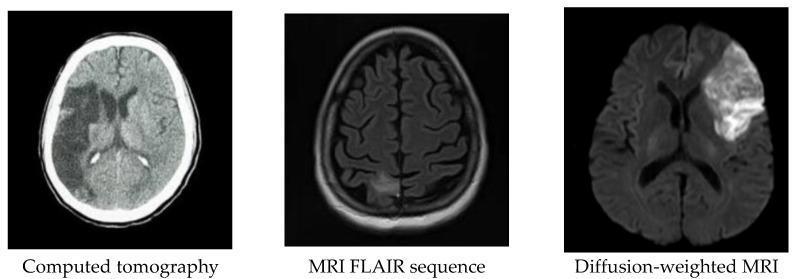
A comparison of diagnostic neuroimaging modalities showing acute ischemic stroke in axial brain slices. The first image is a non-contrast Computed Tomography (CT) scan displaying a large, wedge-shaped area of hypodensity in the right hemisphere, consistent with a Middle Cerebral Artery (MCA) territory infarct and associated cytotoxic edema. The second image is an MRI Fluid Attenuated Inversion Recovery (FLAIR) sequence, which demonstrates the infarct as a region of hyperintensity (bright signal) against the dark, signal-suppressed cerebrospinal fluid (CSF). The third image is a Diffusion-Weighted Imaging (DWI) MRI, showcasing the same pathology as a prominent hyperintense region. This bright signal on DWI indicates restricted water diffusion, which is a hallmark of acute cerebral ischemia. The panel illustrates how different imaging sequences enhance the contrast between normal and infarcted neural tissue, facilitating early stroke identification and localization.
stroke MRI imaging findings
Stroke MRI Findings
Key MRI Sequences and Their Role
1. Diffusion-Weighted Imaging (DWI) + ADC Map - The Most Important Sequences
| Finding | DWI | ADC Map |
|---|---|---|
| Acute infarct (true restricted diffusion) | Bright (hyperintense) | Dark (hypointense) |
| T2 shine-through (old stroke/edema) | Bright | Normal or bright |
| Vasogenic edema | Variable | Bright (facilitated diffusion) |
-
The DWI bright signal persists for 10-14 days, after which it fades
-
ADC values reach a nadir at 3-5 days, remaining low until day 7 after onset
-
The DWI/ADC combination is what distinguishes true acute infarction from mimics like T2 shine-through
-
Bradley and Daroff's Neurology in Clinical Practice - DWI with ADC mapping "considered to be the most sensitive method for imaging acute ischemia. In humans, the hyperintense signal indicating restriction of diffusion is detected within minutes after onset."
-
Adams and Victor's Principles of Neurology, 12th Edition - "reveals the abnormalities of ischemic stroke earlier than standard T1- or T2-weighted MRI, or CT, and with greater sensitivity and resolution."
2. FLAIR (Fluid-Attenuated Inversion Recovery)
- CSF signal is suppressed (appears dark), making periventricular and cortical lesions easier to see
- FLAIR shows no abnormality in the first few hours of acute stroke (this lag is key)
- After several hours: shows the infarct as bright (hyperintense) signal
- The DWI-FLAIR mismatch (DWI positive but FLAIR negative) indicates a stroke is within the ~4.5 hour thrombolysis window or is of unknown onset time - this is clinically used to select patients for IV thrombolysis who present late or with wake-up stroke
3. T1-Weighted
- Stroke appears isointense or hypointense in the acute phase (often normal initially)
- In subacute phase: swelling and cortical laminar necrosis may appear
- Gadolinium contrast shows enhancement in areas of blood-brain barrier disruption (appears ~1 week after ischemic stroke, peaks ~2-4 weeks)
4. T2-Weighted
- Stroke appears bright (hyperintense) - sensitive to fluid (edema, gliosis)
- Both acute and chronic strokes appear bright on T2
- Does not appear abnormal until a few hours after stroke onset
- Combined with DWI to distinguish acute from old infarcts
5. MR Angiography (MRA)
- Demonstrates vessel occlusion or stenosis causing the stroke
- Identifies large vessel occlusion (LVO) - essential for endovascular thrombectomy planning
- Superior to CTA for arterial dissection (not affected by plaque calcification)
- Evaluates carotid and vertebral arteries for embolic sources
6. MR Perfusion
- Maps cerebral blood flow, volume, and time-to-peak
- Delineates the ischemic penumbra (tissue at risk but still salvageable) vs. the infarct core (irreversibly damaged)
- Perfusion-DWI mismatch = penumbra = target for intervention
- Helps select patients for thrombectomy beyond 6-24 hours
7. Susceptibility-Weighted Imaging (SWI) / Gradient Echo T2*
- Detects even tiny amounts of hemosiderin from old hemorrhage as black areas
- Identifies microbleeds (important for hemorrhagic risk assessment before thrombolysis)
- Detects the hypointense "blooming" from intravascular thrombus (susceptibility vessel sign)
Temporal Evolution of Ischemic Stroke on MRI
| Time Phase | DWI | ADC | FLAIR | T2 | T1 |
|---|---|---|---|---|---|
| Hyperacute (0-6 h) | Bright | Dark | Normal/subtle | Normal | Normal |
| Acute (6-24 h) | Bright | Dark | Becoming bright | Becoming bright | Hypointense |
| Subacute early (1-3 days) | Bright | Dark (nadir 3-5 days) | Bright | Bright | Hypointense |
| Subacute late (1-3 weeks) | Fading/T2 shine-through | Pseudonormalization then bright | Bright | Bright | Gadolinium enhancement |
| Chronic (>3 weeks) | Normal (DWI fades) | Bright | Bright; eventually hypointense (gliosis/encephalomalacia) | Bright (cavitation) | Hypointense (cystic) |
- Bradley and Daroff's Neurology - ADC values "reach a nadir at 3-5 days but remain significantly low until the seventh day after onset," followed by pseudonormalization and then elevated ADC (T2 shine-through) in the late subacute phase.
DWI-FLAIR Mismatch - Clinical Importance
- DWI bright + FLAIR negative = stroke likely within 4.5 hours (or wake-up stroke)
- These patients can still benefit from IV thrombolysis and/or thrombectomy even if time of onset is unknown
- Careful patient selection with this mismatch has extended thrombectomy windows up to 24 hours in some protocols
Hemorrhagic Stroke (Intracerebral Hemorrhage) on MRI
| Phase | T1 | T2 | Notes |
|---|---|---|---|
| Hyperacute (<24 h) | Isointense | Bright | Oxyhemoglobin |
| Acute (1-3 days) | Isointense/dark | Dark | Deoxyhemoglobin |
| Subacute early (3-7 days) | Bright rim | Dark | Methemoglobin (intracellular) |
| Subacute late (>7 days) | Bright | Bright | Methemoglobin (extracellular) |
| Chronic (weeks-months) | Dark rim | Dark | Hemosiderin deposition |
- SWI shows chronic hemosiderin as persistent dark "blooming"
- Late subacute venous stroke: FLAIR shows hypointense signal in temporal lobe from hemosiderin deposition (as shown in Bradley and Daroff's Neurology)
MRI vs CT in Stroke
| Feature | MRI | CT |
|---|---|---|
| Acute ischemia detection | Excellent (DWI within minutes) | Poor in first 6-12h |
| Posterior fossa infarcts | Excellent | Poor (streak artifact) |
| Small deep infarcts | Excellent | Poor |
| Hemorrhage (acute) | Comparable | Excellent |
| Availability | Limited | Widely available |
| Speed | Slower | Fast |
Illustrative MRI Images
Quick Summary Mnemonic for Acute Ischemic Stroke
- DWI bright + ADC dark = acute infarct (within minutes)
- DWI bright + FLAIR dark = hyperacute (< ~4.5h - treat!)
- T2/FLAIR bright = acute-to-chronic (hours onwards)
- SWI dark blooming = hemorrhage/microbleeds
- MRA vessel cutoff = large vessel occlusion - consider thrombectomy