
Cardiac dominance to get full marks in mbbs first year anatomy university practicals
cardiac dominance coronary artery right left dominant diagram
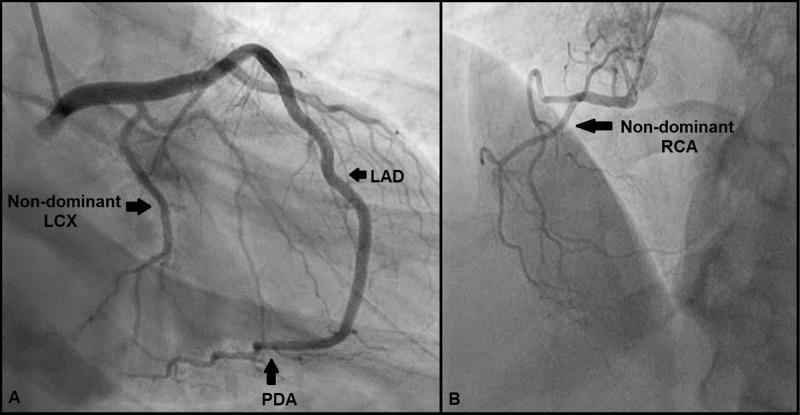
Diagnostic Imaging: These coronary angiograms illustrate a unique anatomical variation in cardiac coronary circulation dominance. Panel A, captured in a Right Anterior Oblique (RAO) with caudal angulation view, demonstrates a 'super-dominant' left anterior descending (LAD) artery. The LAD is seen wrapping around the left ventricular apex and continuing into the posterior interventricular groove to become the posterior descending artery (PDA), a territory typically supplied by the right coronary artery or left circumflex artery. A small, non-dominant left circumflex (LCX) artery is also visible. Panel B, in a Left Anterior Oblique (LAO) with cranial angulation view, shows a small, non-dominant right coronary artery (RCA) that does not reach the crux or provide the PDA. This image pair is an educational example of coronary anatomy variants, highlighting the LAD-to-PDA continuation in the absence of traditional RCA or LCX dominance. The findings demonstrate a rare left-dominant system where the LAD supplies the posterior diaphragmatic surface of the heart.
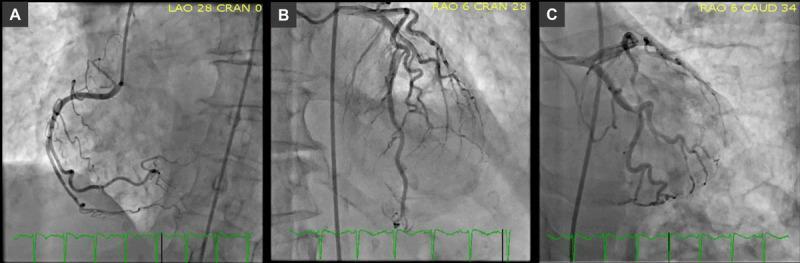
A composite diagnostic image featuring three panels (A, B, C) of invasive coronary angiography demonstrating a normal coronary anatomy with right dominance. Panel A shows a Left Anterior Oblique (LAO) view of a dominant Right Coronary Artery (RCA). The vessel originates from the right aortic sinus and follows the atrioventricular groove, providing robust perfusion to the inferior wall of the myocardium via the posterior descending artery (PDA). Panel B presents a Right Anterior Oblique (RAO) cranial view of the Left Anterior Descending (LAD) artery. The LAD is seen traversing the anterior interventricular groove with patent diagonal branches and septal perforators, showing no flow-limiting stenoses or atherosclerotic lesions. Panel C displays the Left Circumflex (LCx) artery and its obtuse marginal branches in an RAO caudal projection, also exhibiting smooth vessel caliber and patent flow. The images collectively serve as a reference for normal coronary distribution and the absence of obstructive coronary artery disease in a clinical workup for cardiac dysfunction, such as stress-induced cardiomyopathy.
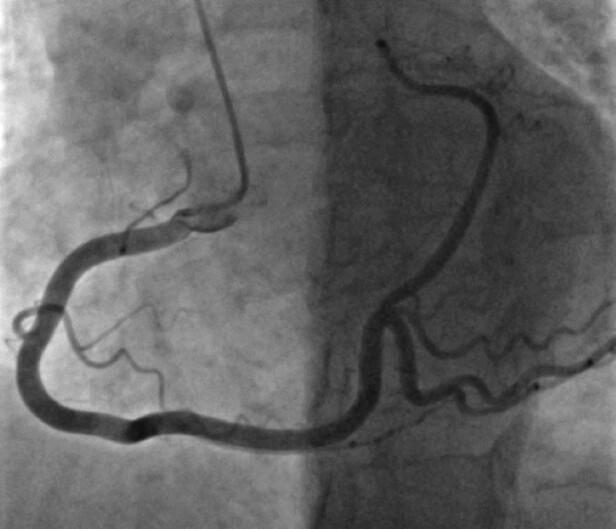
This diagnostic image is a coronary angiogram (fluoroscopic x-ray) demonstrating a right-dominant coronary circulation. The primary focus is the Right Coronary Artery (RCA), which follows a characteristic 'C-shaped' trajectory within the right atrioventricular groove. The vessel exhibits typical anatomy, bifurcating at the crux of the heart into two significant terminal branches: the Posterior Descending Artery (PDA), which travels inferiorly to supply the posterior interventricular septum, and a prominent Posterolateral (PL) branch that travels toward the lateral wall, occupying the territory usually associated with the Left Circumflex Artery (LCX). The image displays the branching pattern and vessel morphology essential for assessing coronary artery disease. A subtle luminal irregularity or darkening is visible along the horizontal segment of the main vessel before the distal bifurcation, which may indicate atherosclerotic plaque or a focal stenosis. This visual serves as an educational example of coronary dominance and normal vs. variant coronary anatomy during cardiac catheterization.
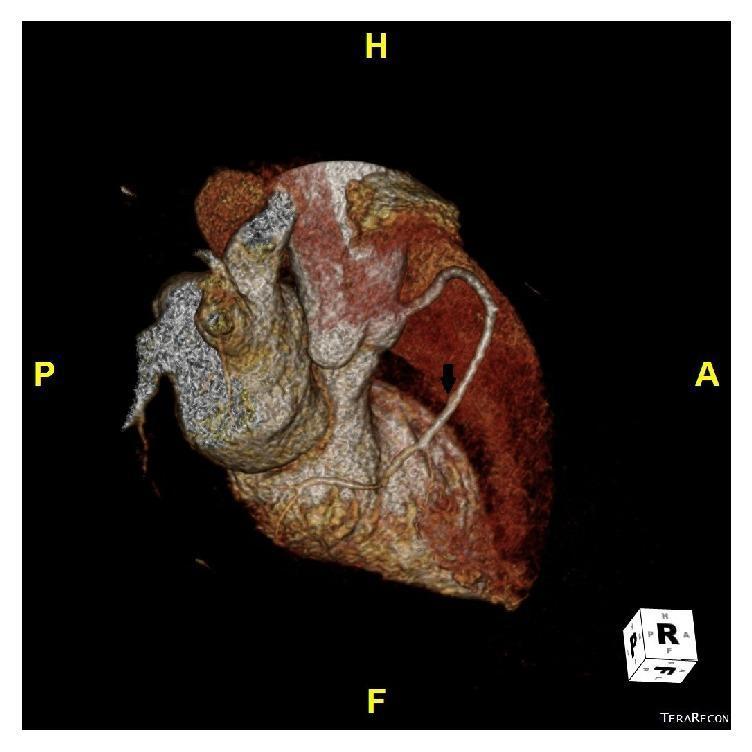
Diagnostic image showing a three-dimensional (3D) volume-rendered reconstruction of the heart from a Coronary Computed Tomography Angiogram (CCTA). The image presents an inferior-oblique perspective, with anatomical orientation markers for Anterior (A), Posterior (P), Head (H), and Foot (F). The primary finding is a super-dominant Right Coronary Artery (RCA), indicated by a black arrow, which exhibits a large caliber and extended course across the diaphragmatic surface of the heart. This vascular morphology is often associated with the congenital absence or hypoplasia of the left circumflex artery (LCX), where the RCA compensates by providing perfusion to the lateral and posterior territories of the left ventricle. The 3D rendering uses color-coded tissue density mapping to differentiate between myocardial surface, vascular structures, and the cardiac base. This visualization is clinically significant for evaluating coronary artery anomalies, vascular dominance patterns, and surgical or interventional planning in patients with exertional dyspnea or atypical chest pain.
coronary artery anatomy posterior descending artery crux of heart
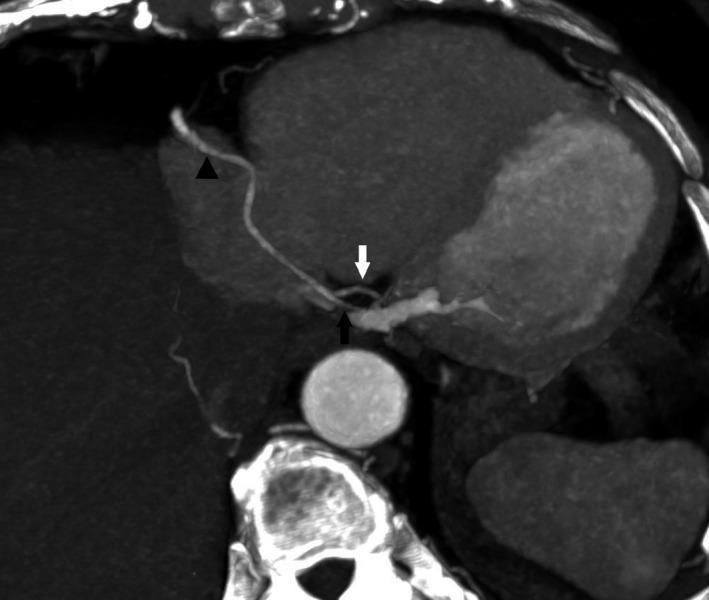
This diagnostic image is an axial slice from a Computed Tomography Coronary Angiography (CTCA) showcasing cardiac vascular anatomy. The image demonstrates right coronary dominance, a condition where the right coronary artery (RCA) supplies the posterior interventricular septum. The RCA is marked by a black triangle as it courses along the right atrioventricular groove. At the crux of the heart, the RCA is seen bifurcating into two primary terminal branches: the posterior descending artery (PDA), indicated by a white arrow, and the posterior left ventricular (PLV) branch, indicated by a black arrow. These vessels are shown in relation to the descending aorta and the cardiac chambers. This visual is significant for illustrating variations in coronary artery anatomy and dominance, specifically highlighting how the RCA compensates for territories usually supplied by the left circumflex artery in cases of right-side dominance. The image serves as a high-level educational resource for cardiology and radiology students to understand coronary branching patterns and vascular distribution.
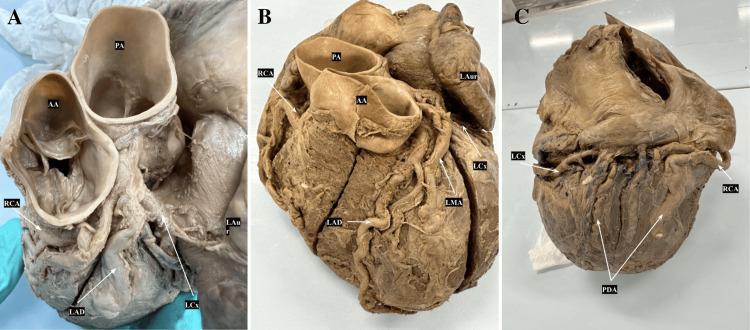
This set of three clinical photographs (A, B, and C) displays a dissected human heart specimen to illustrate coronary artery anatomy and branching patterns. Image A provides an anterosuperior view, highlighting the origins of the Right Coronary Artery (RCA) from the right aortic sinus and the Left Anterior Descending (LAD) and Left Circumflex (LCx) arteries near the Ascending Aorta (AA) and Pulmonary Artery (PA). Image B shows an anterior view of the heart, detailing the LAD descending in the anterior interventricular groove, the LCx wrapping around the left auricle (LAur), and the Left Marginal Artery (LMA) branching from the LCx. Image C presents a posterior view demonstrating a codominant coronary system. In this specimen, the Posterior Descending Artery (PDA) is formed by contributions from both the terminal branches of the RCA and the LCx as they meet at the crux of the heart. These images serve as educational material for cardiovascular anatomy, specifically focusing on variations in coronary dominance and the structural relationship between major epicardial vessels.
This diagnostic image is a coronary angiogram (fluoroscopic x-ray) demonstrating a right-dominant coronary circulation. The primary focus is the Right Coronary Artery (RCA), which follows a characteristic 'C-shaped' trajectory within the right atrioventricular groove. The vessel exhibits typical anatomy, bifurcating at the crux of the heart into two significant terminal branches: the Posterior Descending Artery (PDA), which travels inferiorly to supply the posterior interventricular septum, and a prominent Posterolateral (PL) branch that travels toward the lateral wall, occupying the territory usually associated with the Left Circumflex Artery (LCX). The image displays the branching pattern and vessel morphology essential for assessing coronary artery disease. A subtle luminal irregularity or darkening is visible along the horizontal segment of the main vessel before the distal bifurcation, which may indicate atherosclerotic plaque or a focal stenosis. This visual serves as an educational example of coronary dominance and normal vs. variant coronary anatomy during cardiac catheterization.
Cardiac Dominance - Complete Exam Answer
Definition (Most Important - Start Here)
- The coronary artery - either the Right Coronary Artery (RCA) or the Left Circumflex Artery (LCx) - that gives rise to the PDA AND supplies the posterior third of the interventricular septum and the inferior/posterior wall of the left ventricle is called the dominant artery.
"By convention, the coronary artery - either RCA or LCX - that gives rise to the posterior descending artery and thereby perfuses portions of the inferior/posterior left ventricle and the posterior third of the septum is considered the dominant vessel." - Robbins & Kumar Basic Pathology
Types of Cardiac Dominance
| Type | Artery giving PDA | Incidence |
|---|---|---|
| Right Dominant | Right Coronary Artery (RCA) | ~80-85% |
| Left Dominant | Left Circumflex Artery (LCx) | ~10-15% |
| Co-dominant (Balanced) | Both RCA + LCx contribute | ~5-10% |
What is the Posterior Descending Artery (PDA)?
- Also called the Posterior Interventricular Artery
- Runs in the posterior interventricular groove (inferior interventricular sulcus)
- Supplies:
- Inferior (posterior) wall of the left ventricle
- Posterior 1/3 of the interventricular septum
- AV nodal branch (in right dominant hearts - the RCA gives the AV nodal artery)
The Crux of the Heart - Critical Anatomy Point
- The posterior interventricular groove meets
- The atrioventricular groove meets (right and left)
- This is the key landmark - the dominant artery reaches the crux and gives off the PDA here
Why Does Dominance Matter? (Clinical Significance for Viva)
-
MI Patterns: In right dominant hearts, RCA occlusion causes posterior septal and inferior wall infarction. In left dominant hearts, LCx occlusion causes lateral + posterior wall + posterior septal infarction. (Robbins & Kumar)
-
AV Node Blood Supply: In ~85% of people (right dominant), the AV nodal artery comes from the RCA. So RCA occlusion can cause complete heart block - a critical viva point.
-
SA Node Blood Supply: The SA nodal artery arises from the RCA in ~60% and from the LCx in ~40%.
-
CABG/PCI Planning: Surgeons must know dominance before coronary bypass or stenting to understand which territories are at risk.
Coronary Artery Overview (Context for Dominance)
Right Coronary Artery (RCA)
- Origin: Right sinus of Valsalva (right aortic sinus)
- Course: Right atrioventricular groove
- Branches: SA nodal artery (60%), acute marginal, AV nodal artery (85%), PDA (in right dominant)
Left Coronary Artery (LCA)
- Origin: Left sinus of Valsalva
- Divides into LAD (Left Anterior Descending) + LCx (Left Circumflex)
- LAD: anterior interventricular groove, supplies anterior 2/3 of septum, anterior LV wall
- LCx: left atrioventricular groove, obtuse marginal branches; gives PDA only in left dominant
Standard Viva Questions & Model Answers
Memory Tricks
- "Right is Right" - Right dominance is the NORMAL/common type (80%)
- "Crux = Cross" - Dominance is determined at the crux (crossing point) of the grooves
- PDA from RCA = Right dominant (most common, like "right is standard")
- AV node from dominant = always remember AV node = dominant artery's territory
Visual Reference
Quick Revision Summary Card
| Point | Fact |
|---|---|
| Definition of dominance | Artery giving rise to PDA |
| Right dominant | 80-85% (most common) |
| Left dominant | 10-15% |
| Co-dominant | ~5-10% |
| PDA location | Posterior interventricular groove |
| PDA supplies | Posterior 1/3 septum + inferior LV |
| AV node supply | Dominant artery (RCA in 85%) |
| SA node supply | RCA (60%) or LCx (40%) |
| Crux of heart | Posterior junction of AV + IV grooves |
Full sequence of conducting system of heart to get full marks
conducting system of heart SA node AV node bundle of His Purkinje fibers diagram anatomy
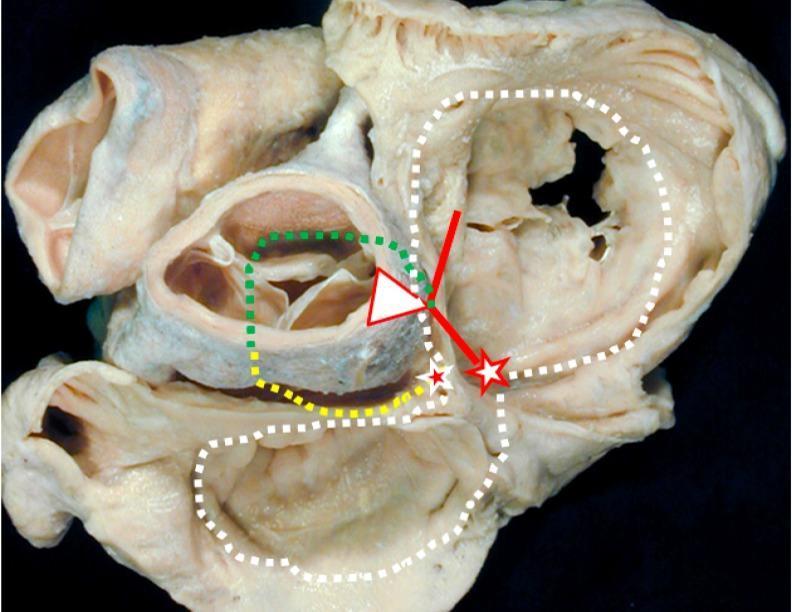
Anatomical Diagram over a clinical photograph of a gross cardiac specimen, viewed from the atrial aspect (superior view) of the cardiac base. The image illustrates the complex anatomy of the cardiac conduction system and vestigial embryonic structures. Key landmarks include the atrioventricular (AV) node (white star with red borders) and the retroaortic node (red star with white borders). The conduction pathway is delineated by a solid red line representing the bundle of His. Supplemental embryonic and auxiliary tracts are marked with dotted lines: a green dotted line shows the 'dead-end tract' continuing from the AV conduction axis toward the outflow tract; a yellow dotted line marks the retro-aortic ring branch; and a white dotted line traces the path of the embryonic atrioventricular ring. This visual is designed for advanced medical education in cardiac electrophysiology and embryology, highlighting the anatomical basis for idiopathic ventricular arrhythmias and the clinical significance of persistent embryonic tissues within the heart's conduction framework.
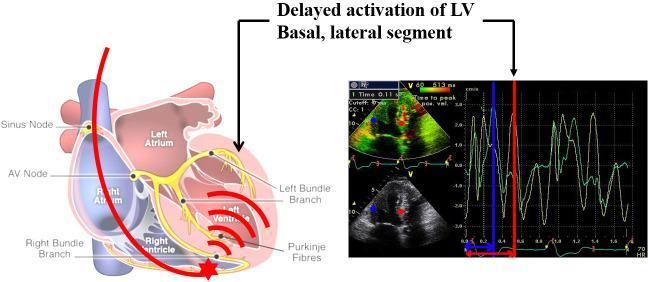
This composite medical illustration demonstrates the pathophysiology of right ventricular (RV) pacing-induced left ventricular (LV) dyssynchrony. The left side features a schematic anatomical diagram of the heart showing the cardiac conduction system (Sinus node, AV node, Bundle branches, and Purkinje fibers). A red line represents a pacing lead traversing the right atrium to the RV apex (marked by a red star). Red wavefront arcs illustrate electrical activation spreading from the RV pacing site to the LV, highlighting the late activation of the LV lateral wall. The right side contains diagnostic images, including a color tissue Doppler echocardiogram and a corresponding velocity-time tracing. The Doppler tracing shows two distinct myocardial velocity curves (green) with vertical blue and red marker lines indicating the significant temporal delay between segmental contractions. A label and arrows point to both the LV basal lateral segment on the diagram and the delayed peak on the Doppler tracing, identifying the mechanical dyssynchrony resulting from the non-physiological electrical sequence of RV apical pacing.
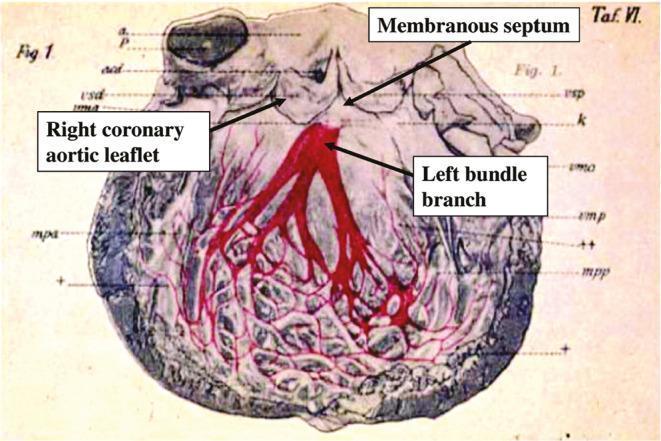
This anatomical diagram illustrates the cardiac conduction system within the left ventricle of a human heart. The visual highlights the left bundle branch (LBB) and its subsequent fascicular branching patterns, rendered in a bold red color against a neutral-toned anatomical background. Key structures identified via labels include the membranous septum and the right coronary aortic leaflet, providing critical landmarks for the origin of the left bundle. The diagram depicts the hierarchical organization of the conduction fibers, showing how the main left bundle branch emerges near the membranous septum and diverges into anterior and posterior divisions. These divisions further subdivide into an intricate, reticular network of Purkinje fibers that spread extensively across the ventricular myocardium. This illustration serves an educational purpose in cardiology and anatomy, demonstrating the subendocardial distribution of the electrical pathways responsible for synchronous ventricular contraction.
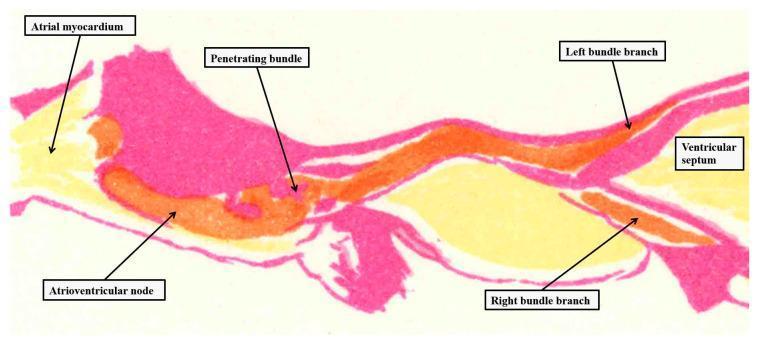
This medical illustration is a color-coded anatomical diagram depicting the atrioventricular (AV) conduction axis of the heart, based on a historical plate by Tawara and reoriented for attitudinal clarity. The diagram utilizes a longitudinal cross-sectional view to map the electrical pathway through the cardiac tissues. The atrial chambers and atrial myocardium are positioned on the left, while the ventricular septum and ventricular chambers are on the right. Key structures are differentiated by color: orange indicates the conduction axis, yellow represents the working myocardium, and purple (or dark pink) denotes the insulating fibrous tissues of the AV junction. Labeled components of the conduction system include the atrioventricular node, the penetrating bundle, and the bifurcation into the left bundle branch and right bundle branch. The image highlights the anatomical relationship between the specialized conducting cells and the adjacent insulating planes, demonstrating how the electrical impulse traverses from the atria to the ventricles while being sequestered from non-conducting myocardial masses.
Conducting System of the Heart - Complete MBBS Anatomy Answer
The Classic Diagram (Guyton & Hall, 14e)
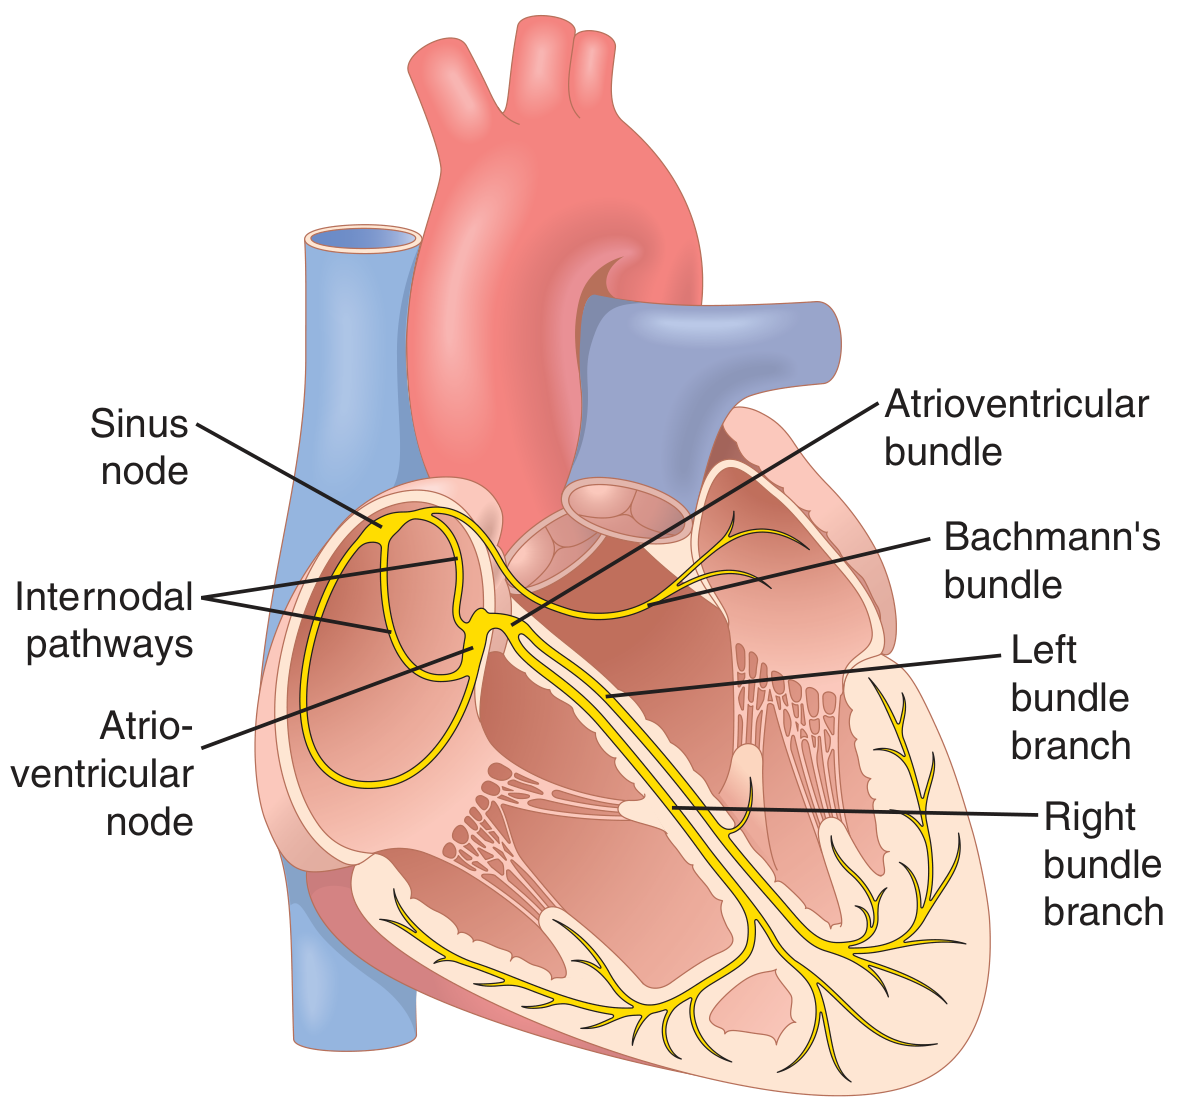
The Full Sequence - Step by Step
SA Node → Internodal Tracts (+ Bachmann's Bundle) → AV Node
→ Bundle of His (AV Bundle) → Right & Left Bundle Branches
→ Purkinje Fibers → Ventricular Myocardium
1. SA Node (Sinoatrial Node / Keith-Flack Node)
2. Internodal Tracts (SA → AV Node)
| Tract | Eponym |
|---|---|
| Anterior internodal tract | Bachmann's bundle (also sends branch to LEFT atrium - interatrial conduction) |
| Middle internodal tract | Wenckebach's tract |
| Posterior internodal tract | Thorel's tract |
3. AV Node (Atrioventricular Node / Aschoff-Tawara Node)
- Coronary sinus opening (posteriorly)
- Septal cusp (anterior leaflet) of the tricuspid valve
- Tendon of Todaro
- Receives impulse from atria
- DELAYS conduction by ~0.1 second (AV delay) - this is the MOST IMPORTANT function
- Why delay? Allows atria to finish contracting and fill ventricles before ventricular contraction begins
- Acts as a secondary pacemaker (escape rate: 40-60 bpm) if SA node fails
4. Bundle of His (AV Bundle / His Bundle)
5. Right and Left Bundle Branches
Right Bundle Branch (RBB)
- Travels as a discrete, compact cord down the right side of the interventricular septum
- Passes through the septomarginal trabecula (moderator band) to reach the anterior papillary muscle of the right ventricle
- Fans out as subendocardial plexus
Left Bundle Branch (LBB)
- Fans out as flat, broad bundles along the left side of the interventricular septum
- Divides into two major fascicles:
- Left anterior fascicle (to anterior papillary muscle)
- Left posterior fascicle (to posterior papillary muscle)
- Left posterior fascicle is broader and more resistant to block
6. Purkinje Fibers (Subendocardial Branches)
- Largest cells in the myocardium (larger than ventricular muscle cells)
- Rich in glycogen - stain pale with H&E, PAS-positive
- Myofibrils at the periphery of the cell
- Round, large nuclei (often absent from section due to cell size)
- Intercalated discs present but variable
- More resistant to hypoxia than ventricular muscle cells (due to glycogen)
7. Ventricular Myocardium
- Impulse spreads from endocardium to epicardium and from apex to base
- Papillary muscles contract FIRST (before ventricular walls) - prevents mitral/tricuspid valve prolapse during systole
Conduction Velocities - Table for Viva
| Structure | Conduction Velocity | Intrinsic Pacemaker Rate |
|---|---|---|
| SA Node | 0.05 m/s | 70-80 bpm (dominant) |
| Internodal tracts | 1 m/s | - |
| AV Node | 0.05 m/s (slowest) | 40-60 bpm |
| Bundle of His | 1 m/s | 40 bpm |
| Purkinje fibers | 4 m/s (fastest) | 15-40 bpm |
| Ventricular muscle | 1 m/s | 25-40 bpm |
ECG Correlation - Must Know
| ECG Component | Event |
|---|---|
| P wave | Atrial depolarization (SA node → atria) |
| PR interval | AV node delay (normal: 0.12-0.20 sec) |
| QRS complex | Ventricular depolarization (bundle branches → Purkinje → myocardium) |
| T wave | Ventricular repolarization |
Key Anatomical Relations - Viva Traps
- Triangle of Koch - AV node is at its apex; bounded by coronary sinus, tricuspid annulus, tendon of Todaro
- Moderator band (septomarginal trabecula) - contains the right bundle branch - clinically important in RBBB
- Membranous septum - the Bundle of His passes just beneath it; membranous VSD can damage the bundle
- Fibrous skeleton - electrically insulating; bundle of His is the ONLY electrical bridge across it
- Left bundle branch divides into anterior and posterior fascicles - hence left hemiblocks (LAFB, LPFB)
Blood Supply of Conduction System
| Structure | Blood Supply |
|---|---|
| SA node | RCA (60%), LCx (40%) |
| AV node | RCA in 85% (dominant artery) |
| Bundle of His | Dual: LAD + AV nodal artery |
| Right bundle branch | LAD (anterior septal perforators) |
| Left anterior fascicle | LAD |
| Left posterior fascicle | Dual: LAD + RCA (most protected) |